. 2014 Aug 26;15(8):443.
doi: 10.1186/s13059-014-0443-x.

SubcloneSeeker: a computational framework for reconstructing tumor clone structure for cancer variant interpretation and prioritization

SubcloneSeeker: a computational framework for reconstructing tumor clone structure for cancer variant interpretation and prioritization

Yi Qiao et al. Genome Biol. .

Abstract

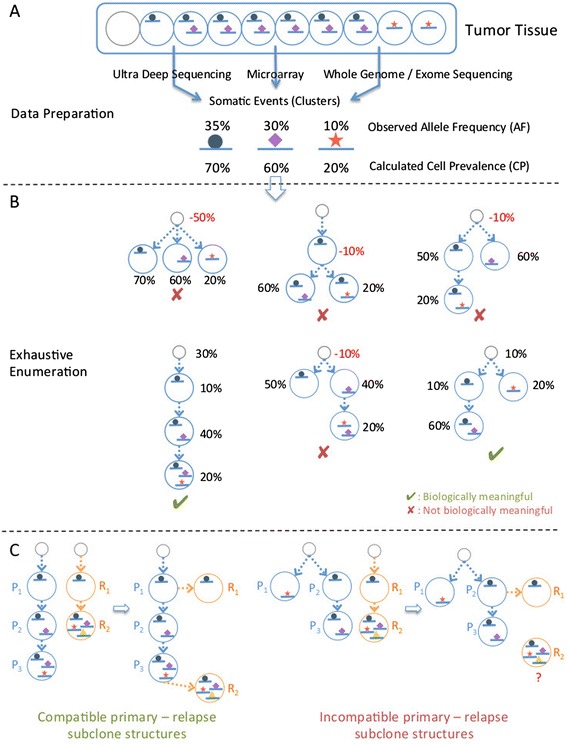
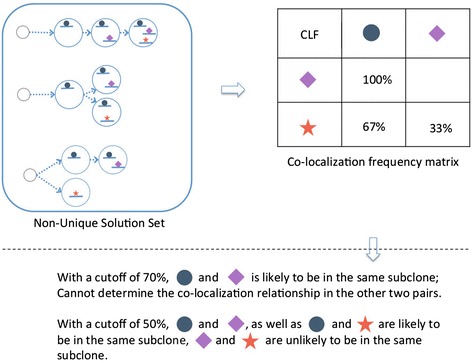
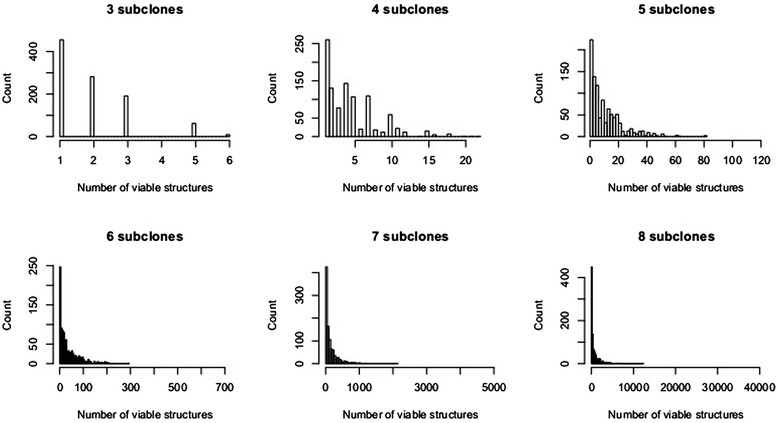
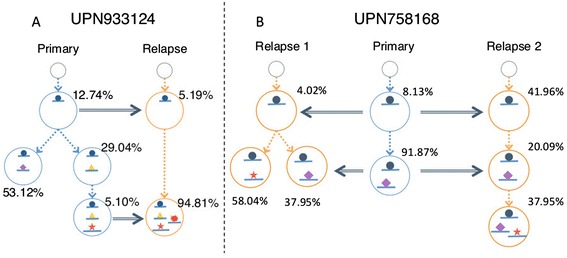
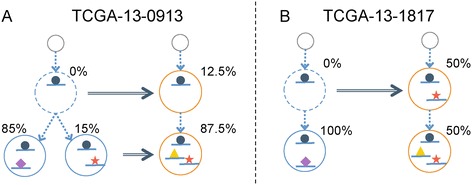
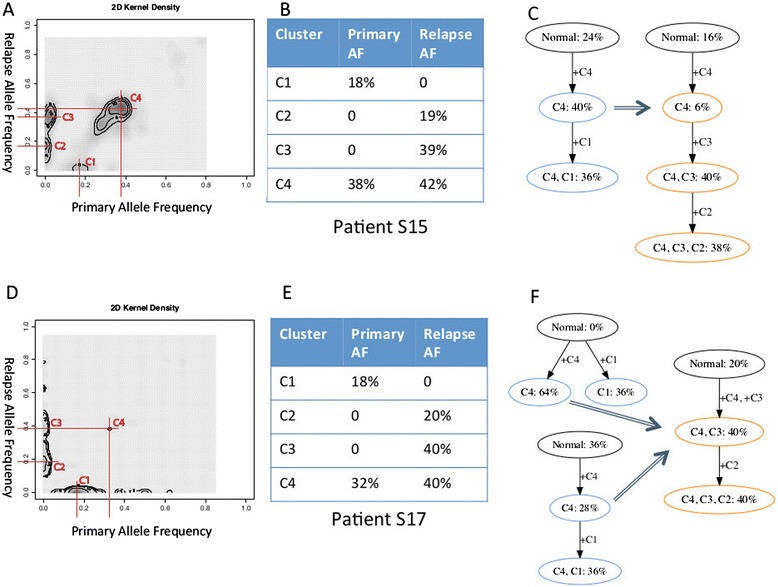
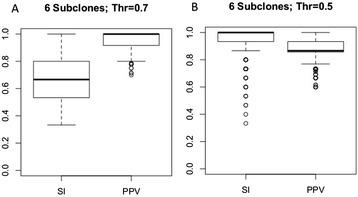
Many tumors are composed of genetically divergent cell subpopulations. We report SubcloneSeeker, a package capable of exhaustive identification of subclone structures and evolutionary histories with bulk somatic variant allele frequency measurements from tumor biopsies. We present a statistical framework to elucidate whether specific sets of mutations are present within the same subclones, and the order in which they occur. We demonstrate how subclone reconstruction provides crucial information about tumorigenesis and relapse mechanisms; guides functional study by variant prioritization, and has the potential as a rational basis for informed therapeutic strategies for the patient. SubcloneSeeker is available at: https://github.com/yiq/SubcloneSeeker.


Figures

Figure 1
Figure 1
SubcloneSeeker method overview. (A) Data preparation: genomic variation data (SNVs, CNVs, and so on) are converted into the corresponding cell prevalence (CP) values, and clustered into distinct groups. (B) Structure enumeration: based on the identified CP clusters, all possible subclone structures, represented as branching tree structures where one subclone is derived from its ‘predecessor’ by the addition of a mutation (or cluster of mutations), are visited. During the visit, each subclone on the tree structure is assigned a subclone frequency (SF) value so that the implied total CP values for mutations are in agreement with the input CP values. Those structures with negative SF values are removed from the solution set. (C) Solution trimming: the aim of this procedure is to merge the subclone structures from the relapse tumor (orange circles) those from the primary tumor (blue circles) from the same patient. Left panel: example showing a compatible pair of relapse/primary structures. Right panel: example showing a pair of incompatible relapse / primary subclone structures. A subclone in the relapse, R2, cannot be positioned anywhere within the primary subclone structure because it contains mutations found in separate primary subclones (P1 and P3.), and therefore cannot be derived from either one or the other.
Figure 2
Figure 2
Normal cell content estimated by subclone reconstruction in a controlled mixing experiment. Dataset is generated by mixing sequencing reads from a SNUC cell-line and matched normal tissue. Data points corresponding to the subclone structure representing linear mutation accumulation are shown with a red cross.
Figure 3
Figure 3
Predicting mutation co-localization. In cases where there are multiple viable subclone structures, we count the fraction of all structures within which two mutation events are co-localized. This fraction is the probability that the two events are present in the same subclone. One can also make a ‘co-localization call’ by declaring that two events are co-localized, if this probability is above a pre-defined threshold.
Figure 4
Figure 4
Number of biologically meaningful structures histogram based on simulation. Each plot is based on a set of 1,000 randomly generated subclone structures. The maximum value on the x axis of each plot represent the theoretical upper limit on the number of solutions, n!, given n CP values. The distributions are heavily compressed towards the left, suggesting that the actual number of biologically meaningful structures is usually small.
Figure 5
Figure 5
Our re-analysis of published primary/relapse AML dataset in Ding et al. Primary, relapse, and merged subclone structures for two patients, reconstructed with SubcloneSeeker. (A) SubcloneSeeker analysis found six alternative primary subclone structures for patient UPN933124. Only one is compatible with the relapse subclone structure, and the pair is in agreement with the original study. (B) Each of the two viable merged primary/relapse subclone structures for patient UPN75816 suggests that the two primary subclones made it to the relapse tumor, and further expanded.
Figure 6
Figure 6
Two relapse patterns in a TCGA primary-relapse ovarian tumor dataset. (A) TCGA-13-0913 exemplifies a recursion pattern in which the relapse subclones are originated from multiple subclones in the primary, suggesting inadequate primary treatment. (B) TCGA-13-1817 signifies a different pattern in which one subclone in the primary acquired new mutations, became resistant to primary chemotherapy, and gave rise to the entire relapse tumor mass.
Figure 7
Figure 7
Analysis of whole-exome sequencing data on patient S15 and S17 from chemo-resistant relapse vs. primary ovarian cancer dataset. (A) Clustering of somatic mutations in patient S15. (B) Mutation clusters and CP values in S15 primary and relapse. (C) Uniquely identified, compatible S15 primary and relapse subclone evolution tree. (D) Clustering of S17 somatic mutations in patient S17. (E) Mutation clusters and CP values in S17 primary and relapse. (F) Two viable structures for S17 primary, and a sole structure for S17 relapse.
Figure 8
Figure 8
Performance of mutation co-localization prediction on simulated data. (A) Co-localization prediction statistics on simulated dataset with six subclones in each tumor sample, and a threshold of 0.7. SI - Combined Sensitivity; PPV - Combined positive predictive value; (B) Co-localization prediction statistics on simulated dataset with six subclones in each tumor sample, and a CLF threshold at 0.5.
Figure 9
Figure 9
Analysis results on patient SU048 HSC sample in Jan et al. (A) Our model of subclone evolution constructed based on co-localization probabilities. Left: Consensus structure supported by all subclone structures. Right: Consensus structure supported by at least 50% of subclone structures. (B) Model of subclone evolution reported in Jan et al. constructed based on colony assay results.

References

    1. Pleasance ED, Cheetham RK, Stephens PJ, McBride DJ, Humphray SJ, Greenman CD, Varela I, Lin ML, Ordonez GR, Bignell GR, Ye K, Alipaz J, Bauer MJ, Beare D, Butler A, Carter RJ, Chen L, Cox AJ, Edkins S, Kokko-Gonzales PI, Gormley NA, Grocock RJ, Haudenschild CD, Hims MM, James T, Jia M, Kingsbury Z, Leroy C, Marshall J, Menzies A, et al. A comprehensive catalogue of somatic mutations from a human cancer genome. Nature. 2010;463:191–196. doi: 10.1038/nature08658. - DOI - PMC - PubMed
    1. Lawrence MS, Stojanov P, Polak P, Kryukov GV, Cibulskis K, Sivachenko A, Carter SL, Stewart C, Mermel CH, Roberts SA, Kiezun A, Hammerman PS, McKenna A, Drier Y, Zou L, Ramos AH, Pugh TJ, Stransky N, Helman E, Kim J, Sougnez C, Ambrogio L, Nickerson E, Shefler E, Cortes ML, Auclair D, Saksena G, Voet D, Noble M, DiCara D, et al. Mutational heterogeneity in cancer and the search for new cancer-associated genes. Nature. 2013;499:214–218. doi: 10.1038/nature12213. - DOI - PMC - PubMed
    1. Gonzalez-Perez A, Mustonen V, Reva B, Ritchie GR, Creixell P, Karchin R, Vazquez M, Fink JL, Kassahn KS, Pearson JV, Bader GD, Boutros PC, Muthuswamy L, Ouellette BF, Reimand J, Linding R, Shibata T, Valencia A, Butler A, Dronov S, Flicek P, Shannon NB, Carter H, Ding L, Sander C, Stuart JM, Stein LD, Lopez-Bigas N, International Cancer Genome Consortium Mutation P, Consequences Subgroup of the Bioinformatics Analyses Working G Computational approaches to identify functional genetic variants in cancer genomes. Nat Methods. 2013;10:723–729. doi: 10.1038/nmeth.2562. - DOI - PMC - PubMed
    1. Anderson K, Lutz C, van Delft FW, Bateman CM, Guo Y, Colman SM, Kempski H, Moorman AV, Titley I, Swansbury J, Kearney L, Enver T, Greaves M. Genetic variegation of clonal architecture and propagating cells in leukaemia. Nature. 2011;469:356–361. doi: 10.1038/nature09650. - DOI - PubMed
    1. Keats JJ, Chesi M, Egan JB, Garbitt VM, Palmer SE, Braggio E, Van Wier S, Blackburn PR, Baker AS, Dispenzieri A, Kumar S, Rajkumar SV, Carpten JD, Barrett M, Fonseca R, Stewart AK, Bergsagel PL. Clonal competition with alternating dominance in multiple myeloma. Blood. 2012;120:1067–1076. doi: 10.1182/blood-2012-01-405985. - DOI - PMC - PubMed

Publication types

LinkOut - more resources