. 2015 Mar;8(2):390-402.
doi: 10.1038/mi.2014.77. Epub 2014 Aug 27.

IL-23 activates innate lymphoid cells to promote neonatal intestinal pathology

Affiliations

IL-23 activates innate lymphoid cells to promote neonatal intestinal pathology

Lili Chen et al. Mucosal Immunol. 2015 Mar.

Abstract

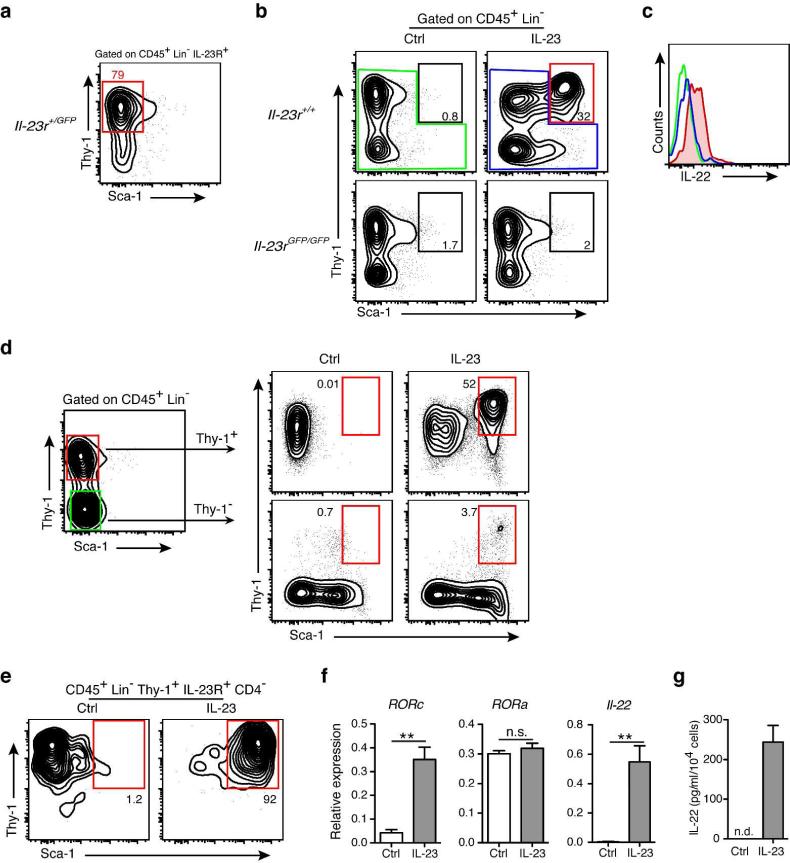
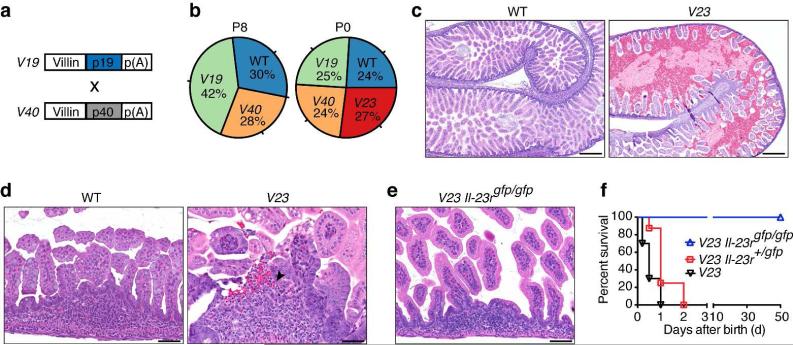
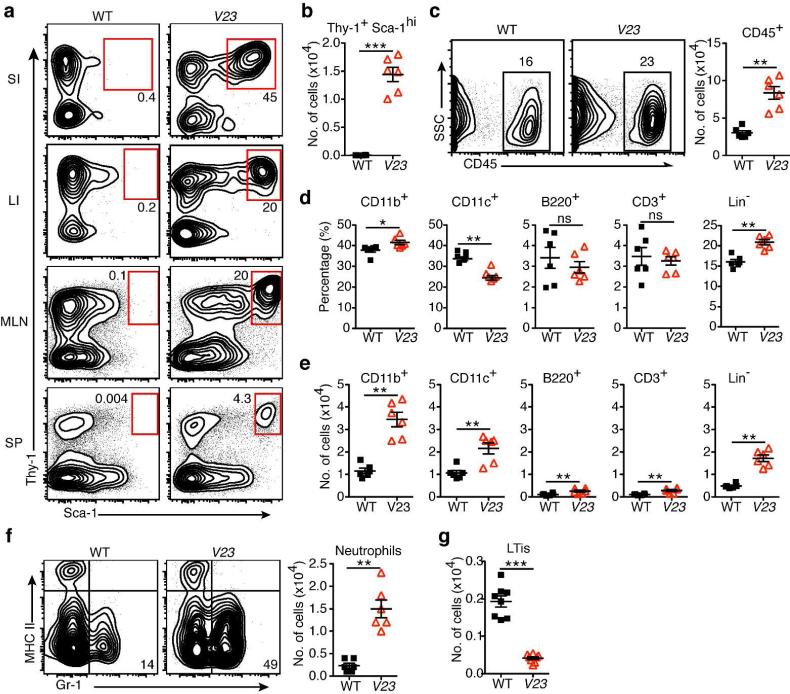
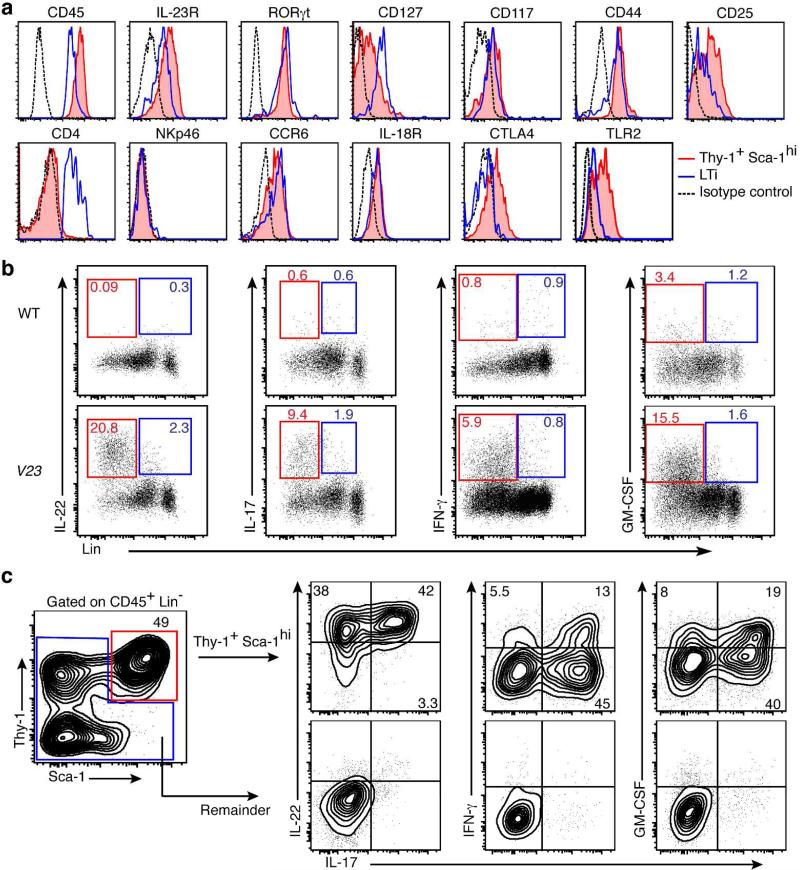
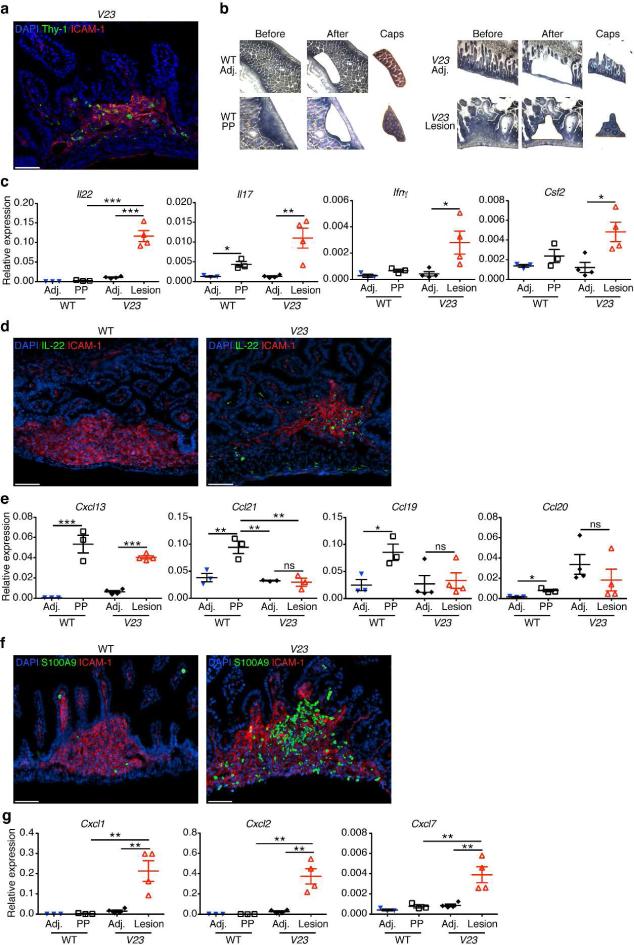
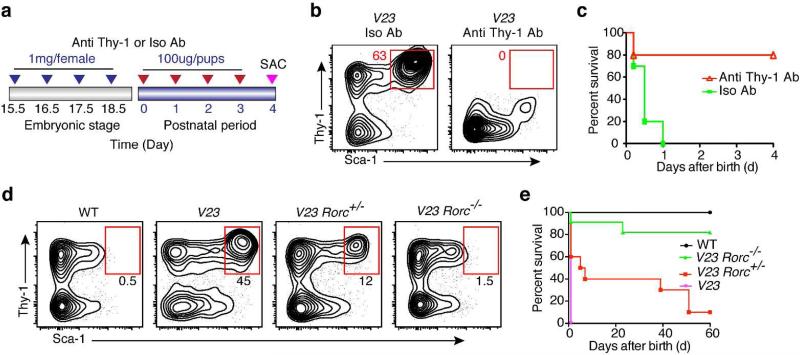
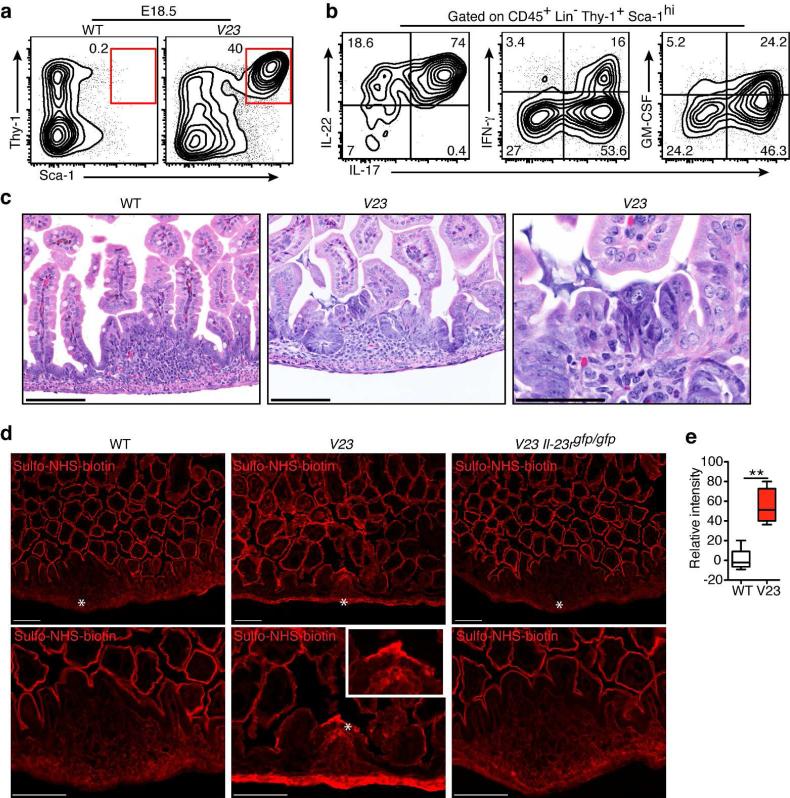
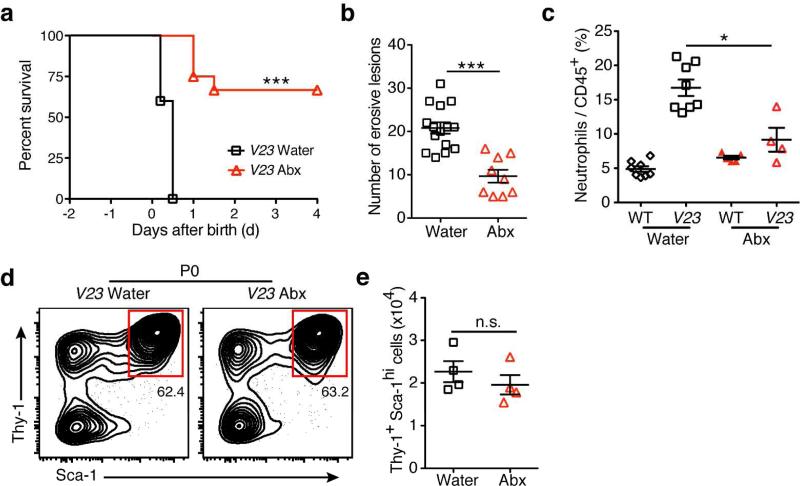
Interleukin-23 (IL-23) responsive group 3 innate lymphoid cells (ILC3s) have been implicated in immune homeostasis and pathogenesis in the adult, but little is known about their roles in the newborn. Here we show that IL-23 promotes conversion of embryonic intestinal Lin(-)IL-23R(+)Thy1(+) cells into IL-22-producing Thy1(+)Sca-1(hi) ILC3s in vitro. Gut-specific expression of IL-23 also activated and expanded Thy1(+)Sca-1(hi) ILC3s, which produced IL-22, IL-17, interferon gamma (IFN-γ), and granulocyte-macrophage colony-stimulating factor (GM-CSF) and were distinct from canonical CD4(+) lymphoid tissue inducer (LTi) cells. These ILC3s accumulated under the epithelium in intercellular adhesion molecule (ICAM)-1-positive cell aggregates together with neutrophils that disrupted the epithelium, leading to the formation of discrete intestinal erosions, bleeding, and neonatal death. Genetic and antibody depletion of ILC3s rescued the mice from neonatal death. Antibiotic treatment of pregnant mothers and offspring prolonged survival of IL-23 transgenic mice, suggesting a role for the commensal flora on ILC3-induced pathogenesis. Our results reveal a novel role for the IL-23-ILC3s axis in the pathogenesis of neonatal intestinal inflammation.


Figures

Figure 1
Figure 1. IL-23 promotes development of Thy1+Sca-1hi ILCs in vitro
(a) Flow cytometric analysis of Thy1 and Sca-1 expression of gated CD45+LinIL-23R+ cells from the intestine of Il-23r+/GFP mice at embryonic day E18.5. (b) In vitro stimulated CD45+Lin leukocyte subpopulations from the intestine of Il-23r+/+ and Il-23rGFP/GFP mice at embryonic day E18.5 with IL-23 (10ng/ml) or vehicle control for 72 hr. Representative flow cytometry plots showing CD45+LinThy1+Sca-1hi population after culture. (c) Intracellular cytokine stain of IL-22 expression by the populations shown in (b), colors correspond to the populations analyzed. (d) Culture of sorted LinThy1+ and LinThy1 cells from the wild-type intestine at embryonic day E18.5 respond to IL-23 (10ng/ml) or vehicle (Ctrl) stimulation after 72 hr. Representative flow cytometry plots showing CD45+LinThy1+Sca-1hi population after culture. (e) Representative flow cytometry plots showing sorted LinThy1+IL-23R+CD4 cells from the intestine of Il-23r+/GFP mice at embryonic day E18.5 respond to IL-23 (10ng/ml) or vehicle (Ctrl) stimulation after 72 hr. (f) Quantitative RT-PCR analysis of Il-22, Rorc and Rora mRNA expression in the Lin-Thy1+IL-23R+CD4 cells stimulated with control media (Ctrl) or IL-23. NS, not significant. ** P < 0.01. (g) ELISA evaluation of IL-22 in the culture supernatant of the LinThy1+IL-23R+CD4 cells stimulated with control media (Ctrl) or IL-23. Data are shown as means ± s.e.m., n = 3–5 per group. ND, not detectable. Results are representative of three independent experiments.
Figure 2
Figure 2. Transgenic expression of IL-23 in the intestine causes formation of erosive lesions, bleeding, and neonatal death
(a) Scheme for generation of V23 mice. Independent sets of murine villin promoter (9kb)-driven transgenes encoding IL-23p19 or p40 were used to generate V19 and V40 mice, respectively. (b) Genotypic ratios of WT, V19, V40 and V23 mice at different ages P0 (n = 97) and P8 (n = 69). (c and d) Representative H&E stained sections of the small intestine of WT and V23 mice at P0. Scale bars, 250 μm in (c) and 50 μm in (d). Arrow indicates an erosive lesion. (e) Representative H&E stained section of the small intestine of V23 Il-23rGFP/GFP mice at P0. Scale bars, 50 μm. (f) The survival curves of V23 (n=16), V23 Il-23r+/GFP (n=15), and V23 Il-23rGFP/GFP (n=18) mice. P < 0.001 between V23 Il-23rGFP/GFP and V23 mice by Log-rank test. Results are representative of three independent experiments.
Figure 3
Figure 3. Gut-specific expression of IL-23 activated and expanded Thy1+Sca-1hi ILC3s in the neonatal intestine
(a) Relative number of LinThy1+Sca-1hi cells in small intestine (SI), large intestine (LI), mesenteric lymph nodes (MLN) and spleen (SP) of WT and V23 mice at P0. Representative flow cytometry plots gated on CD45+Lin. (b) Absolute number of LinThy1+Sca-1hi cells in the small intestine of WT and V23 mice at P0. Means ± s.e.m., n = 5–6 per group, ***P < 0.001. (c) Relative (left) and absolute (right) number of CD45+ cells in the small intestine of WT and V23 mice at P0. Dot plots show cells gated on live cells. Means ± s.e.m., n = 5–6 per group, ** P < 0.01. (d and e) Relative (d) and absolute (e) number of CD11b+, CD11c+, CD3+, B220+ and Lin cells in the small intestine of WT and V23 mice at P0. Means ± s.e.m., n = 5–6 per group. NS, not significant, * P < 0.05, ** P < 0.01, ***P < 0.001. (f) Relative (left) and absolute (right) number of CD45+CD11b+MHCIIGr-1+ cells in the small intestine of WT and V23 mice at P0. Dot plots show cells gated on CD45+CD11b+. Means ± s.e.m., n = 5–6 per group, ** P < 0.01. (g) Absolute number of LTi cells (LinCD4+) in the small intestine of WT and V23 mice at P0. Means ± s.e.m., n = 7–8 per group, ***P < 0.001. Data are representative of three independent experiments.
Figure 4
Figure 4. Thy1+Sca-1hi cells in the intestine of the V23 mice are NCRILC3s
(a) Phenotype of lineage-negative (Lin, CD3B220CD11bGr-1Ter119) Thy1+Sca-1hi cells. Histograms are electronically gated on Lin cells. Red lines indicate LinThy1+Sca-1hi ILC3, blue lines denote LTi cells (LinCD4+), and dotted black lines indicate isotype controls. (b) Expression of indicated cytokines analyzed by flow cytometry on the CD45+Lin+ and CD45+Lin populations after stimulation with phorbol 12-myristate 13-acetate (PMA) and ionomycin. Dot plots show cells gated on CD45+. Outlines areas in red indicate Lin and outlines areas in blue indicate Lin+. (c) Intracellular cytokine expression by LinThy1+Sca-1hi cells (red) in comparison with remaining cells (blue) from the small intestine of V23 mice at P0 following stimulation with PMA and ionomycin. Data are representative of at least three independent experiments.
Figure 5
Figure 5. Thy1+Sca-1hi ILC3s are located within erosive lesions in the intestine
(a) Immunofluorescence staining of the small intestine at P0 showing the presence of Thy1+ cells in ICAM+ cells aggregates in V23 mice (Thy1, green; ICAM-1, red; cell nuclei, DAPI). Scale bars, 50μm. (b) Histology of snap-frozen small intestine from WT and V23 mice. Slides show tissue before (left), after (middle) laser microdissection, as well as excised tissue in caps (right). (c) Cytokine expression measured by quantitative RT-PCR in microdissected Peyer's patches anlagen (PP)/erosive lesions areas (Lesion) and adjacent control areas (Adj) isolated from P0 WT and V23 mice. Means ± s.e.m., n = 4 per group. * P < 0.05, ** P < 0.01, ***P < 0.001. (d) Immunofluorescence staining of the small intestine of V23 mice at P0 showing the presence of IL-22+ cells within ICAM+ aggregates (IL-22, green; ICAM-1, red; cell nuclei, DAPI). Scale bars, 50μm. (e) Chemokine expression in microdissected Peyer's patches anlagen (PP)/erosive lesions areas (Lesion) and adjacent control areas (Adj) isolated from P0 WT and V23 mice. Means ± s.e.m., n = 4 per group. NS, not significant, * P < 0.05, ** P < 0.01, ***P < 0.001. (f) Immunofluorescence staining the small intestine at P0 showing the presence of neutrophils (S100A9+) in ICAM+ cells aggregates (S100A9, green; ICAM-1, red; cell nuclei, DAPI). Scale bars, 50μm. (g) Expression of neutrophil chemoattracting chemokines in microdissected Peyer's patches anlagen (PP)/erosive lesions areas (Lesion) and adjacent control areas (Adj) isolated from P0 WT and V23 mice. Means ± s.e.m., n = 4 per group, * *P < 0.01.
Figure 6
Figure 6. Thy1+Sca-1hi ILC3s are the main drivers of the intestinal pathogenesis
(a) Protocol used for in vivo depletion of Thy1+ cells in newborn V23 mice. The pregnant mothers were administered intravenously with 1 mg rat anti-Thy1 mAb or 1 mg isotype control mAb at gestational days 15.5, 16.5, 17.5 and 18.5. After birth pups were injected i.p. daily with 100 μg anti-Thy1 mAb or 100 μg isotype control per mouse for 4 days. (b) Flow cytometric analysis of the LinThy1+Sca-1hi population in the small intestine after antibody injection. Dot plots show cells gated on CD45+Lin. (c) Survival curves of V23 pups treated with anti-Thy1 (n = 12) or isotype (n = 12). ** P < 0.01 between groups by Log-rank test. (d) Flow cytometry plot showing the proportion of LinThy1+Sca-1hi cells in the small intestine of V23, V23Rorc(γt)+/−, and V23Rorc(γt)−/− mice at P0. Dot plots show cells gated on CD45+Lin. (e) Survival curves of V23 (n = 15), V23Rorc(γt)+/− (n = 18), and V23Rorc(γt)−/− (n = 22) mice. *** P < 0.001 between V23Rorc(γt)+/− /V23Rorc( γt)−/− mice and V23 mice by Log-rank test. Data are representative of three independent experiments.
Figure 7
Figure 7. Intestinal Thy1+Sca-1hi ILCs dysregulate epithelial permeability at prenatal stage
(a) Flow cytometric analysis of the LinThy1+Sca-1hi cells in the small intestine of mice at embryonic day E18.5. Dot plots show cells gated on CD45+Lin. (b) Representative cytokine expression profile of LinThy1+Sca-1hi ILC3s present in the small intestine of embryonic V23 mice (E18.5). (c) Representative H&E stained sections of the small intestine of WT and V23 embryo mice (E18.5). Scale bars, 100 μm. (d) The fluorescence staining of proteins labeled with sulfo-NHS-biotin in the small intestine after injection of the probe into the lumen of the intestine of embryos at E18.5. Stars indicate cellular aggregates in the gut. Scale bars, 100μm. Zoomed-in boxed area shows fluorescence staining of cellular aggregates in V23 mice. Data are representative of three independent experiments. (e) Quantification of relative fluorescent intensity in the PP anlagen of WT mice (2-5 sections for each mouse) and in erosive lesions of V23 mice (4-10 sections for each mouse). Data are shown as means ± s.e.m. of n = 5 mice per group. **P < 0.01, nonparametric Mann-Whitney test.
Figure 8
Figure 8. Commensal bacteria aggravate intestinal pathology induced by Thy1+Sca-1hi ILCs
(a) Survival curves of V23 mice derived from mothers treated with (n=22) or without (n=15) an antibiotic cocktail in drinking water during pregnancy. ***, P < 0.001 (Log-rank test). (b) Number of erosive lesions in the intestine of V23 mice born from mothers receiving water or antibiotic. Data are shown as means ± s.e.m., n = 10-15 for each group, ***, P < 0.001. (c) Relative number of neutrophils (CD11b+Gr-1+) in the small intestine of V23 mice born from mothers receiving water or antibiotic. Data are shown as means ± s.e.m., n = 4–8 per group, * P < 0.05. (d and e) Relative (d) and absolute (e) number of the LinThy1+Sca-1hi cells in the small intestine of V23 mice born from mothers receiving water or antibiotic. Data are shown as means ± s.e.m., n=4 for each group. Dot plots show cells gated on CD45+Lin. NS, not significant.

References

    1. Oppmann B, Lesley R, Blom B, Timans JC, Xu Y, Hunte B, et al. Novel p19 protein engages IL-12p40 to form a cytokine, IL-23, with biological activities similar as well as distinct from IL-12. Immunity. 2000;13(5):715–725. - PubMed
    1. Ahern PP, Izcue A, Maloy KJ, Powrie F. The interleukin-23 axis in intestinal inflammation. Immunol Rev. 2008;226:147–159. - PubMed
    1. Ahern PP, Schiering C, Buonocore S, McGeachy MJ, Cua DJ, Maloy KJ, et al. Interleukin-23 Drives Intestinal Inflammation through Direct Activity on T Cells. Immunity. 2010;33(2):279–288. - PMC - PubMed
    1. Buonocore S, Ahern PP, Uhlig HH, Ivanov II, Littman DR, Maloy KJ, et al. Innate lymphoid cells drive interleukin-23-dependent innate intestinal pathology. Nature. 2010;464(7293):1371–1375. - PMC - PubMed
    1. Geremia A, Arancibia-Carcamo CV, Fleming MP, Rust N, Singh B, Mortensen NJ, et al. IL-23-responsive innate lymphoid cells are increased in inflammatory bowel disease. J Exp Med. 2011;208(6):1127–1133. - PMC - PubMed

Publication types

MeSH terms