. 2014 Aug 26;5(5):e01476-14.
doi: 10.1128/mBio.01476-14.

Viral pathogen-associated molecular patterns regulate blood-brain barrier integrity via competing innate cytokine signals

Affiliations

Viral pathogen-associated molecular patterns regulate blood-brain barrier integrity via competing innate cytokine signals

Brian P Daniels et al. mBio. .

Abstract

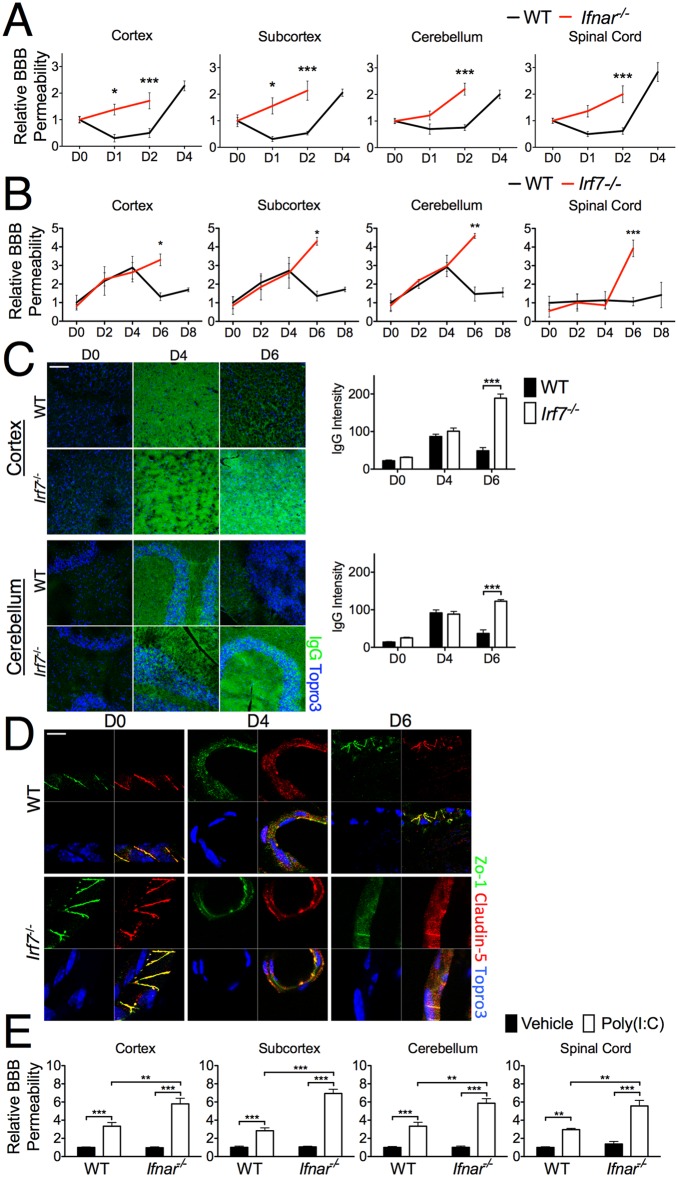
Pattern recognition receptor (PRR) detection of pathogen-associated molecular patterns (PAMPs), such as viral RNA, drives innate immune responses against West Nile virus (WNV), an emerging neurotropic pathogen. Here we demonstrate that WNV PAMPs orchestrate endothelial responses to WNV via competing innate immune cytokine signals at the blood-brain barrier (BBB), a multicellular interface with highly specialized brain endothelial cells that normally prevents pathogen entry. While Th1 cytokines increase the permeability of endothelial barriers, type I interferon (IFN) promoted and stabilized BBB function. Induction of innate cytokines by pattern recognition pathways directly regulated BBB permeability and tight junction formation via balanced activation of the small GTPases Rac1 and RhoA, which in turn regulated the transendothelial trafficking of WNV. In vivo, mice with attenuated type I IFN signaling or IFN induction (Ifnar(-/-) Irf7(-/-)) exhibited enhanced BBB permeability and tight junction dysregulation after WNV infection. Together, these data provide new insight into host-pathogen interactions at the BBB during neurotropic viral infection.

Importance: West Nile virus (WNV) is an emerging pathogen capable of infecting the central nervous system (CNS), causing fatal encephalitis. However, the mechanisms that control the ability of WNV to cross the blood-brain barrier (BBB) and access the CNS are unclear. In this study, we show that detection of WNV by host tissues induces innate immune cytokine expression at the BBB, regulating BBB structure and function and impacting transendothelial trafficking of WNV. This regulatory effect is shown to happen rapidly following exposure to virus, to occur independently of viral replication within BBB cells, and to require the signaling of cytoskeletal regulatory Rho GTPases. These results provide new understanding of host-pathogen interactions at the BBB during viral encephalitis.


Figures

FIG 1
FIG 1
WNV infection modulates endothelial barrier integrity via innate cytokine signaling. (A) Five-week-old C57BL/6 mice were inoculated in the footpad with 100 PFU of WNV and then assessed for BBB sodium fluorescein permeability in CNS regions on the postinfection days indicated. The values reported are arbitrary fluorescence values in CNS tissue normalized to values in serum for individual mice. Group means are normalized to the mean value for uninfected animals. The values on the x axes are times in days. n.s., not significant. (B) In vitro BBBs were treated overnight in the top chamber with the saline vehicle, TNF-α, IFN-γ, IL-1β, or IFN-β, followed by an additional 6 h of infection with WNV and subsequent measurement of TEER. (C) BBB cultures were treated for 2 h with the vehicle or the cytokine indicated, and then the culture medium was washed away and replaced with medium containing the vehicle or IFN-β for 2 h, followed by measurement of TEER. (D) In vitro BBBs were constructed with WT or Ifnar−/− BMECs cocultured with astrocytes of either genotype, as shown on the x axis, with the BMEC genotype on the left and the astrocyte genotype on the right. TEER measurements after 6 h of WNV infection are shown. (E) ELISA of cytokine expression in the top chambers of BBB cultures following 6 h of WNV infection. (F) Quantification of ICC analysis of colocalization of Zo-1 and Claudin-5 in WT and Ifnar−/− BMEC monolayers treated for 2 h with the saline vehicle or the cytokine indicated and subsequently infected for 6 h with WNV at an MOI of 0.01. Values on the y axis (correlation indexes) represent the probability of an individual pixel staining positive for both markers if it stains positive for either. (G) Representative ×63 images of cultures with Zo-1 shown in green, Claudin-5 in red, and Topro3 nuclear staining in blue. Scale bar = 25 µm. White arrowheads highlight junctions with loss of TJ protein colocalization. Veh, vehicle.
FIG 2
FIG 2
PRR activation is sufficient to induce cytokine-dependent changes in endothelial barrier integrity. (A, left side) TEER measurements for in vitro BBBs constructed with either WT or Ifnar−/− BMECs over WT astrocytes, treated for 6 h at an MOI of 0.01 with WNV inactivated with UV (WNV-UV), β-propiolactone (WNV-BPL), the TLR3 agonist “naked” poly(I · C), the TLR7 agonist CL264, the MDA5-biased agonist HMW poly(I · C)-LyoVec, or the RIG-I agonist 5′ ppp-dsRNA. (A, right side) Quantification of ICC analysis of colocalization of Zo-1 and Claudin-5 in WT versus Ifnar−/− BMECs treated as indicated on the left. Values on the x axis (correlation indexes) represent the probability of an individual pixel staining positive for both markers if it stains positive for either. (B) Representative ×63 images showing colocalization of Zo-1 and Claudin-5 in WT versus Ifnar−/− BMEC monolayers treated for 6 h with inactivated WNV or a PRR agonist (as in panel A), with Zo-1 shown in green, Claudin-5 in red, and Topro3 nuclear staining in blue. White arrowheads highlight junctions with loss of TJ protein colocalization. (C) ELISA of cytokine production in the top chambers of BBB cultures as in panel A following 6 h of treatment with either “naked” poly(I · C) or CL264. (D) BBB cultures as in panel A were pretreated with neutralizing antibodies to TNF-α and/or IL-1β or isotype controls. Cultures were then infected for 6 h with WNV at an MOI of 0.01 (left panel) or treated for 6 h with “naked” poly(I · C) or CL264 (middle and right panels). Data are expressed as fold changes in infected/treated cultures versus similarly treated mock-infected/vehicle-treated cultures under the same conditions.
FIG 3
FIG 3
WNV modulates endothelial Rho GTPase-mediated regulation of the BBB endothelium. (A to G) Activated GTPase pulldown assay of WT or Ifnar−/− BMECs either infected with WNV at an MOI of 0.01 for 6 h (A to D) or treated for 2 h with recombinant TNF-α, IL-1β, or IFN-β (E to G). After treatment, BMEC lysates were incubated with Rhotekin or PAK agarose beads to purify GTP-bound, activated Rac1, RhoA, and CDC42. Both purified activated GTPases and total unpurified cell lysates were then probed via Western blot assay to assess activated versus total amounts of each GTPase. UI, uninfected. (B to D, F, G) Density quantification of activated Rac1 (B, F), RhoA (C, G), or CDC42 (D), normalized to the total amount of each protein in each sample. Group averages are normalized to the mean values of uninfected/vehicle-treated WT BMECs. (H) TEER measurements for in vitro BBBs constructed with WT or Ifnar−/− BMECs over WT astrocytes, pretreated for 2 h with Rac1 inhibitor Z62954982, ROCK/RhoA inhibitor H1152P, or CDC42 inhibitor ML141 and then infected for 6 h with WNV at an MOI of 0.01. Data are reported as fold changes in TEER in infected cultures versus uninfected cultures within each treatment group. (I) Representative ×63 images showing colocalization of Zo-1 and Claudin-5 in WT versus Ifnar−/− BMEC monolayers treated for 2 h with GTPase inhibitors (as in panel H), followed by 6 h of infection with WNV at an MOI of 0.01, with Zo-1 shown in green, Claudin-5 in red, and Topro3 nuclear staining in blue. White arrowheads highlight junctions with loss of TJ protein colocalization. (J) Quantification of colocalization in images in panel I. Data are reported as the fold changes in colocalization in infected cells versus uninfected cells within each treatment group.
FIG 4
FIG 4
Innate cytokines differentially regulate WNV transmigration across the in vitro BBB. (A to H) Detection of replicating virus in the bottom chambers of in vitro BBBs constructed with the WT BMECs only (A to C) or WT or Ifnar−/− BMECs (D to H) over WT astrocytes, infected with WNV at an MOI of 0.01 in the top chambers for 6 h before removal of the top chambers. The cultures in panels A to C were treated overnight with the saline vehicle or TNF-α (A), IL-1β (B), or IFN-β (C) prior to infection. The cultures in panels E and F were pretreated for 2 h with neutralizing antibodies to TNF-α (E) or IL-1β (F) before infection. The cultures in panels G and H were pretreated for 2 h with Rac1 inhibitor Z62954982 (G) or ROCK inhibitor H1152P (H) before infection. Values are viral titers present after 0, 12, 24, and 48 h of replication by virus that crossed during the 6 h of infection, prior to the removal of BMECs from the culture system. Viral titers are reported in plaque-forming units per milliliter, as determined via standard plaque assay in BHK cells. Each horizontal dotted line represents the limit of detection of the assay.
FIG 5
FIG 5
WT mice but not mice with impaired type I IFN signaling exhibit increased BBB integrity following neuroinvasion. (A) Eight-week-old WT and Ifnar−/− mice were i.c. inoculated with 10 PFU WNV. On the days indicated after infection, mice were administered sodium fluorescein and then sodium fluorescein levels in tissue homogenates taken from CNS regions contralateral to the inoculation site were assessed. The values reported are arbitrary tissue fluorescence values normalized to the serum values of individual mice. Group means are normalized to the mean value of mock-infected WT animals. (B) Sodium fluorescein permeability in CNS regions after footpad inoculation with 100 PFU WNV. Values taken from CNS regions (both hemispheres) are reported as in panel A, with normalization to values of uninfected WT mice. (C) IHC detection of serum IgG in parenchymal CNS tissues after peripheral WNV infection, with quantification of group mean fluorescence intensity per low-power field. Scale bar = 100 µm. (D) IHC detection of Zo-1 (green) and Claudin-5 (red) in CNS microvessels on the days after footpad infection indicated. Scale bar = 10 µm. (E) Eight-week-old WT and Ifnar−/− mice were administered 50 µg poly(I · C) i.p., followed by sodium fluorescein 24 h later (processed as described for panel B).

References

    1. Persidsky Y, Ramirez SH, Haorah J, Kanmogne GD. 2006. Blood-brain barrier: structural components and function under physiologic and pathologic conditions. J. Neuroimmune Pharmacol. 1:223–236. 10.1007/s11481-006-9025-3 - DOI - PubMed
    1. Verma S, Lo Y, Chapagain M, Lum S, Kumar M, Gurjav U, Luo H, Nakatsuka A, Nerurkar VR. 2009. West Nile virus infection modulates human brain microvascular endothelial cells tight junction proteins and cell adhesion molecules: transmigration across the in vitro blood-brain barrier. Virology 385:425–433. 10.1016/j.virol.2008.11.047 - DOI - PMC - PubMed
    1. Daffis S, Samuel MA, Suthar MS, Gale M, Jr, Diamond MS. 2008. Toll-like receptor 3 has a protective role against West Nile virus infection. J. Virol. 82:10349–10358. 10.1128/JVI.00935-08 - DOI - PMC - PubMed
    1. Wang S, Welte T, McGargill M, Town T, Thompson J, Anderson JF, Flavell RA, Fikrig E, Hedrick SM, Wang T. 2008. Drak2 contributes to West Nile virus entry into the brain and lethal encephalitis. J. Immunol. 181:2084–2091. 10.4049/jimmunol.181.3.2084 - DOI - PMC - PubMed
    1. Pan W, Stone KP, Hsuchou H, Manda VK, Zhang Y, Kastin AJ. 2011. Cytokine signaling modulates blood-brain barrier function. Curr. Pharm. Des. 17:3729–3740. 10.2174/138161211798220918 - DOI - PMC - PubMed

Publication types

MeSH terms