

RidgeRace: ridge regression for continuous ancestral character estimation on phylogenetic trees
- PMID: 25161243
- PMCID: PMC4147928
- DOI: 10.1093/bioinformatics/btu477
RidgeRace: ridge regression for continuous ancestral character estimation on phylogenetic trees
Abstract
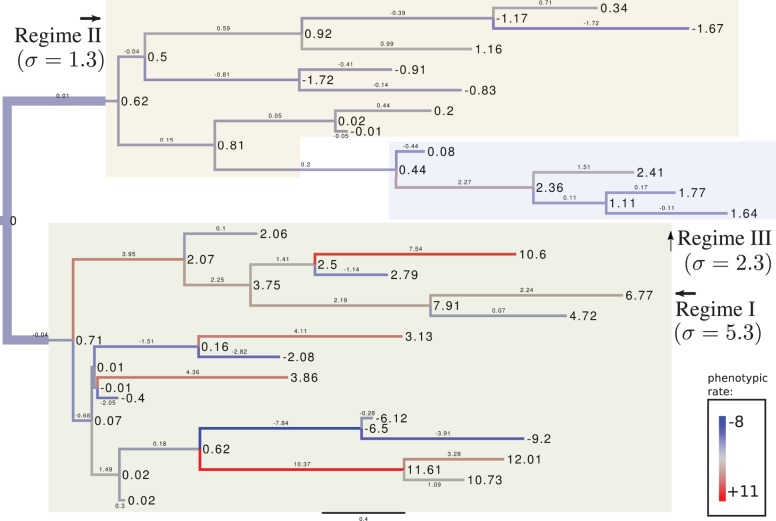
Motivation: Ancestral character state reconstruction describes a set of techniques for estimating phenotypic or genetic features of species or related individuals that are the predecessors of those present today. Such reconstructions can reach into the distant past and can provide insights into the history of a population or a set of species when fossil data are not available, or they can be used to test evolutionary hypotheses, e.g. on the co-evolution of traits. Typical methods for ancestral character state reconstruction of continuous characters consider the phylogeny of the underlying data and estimate the ancestral process along the branches of the tree. They usually assume a Brownian motion model of character evolution or extensions thereof, requiring specific assumptions on the rate of phenotypic evolution.
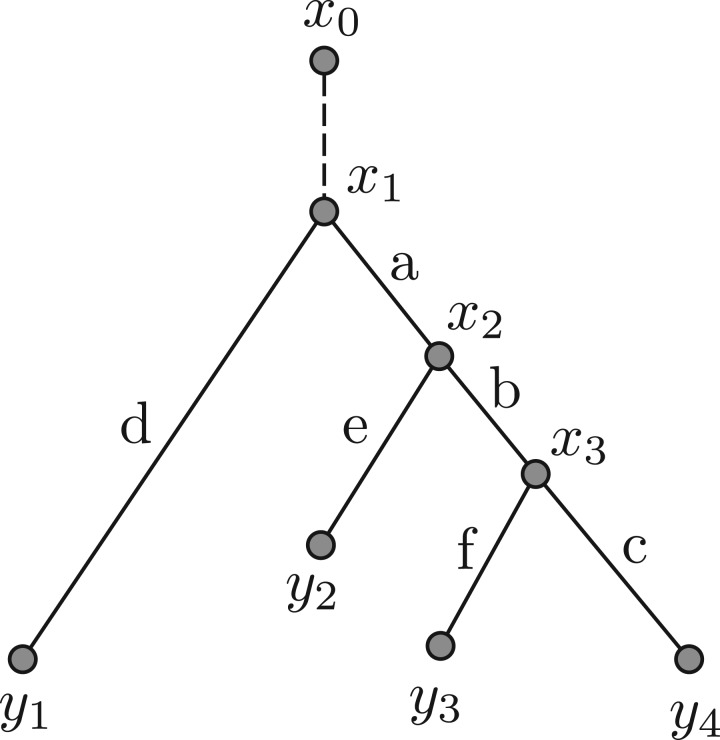
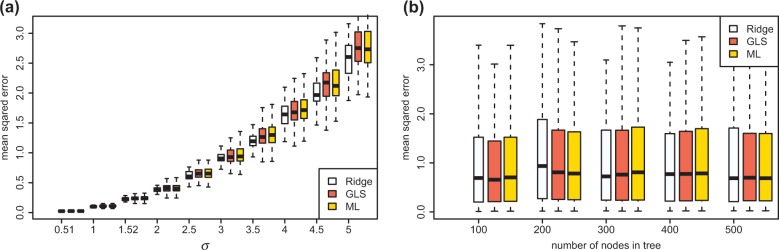
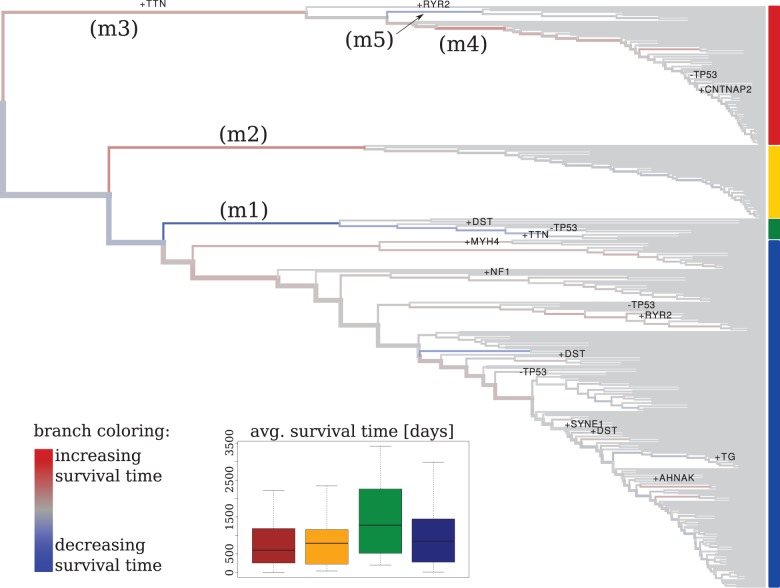
Results: We suggest using ridge regression to infer rates for each branch of the tree and the ancestral values at each inner node. We performed extensive simulations to evaluate the performance of this method and have shown that the accuracy of its reconstructed ancestral values is competitive to reconstructions using other state-of-the-art software. Using a hierarchical clustering of gene mutation profiles from an ovarian cancer dataset, we demonstrate the use of the method as a feature selection tool.
Availability and implementation: The algorithm described here is implemented in C++ as a stand-alone program, and the source code is freely available at http://algbio.cs.uni-duesseldorf.de/software/RidgeRace.tar.gz.
Supplementary information: Supplementary data are available at Bioinformatics online.
© The Author 2014. Published by Oxford University Press.
Figures
References
-
- Blomberg SP, et al. Testing for phylogenetic signal in comparative data: behavioral traits are more labile. Evolution. 2003;57:717–745. - PubMed
-
- BOOST (2014). ublas library. http://www.boost.org.
-
- Butler MA, King AA. Phylogenetic comparative analysis: a modeling approach for adaptive evolution. Am. Nat. 2004;164:683–695. - PubMed
Publication types
MeSH terms
LinkOut - more resources
Full Text Sources
Other Literature Sources
Miscellaneous
