. 2014 Aug 26;7(340):ra83.
doi: 10.1126/scisignal.2005221.

T cell receptor stimulation impairs IL-7 receptor signaling by inducing expression of the microRNA miR-17 to target Janus kinase 1

Affiliations

T cell receptor stimulation impairs IL-7 receptor signaling by inducing expression of the microRNA miR-17 to target Janus kinase 1

Gil Katz et al. Sci Signal. .

Abstract

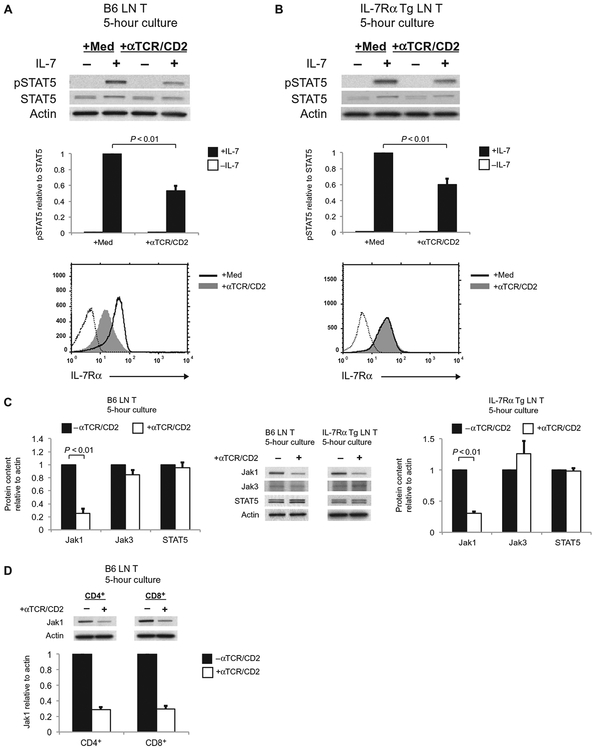
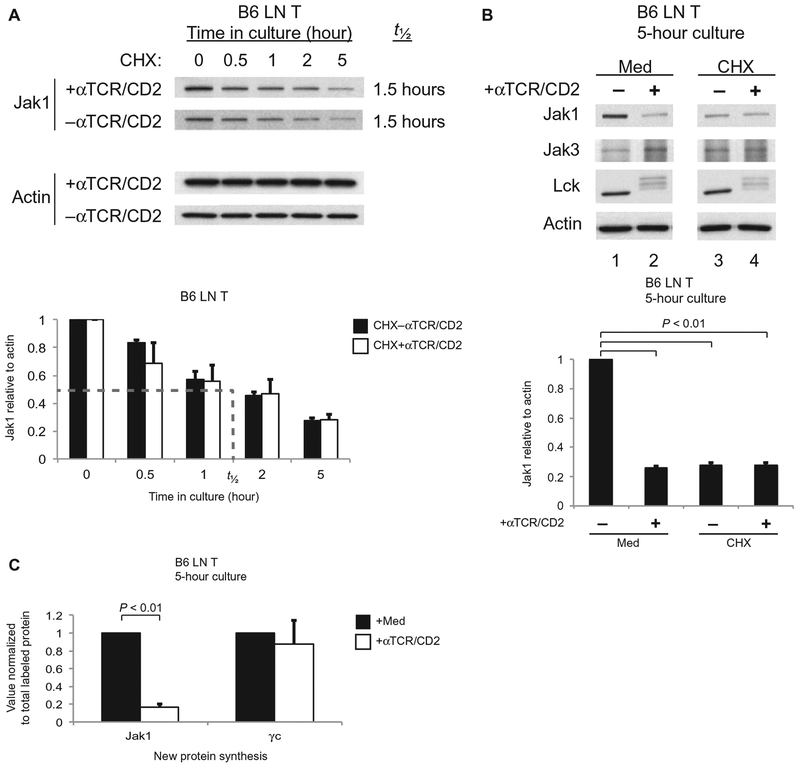
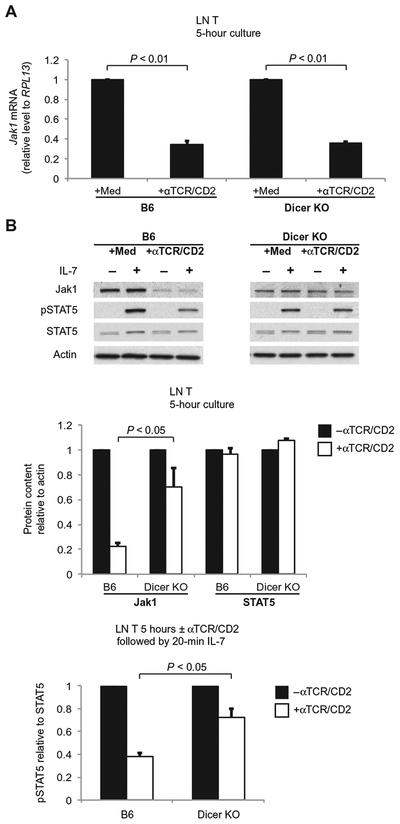
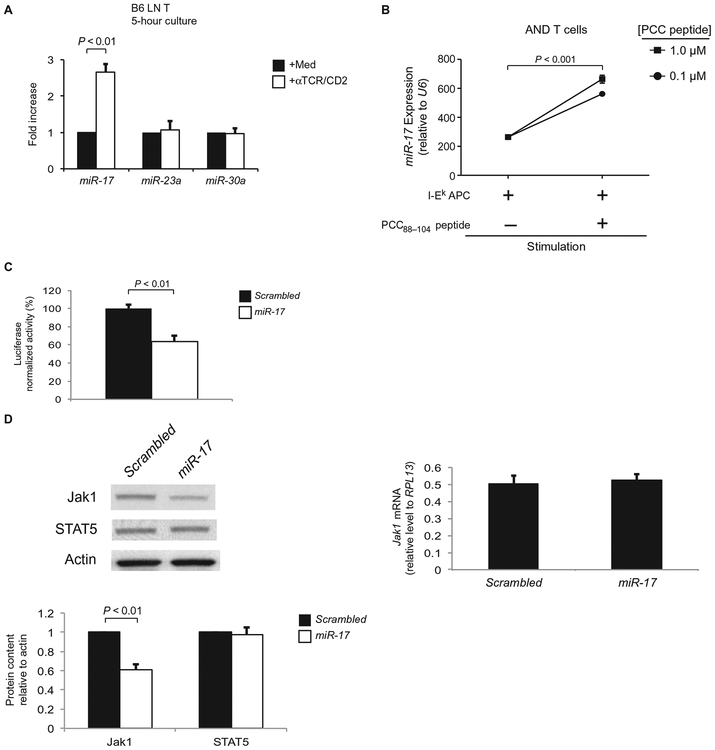
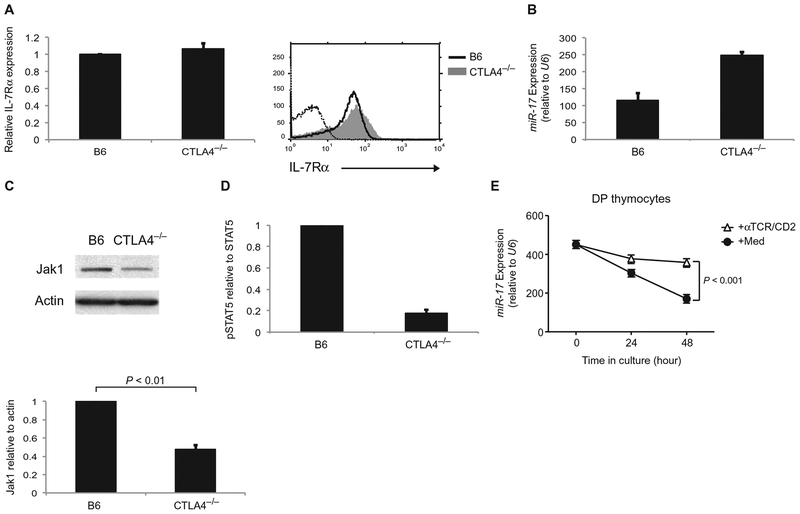
T cell receptor (TCR)-mediated inhibition of interleukin-7 (IL-7) signaling is important for lineage fate determination in the thymus and for T cell survival in the periphery because uninterrupted IL-7 signaling results in T cell death. The initial event in IL-7 signaling is the transactivation of Janus kinases 1 and 3 (Jak1 and Jak3), which are associated with the cytosolic tails of the IL-7 receptor α chain (IL-7Rα) and the γc subunit, the two cell surface proteins that constitute IL-7R. We found that Jak1 is a highly unstable protein with a half-life of only 1.5 hours, so that continuous Jak1 protein synthesis is required to maintain Jak1 protein in sufficient abundance to support IL-7 signaling. However, we also found that Jak1 protein synthesis was acutely reduced by TCR-responsive microRNAs in the miR-17 family, which targeted Jak1 mRNA (messenger RNA) to inhibit its translation. Thus, this study identifies a molecular mechanism by which TCR engagement acutely disrupts IL-7 signaling.


Conflict of interest statement

Competing interests: The authors declare that they have no competing interests.

Figures

Fig. 1.
Fig. 1.
TCR stimulation impairs IL-7 signaling and reduces Jak1 protein abundance. (A and B) LN T cells from B6 mice (A) and IL-7Rα Tg mice (B) were cultured with medium or with plate-bound anti-TCR and anti-CD2 antibodies (αTCR/CD2) for 5 hours, after which they were left untreated (–) or were treated with IL-7 for 20 min. Top: Cells were harvested, and cell lysates were resolved by SDS–polyacrylamide gel electrophoresis (SDS-PAGE) and then analyzed by Western blotting with antibodies against the indicated proteins. Middle: The relative amounts of pSTAT5 normalized to those of total STAT5 in the indicated samples were determined by densitometric analysis of the Western blots shown above. Bottom: After the 5-hour culture, the T cells were analyzed by flow cytometry to determine the cell surface expression of IL-7Rα. Dotted histograms show staining with an isotype control antibody. Western blots and flow cytometry plots are representative of three independent experiments. Data in bar graphs are means ± SEM of three independent experiments. (C) LN T cells from B6 mice (left) and IL-7Rα Tg mice (right) were cultured for 5 hours as described for (A), and cell lysates were then analyzed by Western blotting with antibodies specific for the indicated proteins. Jak1, STAT5, and actin were detected by Western blotting analysis of whole-cell lysates, whereas immunoprecipitated samples were analyzed to detect Jak3. Western blots are representative of three independent experiments. Bar graphs show the relative amounts of the indicated proteins, normalized to that of actin, in the unstimulated and TCR-stimulated cells. Data are means ± SEM of three independent experiments. (D) Purified populations of CD4+ and CD8+ T cells from the LNs of wild-type B6 mice were cultured for 5 hours in the absence or presence of αTCR/CD2 antibodies before being analyzed by Western blotting as described for (C). Western blots are representative of two independent experiments, and data in the bar graph are means ± SE of two independent experiments.
Fig. 2.
Fig. 2.
TCR signaling reduces the abundance of Jak1 by inhibiting the synthesis of new Jak1 protein. (A) LN T cells from B6 mice were pretreated with CHX before being incubated for the indicated times in the absence or presence of αTCR/CD2 antibodies. Top: Cell lysates were analyzed by Western blotting with antibodies specific for the indicated proteins. Bottom: Densitometric analysis of the relative abundance of Jak1 protein, normalized to that of actin, in the indicated samples over time. The dashed line indicates the half-life (t1/2) of Jak1 protein. Data are means ± SEM of three independent experiments. (B) LN T cells from B6 mice were left unstimulated or were stimulated with αTCR/CD2 for 5 hours in the absence or presence of CHX. Top: Samples were analyzed by Western blotting with antibodies against the indicated proteins. Bottom: The relative abundance of Jak1 protein in the indicated samples was determined by densitometric analysis as described for (A). Data are means ± SEM of three independent experiments. Values for Jak1 protein (mean + SE) in TCR-signaled or CHX-treated cells were significantly different from cells in medium only (P < 0.01). (C) LN T cells from B6 mice were left unstimulated or were stimulated with αTCR/CD2 for 5 hours and then were metabolically labeled with [35S]Met/Cys for 30 min. Samples were subjected to immunoprecipitation with anti-Jak1 or anti-γc antibodies. Samples were resolved by SDS-PAGE and quantified for 35S by autoradiography. Densities of bands corresponding to Jak1 and γc were corrected for total TCA-precipitable counts, and the values obtained for TCR-stimulated cells were normalized to those for unstimulated cells, which were set equal to 1.0. Data are means ± SEM of three independent experiments.
Fig. 3.
Fig. 3.
Transcriptional and posttranscriptional effects of TCR signaling on Jak1. (A) LN T cells from B6 mice and Dicer-deficient (Dicer KO) mice were left un-stimulated or were stimulated with αTCR/CD2 for 5 hours. The abundance of Jak1 mRNA in the cells was determined by quantitative reverse transcription PCR (RT-PCR) analysis. Data are means ± SEM of three independent experiments. (B) TCR signaling has substantially less of an effect on Jak1 protein content and IL-7 signal transduction in Dicer KO T cells. LN T cells from B6 mice and Dicer KO mice were cultured for 5 hours with medium or with plate-bound αTCR/CD2 before they were left untreated or were incubated with IL-7 for 20 min. Top: Cell lysates were then analyzed by Western blotting with antibodies against the indicated proteins. Blots are representative of three independent experiments. Middle: Densitometric analysis of the abundance of Jak1 and STAT5, normalized to that of actin, in the indicated cells. Bottom: Densitometric analysis of the relative abundance of pSTAT5 relative to that of total STAT5 in the indicated cells. Data in bar graphs are means ± SEM of three independent experiments and are normalized to values from cells cultured in the absence of αTCR/CD2, which were set equal to 1.0.
Fig. 4.
Fig. 4.
TCR stimulation increases the abundance of miR-17, which inhibits translation of Jak1 mRNA. (A) LN T cells from B6 mice were left unstimulated or were stimulated with αTCR/CD2 for 5 hours. The abundance of the three microRNA families with potential specificity for Jak1 was then determined by quantitative RT-PCR analysis. Data are means ± SEM of the fold increase in microRNA abundance in response to TCR stimulation from three independent experiments. (B) LN T cells purified from AND Rag2−/− mice were cultured overnight in the presence of I-Ek splenic B cells from B10.A mice (I-Ek APC) and the indicated concentrations of the PCC88–104 peptide. Samples were then analyzed by quantitative RT-PCR. The abundance of miR-17, normalized to that of small nucleolar RNA U6, was then calculated. Data are means ± SEM of quadruplicate cultures for each time point and are representative of two independent experiments. (C) HEK 293T cells were transiently transfected with a dual luciferase reporter in which mRNA for firefly luciferase contained the 3′UTR of Jak1, whereas mRNA for the Renilla luciferase served as an intrinsic control. HEK 293T cells were simultaneously cotransfected with plasmid encoding either miR-17 or scrambled control microRNA. Luciferase activity was measured 48 hours after transfection and is displayed as the activity of firefly luciferase normalized to the activity of Renilla luciferase. Data are means ± SEM of triplicate samples from a single experiment that is representative of three independent experiments. (D) Jurkat cells stably transfected with either miR-17 or scrambled control microRNA were subjected to Western blotting analysis with antibodies against the indicated proteins (left) and to quantitative PCR analysis for Jak1 mRNA abundance (right). Bottom: Densitometric analysis of the abundances of the indicated proteins. Bar graphs show means ± SEM of four independent experiments.
Fig. 5.
Fig. 5.
Examination of T cells from autoimmune Ctla4−/−mice. (A) LN T cells from Ctla4−/− mice and B6 mice were analyzed by flow cytometry to determine the cell surface abundance of IL-7Rα. Left: The relative mean fluorescence intensity of IL-7Rα on Ctla4−/− T cells was expressed relative to that on B6 T cells, which was set equal to 1. Data are means ± SEM of three independent experiments. Right: Representative flow cytometry plots. (B) The abundance of miR-17 in LN T cells from Ctla4−/− mice and B6 mice was determined by quantitative RT-PCR analysis. Data are means ± SEM of triplicate samples from a single experiment that is representative of two independent experiments. (C) Top: LN T cells from Ctla4−/− mice and B6 mice were analyzed by Western blotting with antibodies against the indicated proteins. Bottom: Bar graphs show the relative abundance of Jak1 protein normalized to that of actin. Data are means ± SEM of four independent experiments. (D) LN T cells from Ctla4−/− mice and B6 mice were treated for 20 min with IL-7 before being analyzed by Western blotting with antibodies against pSTAT5 and total STAT5 proteins. The ratio of the abundance of pSTAT5 to that of STAT5 in Ctla4−/− T cells was normalized to that in B6 T cells, which was set equal to1.0. Data are means ± SEM of two independent experiments. (E) Purified DP thymocytes from β2m−/− mice were cultured in the presence or absence of immobilized anti-TCR/CD2 antibodies for the indicated times. Samples were then analyzed by quantitative PCR analysis as described for Fig. 4B. Data are means ± SEM of quadruplicate samples from a single experiment, which is representative of three independent experiments.

References

    1. Akashi K, Kondo M, Weissman IL, Role of interleukin-7 in T-cell development from hematopoietic stem cells. Immunol. Rev 165, 13–28 (1998). - PubMed
    1. Goldrath AW, Bevan MJ, Selecting and maintaining a diverse T-cell repertoire. Nature 402, 255–262 (1999). - PubMed
    1. Jameson SC, Maintaining the norm: T-cell homeostasis. Nat. Rev. Immunol 2, 547–556 (2002). - PubMed
    1. Linette GP, Grusby MJ, Hedrick SM, Hansen TH, Glimcher LH, Korsmeyer SJ, Bcl-2 is upregulated at the CD4+ CD8+ stage during positive selection and promotes thymocyte differentiation at several control points. Immunity 1, 197–205 (1994). - PubMed
    1. Yu Q, Erman B, Bhandoola A, Sharrow SO, Singer A, In vitro evidence that cytokine receptor signals are required for differentiation of double positive thymocytes into functionally mature CD8+ T cells. J. Exp. Med 197, 475–487 (2003). - PMC - PubMed

Publication types

MeSH terms