. 2014 Aug 12:5:771.
doi: 10.3389/fpsyg.2014.00771. eCollection 2014.

Using nonlinear methods to quantify changes in infant limb movements and vocalizations

Affiliations

Using nonlinear methods to quantify changes in infant limb movements and vocalizations

Drew H Abney et al. Front Psychol. .

Abstract

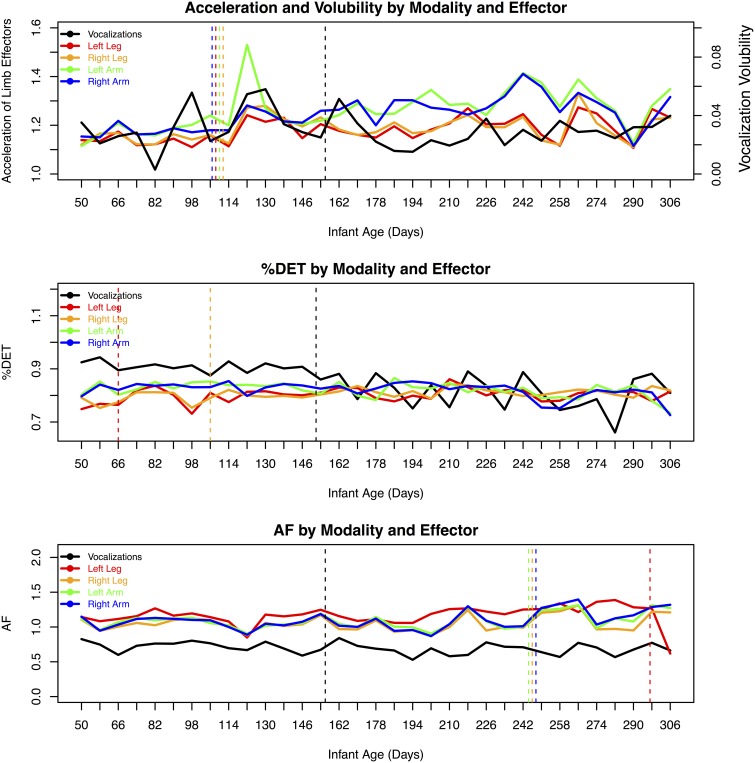
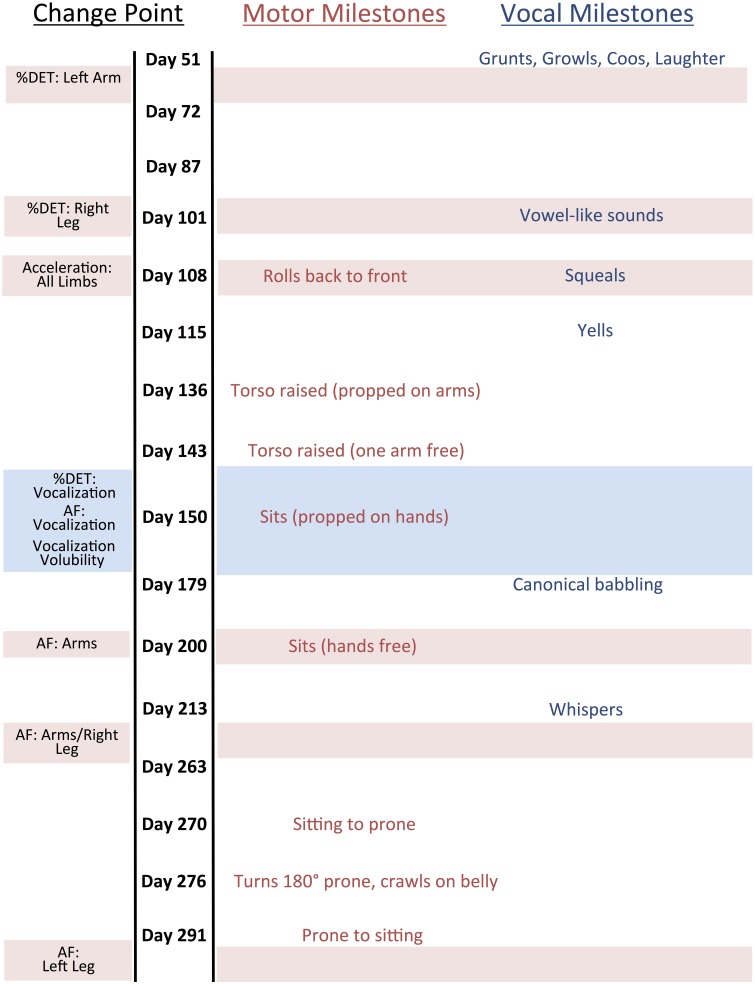
The pairing of dynamical systems theory and complexity science brings novel concepts and methods to the study of infant motor development. Accordingly, this longitudinal case study presents a new approach to characterizing the dynamics of infant limb and vocalization behaviors. A single infant's vocalizations and limb movements were recorded from 51-days to 305-days of age. On each recording day, accelerometers were placed on all four of the infant's limbs and an audio recorder was worn on the child's chest. Using nonlinear time series analysis methods, such as recurrence quantification analysis and Allan factor, we quantified changes in the stability and multiscale properties of the infant's behaviors across age as well as how these dynamics relate across modalities and effectors. We observed that particular changes in these dynamics preceded or coincided with the onset of various developmental milestones. For example, the largest changes in vocalization dynamics preceded the onset of canonical babbling. The results show that nonlinear analyses can help to understand the functional co-development of different aspects of infant behavior.

Keywords: Allan factor; infant vocalization; motor development; nonlinear methods; recurrence.


Figures

Figure 1
Figure 1
Illustration of time series embedding, phase-space reconstruction, and recurrence plot analysis. (A) A sine wave over several periods (top panel) and a delayed copy of that time series. The original time series and its time-delayed copy are plotted against each other to yield a 2-dimensional phase-space. (B) Phase-space portrait of a sine-wave. The circular shape of the profile shows that the sine-wave is highly stable and repetitive, repeating itself perfectly along a single circular path. Please note that the labeling of the dimensions as 1 and 2 is arbitrary. (C) Recurrence plot (RP) of the phase-space portrait. In a RP, time at lag0 runs along the central diagonal. The presence of the diagonal line states the simple fact that a time series is always the same with itself at lag0. The striped pattern that repeats itself off the diagonal toward the upper left and the lower right indicates that the time series is perfectly repeating itself, and the distance between the stripes (i.e., the white spaces between them) indicates the lag at which the time series repeats itself, and is equal to the period of the sine-wave. Since all recurrent points fall onto diagonally adjacent lines, the %DET values = 99.9% (as the sine-wave is perfectly deterministic, the values should be 100%, but spurious individual recurrence points can appear on the edges of the RP, leading to the negligible deviation from the expected value).
Figure 2
Figure 2
Overview of the dependent measures as a function of age, modality, and effector. Change point convergence between both methods are indicated by dashed vertical lines.
Figure 3
Figure 3
Change Point Results with Language and Motor Milestones. Horizontal bars correspond with particular change points. Age does not increase linearly but rather as a function of recording session.

References

    1. Adolph K. E., Berger S. E. (2011). Physical and motor development, in Developmental Science: An Advanced Textbook, 6th Edn, eds Bornstein M. H., Lamb M. E. (Hillsdale, NJ: Lawrence Erlbaum Associates; ), 241–302
    1. Adolph K. E., Cole W. G., Komati M., Garciaguirre J. S., Badaly D., Lingeman J. M., et al. (2012). How do you learn to walk? Thousands of steps and dozens of falls per day. Psychol. Sci. 23, 1387–1394 10.1177/0956797612446346 - DOI - PMC - PubMed
    1. Adolph K. E., Robinson S. R., Young J. W., Gill-Alvarez F. (2008). What is the shape of developmental change? Psychol. Rev. 115, 527–543 10.1037/0033-295X.115.3.527 - DOI - PMC - PubMed
    1. Allan D. W. (1966). Statistics of atomic frequency standards. Proc. IEEE 54, 221–230 10.1109/PROC.1966.4634 - DOI
    1. Assmann B., Romano M. C., Thiel M., Niemitz C. (2007). Hierarchical organization of a reference system in newborn spontaneous movements. Infant. Behav. Dev. 30, 568–586 10.1016/j.infbeh.2007.04.004 - DOI - PubMed

LinkOut - more resources