. 2014 Jul 5:4:689-703.
doi: 10.1016/j.fob.2014.06.010. eCollection 2014.

The zinc-binding region (ZBR) fragment of Emi2 can inhibit APC/C by targeting its association with the coactivator Cdc20 and UBE2C-mediated ubiquitylation

Affiliations

The zinc-binding region (ZBR) fragment of Emi2 can inhibit APC/C by targeting its association with the coactivator Cdc20 and UBE2C-mediated ubiquitylation

Shisako Shoji et al. FEBS Open Bio. .

Abstract

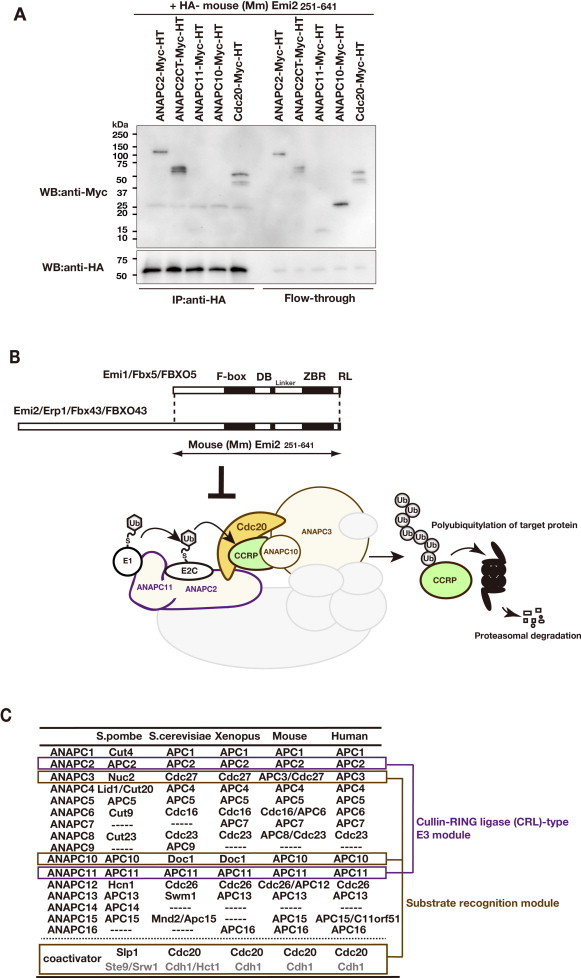
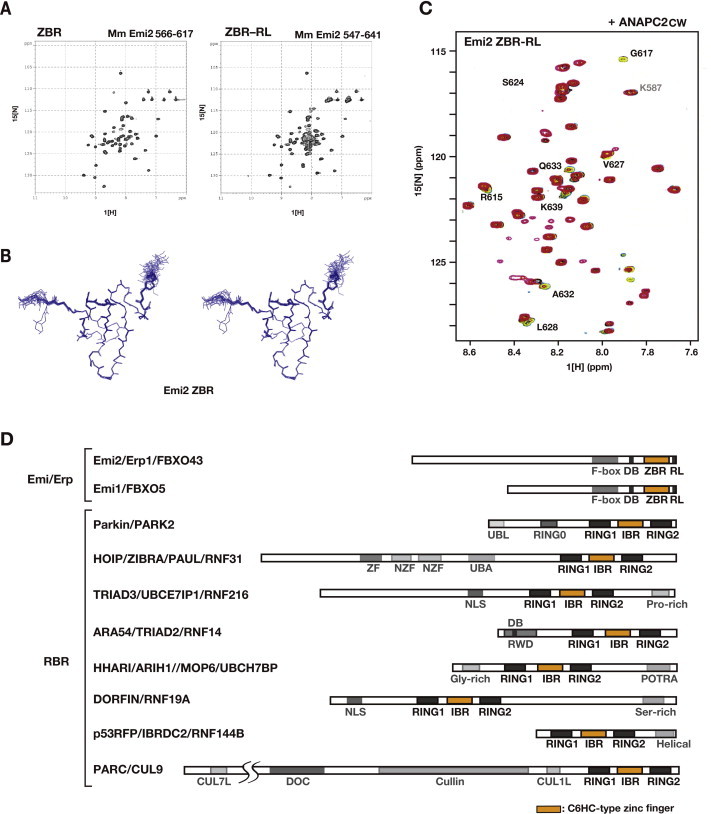
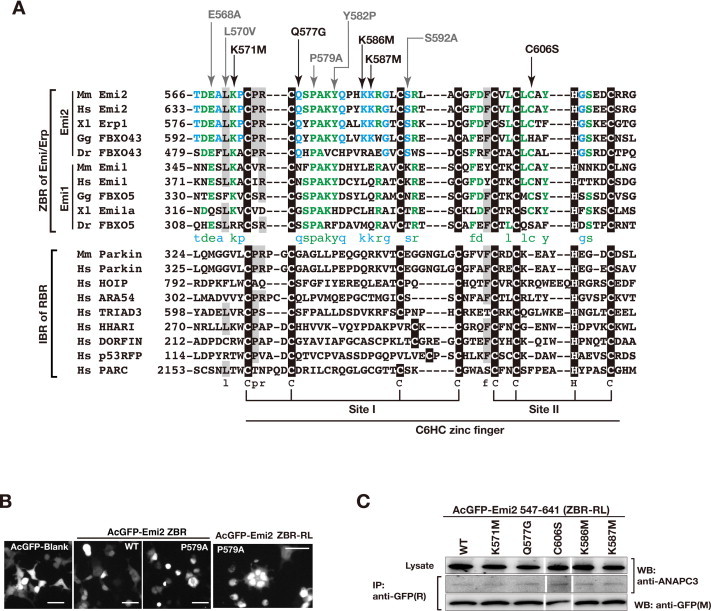
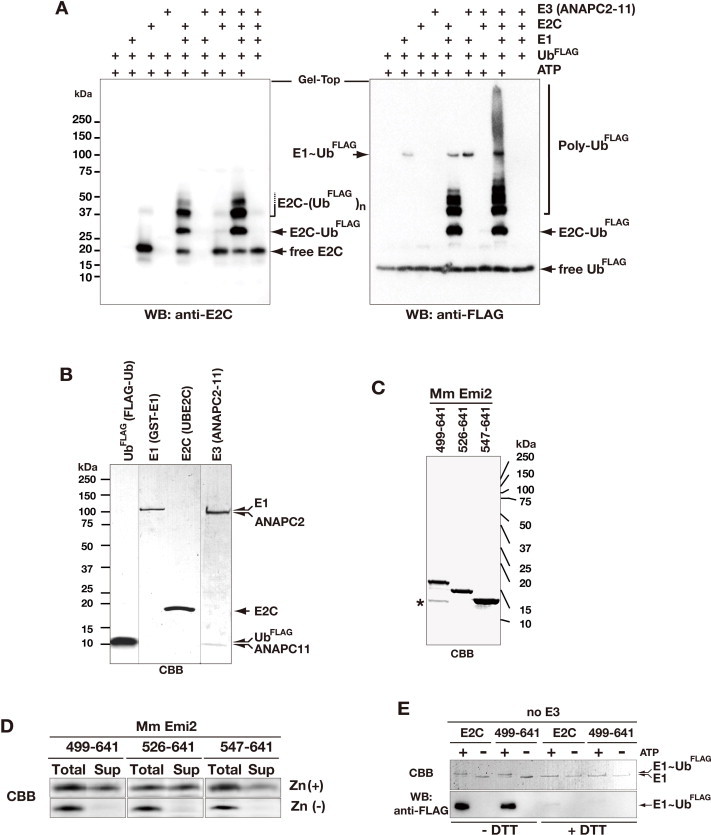
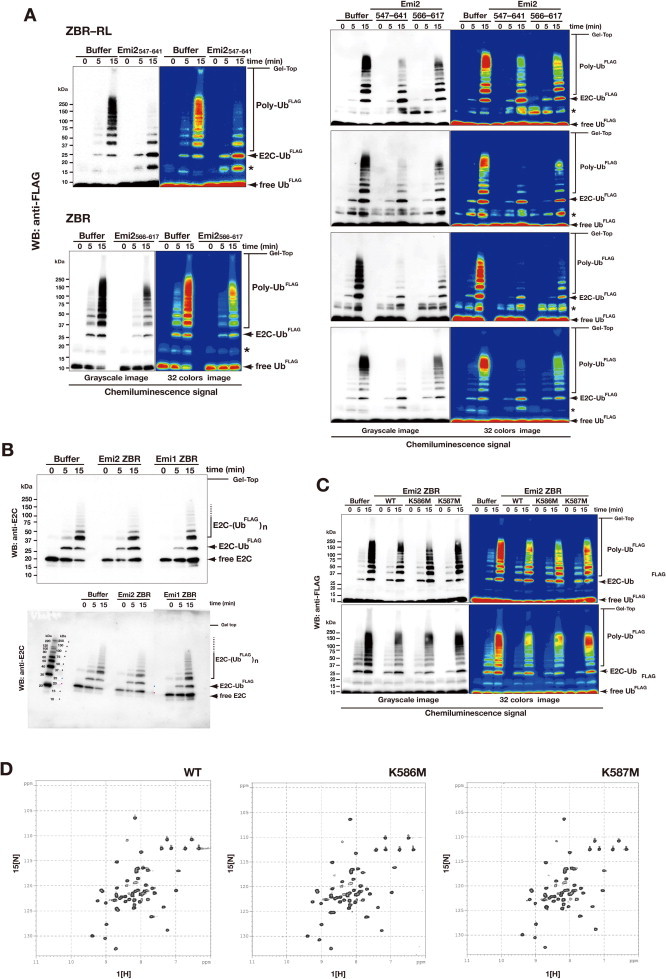
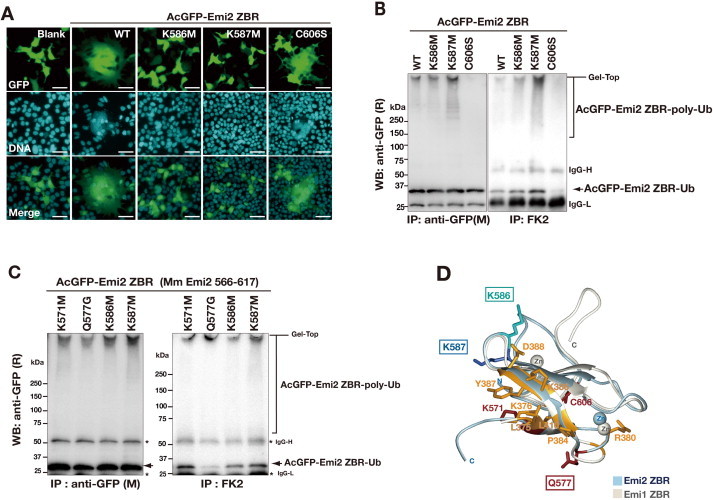
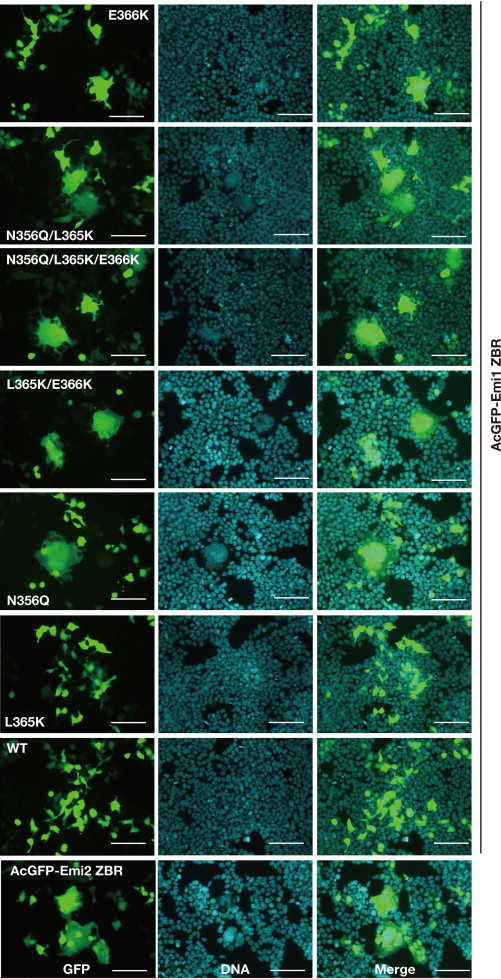
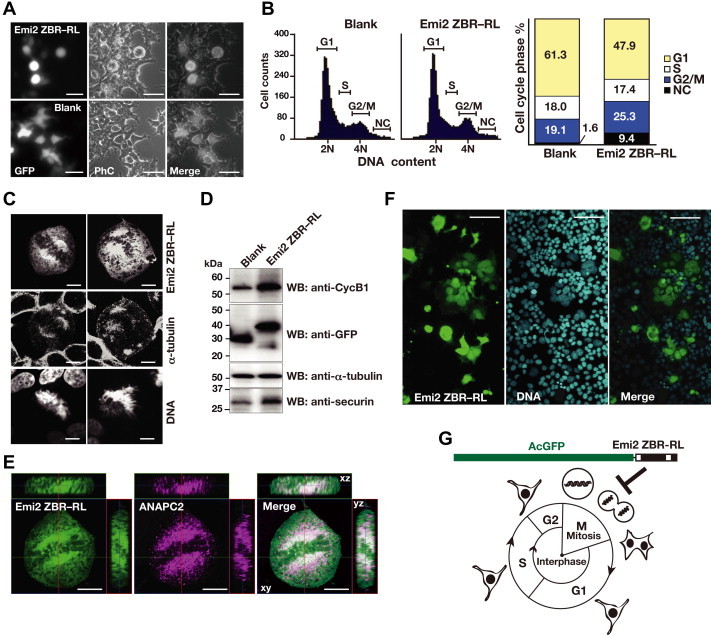
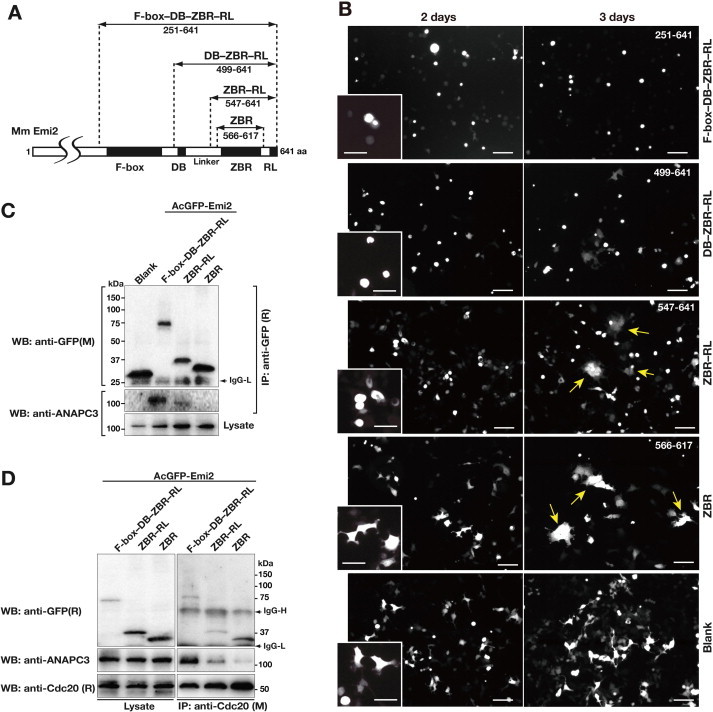
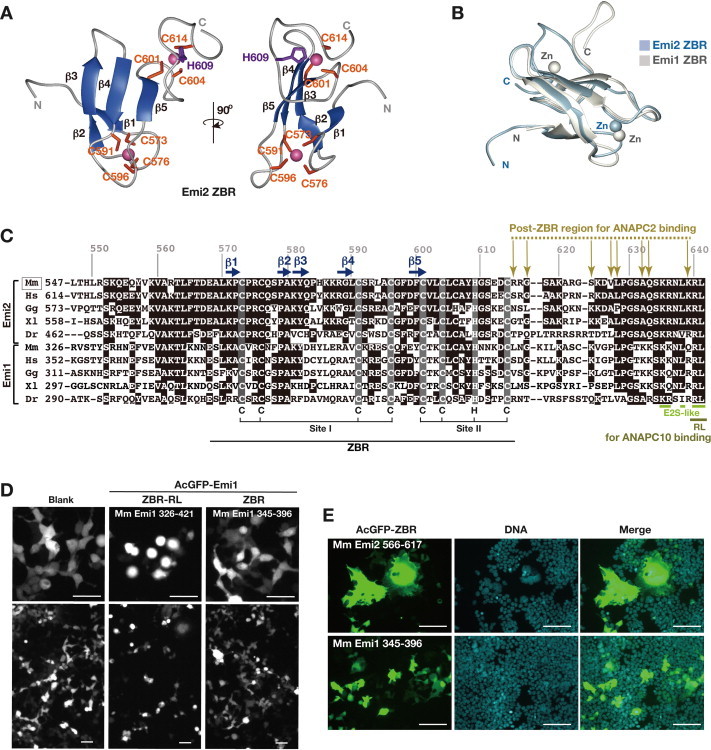
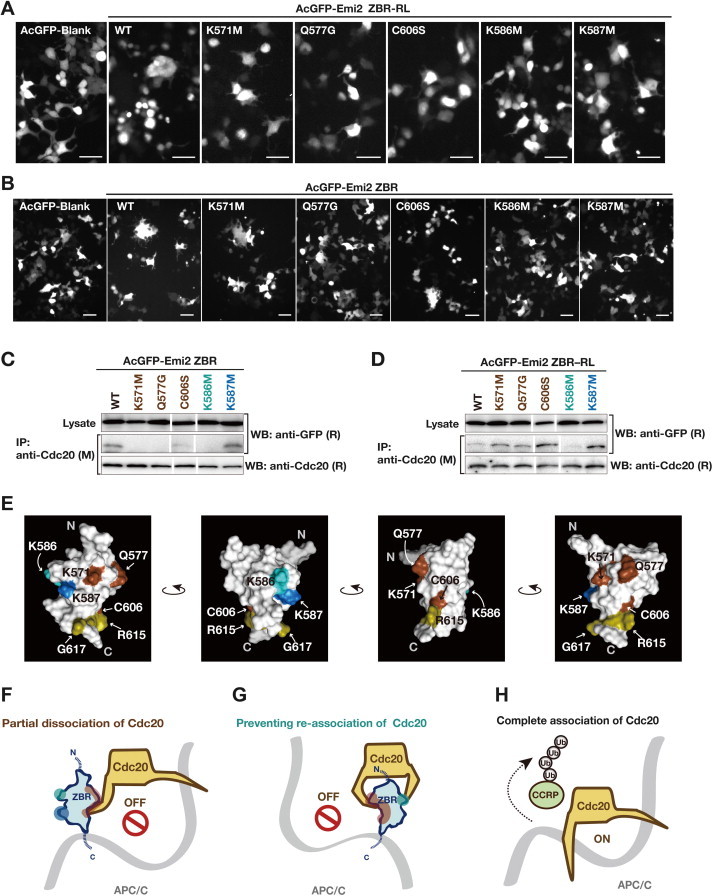
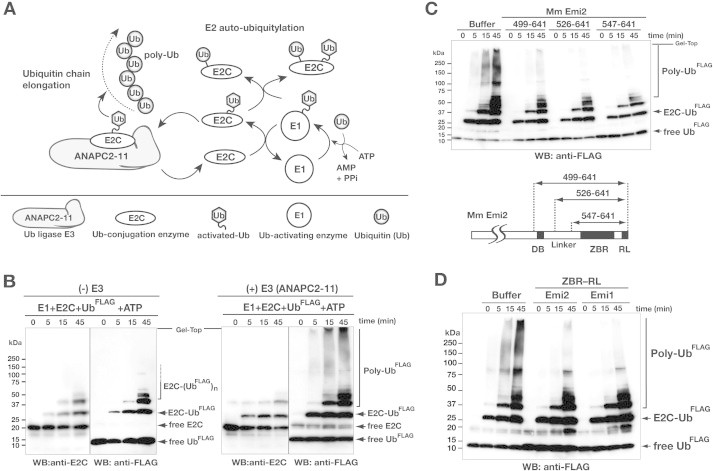
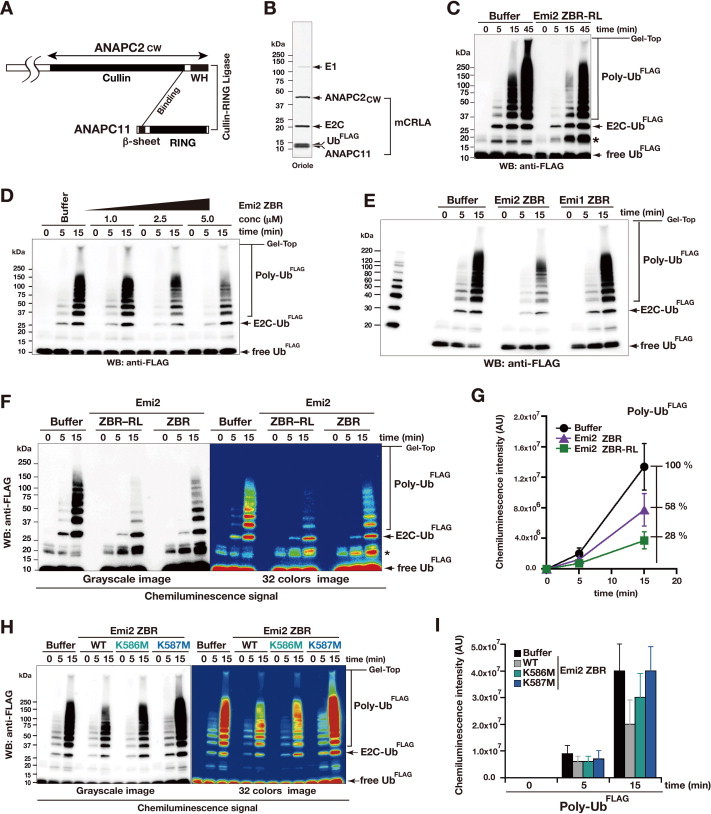
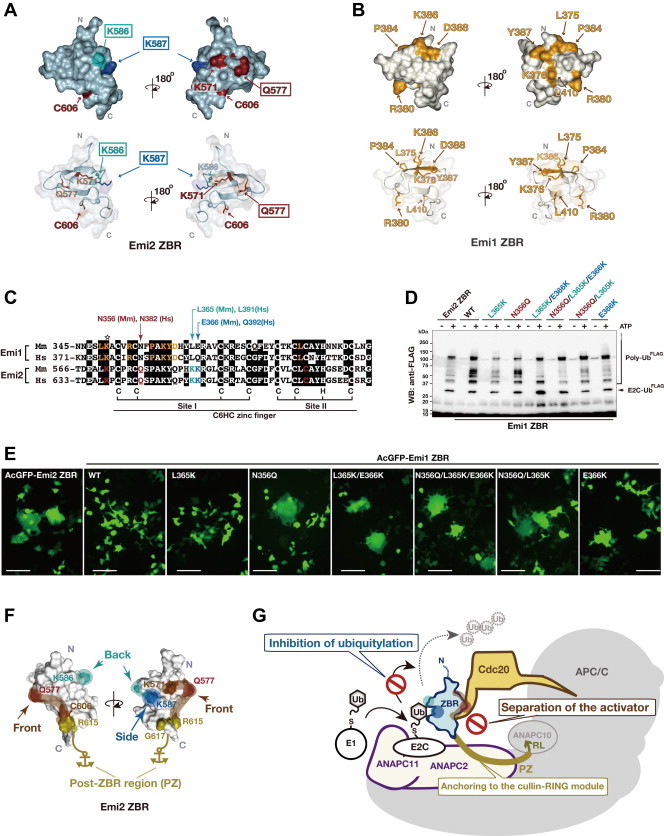
Anaphase-promoting complex or cyclosome (APC/C) is a multisubunit ubiquitin ligase E3 that targets cell-cycle regulators. Cdc20 is required for full activation of APC/C in M phase, and mediates substrate recognition. In vertebrates, Emi2/Erp1/FBXO43 inhibits APC/C-Cdc20, and functions as a cytostatic factor that causes long-term M phase arrest of mature oocytes. In this study, we found that a fragment corresponding to the zinc-binding region (ZBR) domain of Emi2 inhibits cell-cycle progression, and impairs the association of Cdc20 with the APC/C core complex in HEK293T cells. Furthermore, we revealed that the ZBR fragment of Emi2 inhibits in vitro ubiquitin chain elongation catalyzed by the APC/C cullin-RING ligase module, the ANAPC2-ANAPC11 subcomplex, in combination with the ubiquitin chain-initiating E2, E2C/UBE2C/UbcH10. Structural analyses revealed that the Emi2 ZBR domain uses different faces for the two mechanisms. Thus, the double-faced ZBR domain of Emi2 antagonizes the APC/C function by inhibiting both the binding with the coactivator Cdc20 and ubiquitylation mediated by the cullin-RING ligase module and E2C. In addition, the tail region between the ZBR domain and the C-terminal RL residues [the post-ZBR (PZ) region] interacts with the cullin subunit, ANAPC2. In the case of the ZBR fragment of the somatic paralogue of Emi2, Emi1/FBXO5, these inhibitory activities against cell division and ubiquitylation were not observed. Finally, we identified two sets of key residues in the Emi2 ZBR domain that selectively exert each of the dual Emi2-specific modes of APC/C inhibition, by their mutation in the Emi2 ZBR domain and their transplantation into the Emi1 ZBR domain.

Keywords: APC/C; APC/C, anaphase-promoting complex/cyclosome; Cdc20; Cdc20, cell-division cycle protein 20; E2C, ubiquitin-conjugating enzyme E2 C or UBE2C; Emi2; Emi2, endogenous meiotic inhibitor 2; UBE2C; Ubiquitin ligase activity; ZBR domain; ZBR, zinc-binding region.


Figures

Supplementary Figure 1
The major components of the Emi2-mediated APC/C inhibition system, related to Fig. 2. (A) Co-IP assay using the HA-tagged F-box–DB–ZBR–RL fragment of Emi2 (residues 251–641 of mouse [Mm] Emi2) and Myc-tagged APC/C subunits: ANAPC2, ANAPC2-CT (C-terminus; residues 337–837 of mouse ANAPC2, corresponding to the cullin-homology region), ANAPC11, ANAPC10, and Cdc20. The recombinant proteins were produced in the conventional in vitro rabbit reticulocyte transcription/translation system. Here, the C-terminally tagged ANAPC10 did not co-immunoprecipitate with Emi2, whereas the N-terminally tagged ANAPC10 co-immunoprecipitated with Emi2 . (B) Schematic representation of the polyubiquitylation reaction by the substrate-recognition catalytic module of APC/C-Cdc20. Cyclin B1 (CycB1) is the target cell-cycle regulatory protein (CCRP) of APC/C-Cdc20. The Emi2 C-terminal CSF active region, which shares high amino acid sequence similarity with its homolog, Emi1, functions as an APC/C inhibitor. (C) The core subunits and coactivators of APC/C. The cullin and RING subunits, ANAPC2 and ANAPC11, are outlined in purple, and the subunits of the substrate-recognition module are outlined in light brown (see also panel B). ANAPC3/Cdc27, ANAPC10/Doc1, and a coactivator constitute the substrate-recognition module.
Supplementary Figure 2
Structural analysis of the Emi2 ZBR–RL and ZBR regions, related to Fig. 3. (A) The 2D [1H, 15N]-HSQC spectra of the Emi2 ZBR and ZBR–RL fragments. (B) Stereo view of the backbone traces for the 20 conformers of the solution structure of the ZBR domain of Emi2 (mouse Emi2; residues 566–617). (C) The 2D [1H, 15N]-HSQC spectra of the ZBR-RL fragment (mouse Emi2; residues 547–641), showing selected amide shift changes in the titration of the ANAPC2CW fragment (mouse ANAPC2 cullin-Winged-helix subdomain; residues 512–837). (D) Schematic diagrams showing the domain architectures of the E3 ubiquitin ligase subfamily, RING-between-RING fingers (RBR) proteins and the Emi/Erp family (Emi1 and Emi2). ZF, zinc-finger domain; NZF, Npl4-type ZF domain; UBA, ubiquitin-associated domain; UBL, ubiquitin-like domain; RBR, RING-between-RING domain; NLS, nuclear localization signal; RWD, domain found in RING finger-containing proteins, WD repeat-containing proteins, and DEAD-like helicases; POTRA, polypeptide transport-associated domain; CUL7L and CUL1L, Cullin 7- and Cullin 1-like domain; DOC, Doc1/ANAPC10-like domain.
Supplementary Figure 3
Additional information about the mutants of the Emi2 ZBR–RL and ZBR fragments, related to Fig. 4. (A) Multiple sequence alignment of the C6HC-type zinc finger domain of RBR proteins and Emi2 homologs from different organisms (The domain architectures of the Emi/Erp family and the RBR protein family are shown in Supplementary Fig.S2D). Species abbreviations are the same as in Fig. 3C. Green characters indicate highly conserved residues in Emi2 and its somatic paralog, Emi1. Cyan characters indicate highly conserved residues among Emi2 orthologues. Zinc-binding sites are shown in black boxes; conserved residues among the RBR and Emi/Erp proteins are shown in shaded boxes. Arrows indicate single amino acid substitutions introduced within the ZBR domain for phenotype analysis. Black arrows indicate the ZBR domain mutations that rescued the Emi2 ZBR–RL fragment (residues 547–641 of mouse Emi2)-induced mitotic defects (see also Fig. 4A). The E568A, L570V, Y582P, and S592A mutants of AcGFP-Emi2 ZBR–RL were poorly expressed and/or formed aggregates, indicating denatured protein structures. (B) The cell phenotype was not influenced by the expression of P579A (indicated by an asterisk), although its expression was higher than that of the WT. (C) A binding analysis of the core APC/C to the ZBR mutants of AcGFP-Emi2 ZBR–RL and ZBR in the cells. The cell extracts from the indicated HEK293T transfectants were used for co-IP with an anti-GFP antibody. Western blots (WB) of the immunoprecipitates (IP) and cell lysates were probed with the indicated antibodies. M, mouse monoclonal antibodies; R, rabbit polyclonal antibodies.
Supplementary Figure 4
In vitro ubiquitylation assay using core enzymatic reaction components for polyubiquitylation by APC/C, related to Fig. 5. (A) In vitro polyubiquitin chain formation by the fundamental ubiquitylation system of APC/C. (B) and (C) Purified recombinant proteins used in the in vitro ubiquitylation assay. (B) APC/C-related catalytic components: UbFLAG (N-terminal FLAG-tagged ubiquitin), E1 (GST-tagged ubiquitin-activating enzyme), E2C (UBE2C/UbcH10), and E3 (full-length APC/C subunit-2 and -11 subcomplex, ANAPC2–11; co-expressed in the baculovirus-insect cell system). (C) Emi2 fragments synthesized in an E. coli cell-free system in the presence of Zn2+ ions (the band with an asterisk is the putative degradation product of Emi2499–641). (D) Zinc (Zn)-dependent folding of the Emi2 C-terminal fragments containing the ZBR domain (see also Fig. 5C). The requirement of Zn2+ ions for protein synthesis and solubility was assayed in cell-free synthesis reactions with (+) or without (−) 50 μM ZnCl2. Total and supernatant (Sup) fractions were analyzed by SDS-PAGE followed by CBB staining. (E) Effect of the addition of an Emi2 C-terminal fragment on E1-catalyzed ubiquitin activation. The DB–ZBR–RL fragment of Emi2 did not impair the ubiquitin activation by E1.
Supplementary Figure 5
Ubiquitylation inhibitory activities of Emi2 ZBR–RL and ZBR fragments, related to Fig. 6. (A) Replicates of in vitro ubiquitylation assays to compare the abilities of the Emi2 ZBR–RL and ZBR fragments to inhibit polyubiquitin chain assembly, related to Fig. 6G. Ubiquitin adducts containing ubiquitin dimers and partially ubiquitylated Emi2 fragments were occasionally observed (asterisks). (B) The WB with the anti-E2C antibody shows that the auto-ubiquitylation of E2C was hardly affected by the Emi1 and Emi2 ZBR fragments, related to Fig. 6E. The white line indicates the junction between two membranes in simultaneous WB detection (original data shown at the bottom). Upper panel with high contrast shows these membranes arranged at angles in the same direction. (C) Replicates of the in vitro ubiquitylation assay using the mCRLA system, to determine the effects of ZBR mutations on in vitro polyubiquitin chain assembly. (D) The 2D [1H, 15N]-HSQC spectra of the Emi2 ZBR mutants, K586M and K587M.
Supplementary Figure 6
Characterization of the Emi2 ZBR mutants, related to Fig. 6H. (A) Morphological properties of HEK293T cells expressing the indicated mutants of AcGFP-Emi2 ZBR at 3 days post-transfection, related to panel B. Scale bar, 50 μm. (B–C) The effects of the indicated ZBR mutants on the in cell ubiquitylation sensitivities. The FK2 antibody recognizes ubiquitin conjugates, but not free ubiquitin. (D) Ribbon diagrams with selected side chains drawn in stick representations. The Emi2 ZBR domain (blue silver) is superimposed on the Emi1 ZBR domain (ivory white). The color-codes of the side chains correspond to those in Fig 7A and B.
Supplementary Figure 7
Cellular phenotypes associated with the AcGFP-Emi1 ZBR mutants constructed by the transplantation of Emi2-specific residues, related to Fig. 7E. Scale bar, 100 μm.
Fig. 1
Fig. 1
Exogenous expression of the Emi2 ZBR–RL fragment in proliferating cells causes abnormal cell division. (A) Morphological properties of unfixed HEK293T cells transfected with AcGFP-Emi2 ZBR–RL and AcGFP-Blank control vector. At 2 days post-transfection, cells were observed by exposure to blue light (GFP) and phase contrast imaging (PhC). The panels on the right show merged images. Scale bar, 50 μm. (B) Fluorescence-activated cell sorting (FACS) analysis of AcGFP-positive cells at 2 days post-transfection, using propidium iodide DNA staining to determine cell cycle phase: G1, S, or G2/M. NC, not categorized. A stacked bar graph showing the percentage of cells in each phase of the cell cycle is displayed on the right. (C) Subcellular analysis of sphere-shaped cells expressing AcGFP-Emi2 ZBR–RL. Mitotic spindles were visualized with Alexa Fluor 633-labeled anti-α-tubulin antibodies (middle) and Hoechst 33422-stained chromosomal DNA (bottom). Scale bar, 10 μm. (D) Western blots (WBs) showing endogenous CycB1 and securin levels in cell extracts from AcGFP transfectants at 2 days post-transfection. Alpha-tubulin served as a loading control. (E) 3D confocal microscopy images of cells expressing AcGFP-Emi2 ZBR–RL (green) at M-phase. Alexa Fluor 647-labeled anti-ANAPC2 served as an APC/C marker (magenta). The dark shaded area in the middle of the cell corresponds to the region of condensed chromosomes in the mitotic spindle. The images represent the xy section with 2 perpendicular lines: the horizontal line (top) in the xz plane and the vertical line (side) in the yz plane. The central box corresponds to the position of the currently displayed xy plane. Scale bar, 10 μm. (F) Cells expressing AcGFP-Emi2 ZBR–RL at 3 days post-transfection, stained with Hoechst 33342 for nuclear DNA. Scale bar, 100 μm. (G) Diagram of major morphological changes observed during the cell cycle progression of HEK293T cells and the inhibition of mitosis by the AcGFP-Emi2 ZBR–RL fusion construct used in the transfection assays. (For interpretation of the references to colour in this figure legend, the reader is referred to the web version of this article.)
Fig. 2
Fig. 2
Cellular assays using a series of AcGFP-Emi2 fragment fusion constructs. (A) Diagram of the Emi2 C-terminal constructs. Numbers correspond to amino acid positions of mouse (Mm) Emi2. (B) Morphological phenotypes of HEK293T cells transfected with AcGFP-Emi2 fragment fusion constructs (see also panel A) at 2- and 3-days post-transfection. Scale bar, 100 μm. The boxes in the bottom left corners show close-up views of the cells at 2 days post-transfection. Scale bar, 50 μm. Yellow arrows indicate multinucleated cells and giant cells. (C) and (D) Interactions between endogenous APC/C and/or Cdc20 with a series of AcGFP-Emi2 fragment fusion constructs in the cell. Cell extracts from the indicated HEK293T transfectants were used for co-IPs with an anti-GFP antibody (C) or an anti-Cdc20 antibody (D). WBs of the immunoprecipitates (IP) and cell lysates were probed with the indicated antibodies. M, mouse monoclonal antibodies; R, rabbit polyclonal antibodies. (For interpretation of the references to colour in this figure legend, the reader is referred to the web version of this article.)
Fig. 3
Fig. 3
Structural and functional comparisons of the Emi1 and Emi2 ZBR domains. (A) and (B) Solution structure of the Emi2 ZBR domain, determined by NMR spectroscopy. (A) Ribbon-diagram representation of the lowest energy structures, showing two views from different angles. Secondary structure elements (β-strands) are colored ultramarine blue. Magenta-colored balls represent zinc ions. Numbered positions (orange and violet) indicate the residues coordinating the zinc ions. (B) Superimposition of the solution structure of the Emi1 ZBR domain (PDB ID, 2M6 N; Frye et al. [41]) and that of the Emi2 ZBR domain (PDB ID, 2RT9; the present study). (C) Multiple sequence alignment of the ZBR–RL regions from Emi1 and Emi2 orthologs. Mm, Mus musculus (mouse); Hs, Homo sapiens (human); Gg, Gallus gallus (chicken); Xl, Xenopus laevis (African clawed frog); Dr, Danio rerio (zebrafish). Identical residues are shown in black. Horizontal ultramarine blue arrows represent β-strands, and the residues in shaded boxes indicate zinc-coordinating residues, related to panel A. Ocher arrows indicate ANAPC2CW-interacting sites in the ZBR–RL region from mouse Emi2, based on NMR chemical shift perturbation data, related to Supplementary Fig. S2C. The lime line indicates the E2S-like sequence. The olive dashed line indicates the RL residues involved in binding to ANAPC10 . (D) Morphological phenotypes of HEK293T cells transfected with AcGFP-fusion constructs of the Mm Emi1 ZBR–RL and ZBR fragments at 3 days post-transfection. Scale bar, 50 μm. (E) Cells expressing AcGFP-Emi2 ZBR and AcGFP-Emi1 ZBR at 3 days post-transfection, stained with Hoechst 33342 for nuclear DNA. Scale bar, 50 μm. (For interpretation of the references to colour in this figure legend, the reader is referred to the web version of this article.)
Fig. 4
Fig. 4
Mutations of Emi2 ZBR domain surface residues. (A) and (B) Effects of single amino acid substitutions of the ZBR domain within AcGFP-Emi2 ZBR–RL and AcGFP-Emi2 ZBR on the abnormal mitotic phenotype in HEK293T cells at 3 days post-transfection. Morphological properties of the cells expressing the indicated mutants, the ZBR–RL fragment (A), or the ZBR fragment (B). WT, wild type sequence. Scale bar, 50 μm. (C) and (D) Interactions between endogenous Cdc20 and the ZBR mutants of AcGFP-Emi2 fragments in the cell. Cell extracts from the indicated HEK293T transfectants were used for co-IP with an anti-Cdc20 antibody. White lines indicate the gaps between lanes. (E) Characterization of amino acid residues on the surface of the Emi2 ZBR domain. (F–H) Hypothetical mechanism for the Emi2 ZBR-induced abnormal cell division phenotype, by destabilizing the association of Cdc20 with the APC/C core complex. The ZBR domain of Emi2 binds to the APC/C coactivator Cdc20, partially dissociates it from the core APC/C (red-brown) (F), and furthermore prevents the re-association of APC/C·Cdc20 (cyan) (G). Complete association of Cdc20 with APC/C (active mode) for the cell cycle regulatory protein (CCRP) ubiquitylation, illustrated (H) for comparison. The ZBR domain has a Cdc20-independent APC/C inhibitory activity (cobalt blue). The C-terminal region of contributes to anchoring the ZBR domain to the cullin-RING module of APC/C (ocher), shown in Fig. 3C. (For interpretation of the references to colour in this figure legend, the reader is referred to the web version of this article.)
Fig. 5
Fig. 5
The ZBR–RL fragment of Emi2 inhibits ubiquitin chain elongation by ANAPC2–11 in combination with E2C. (A) Schematic diagram showing the core enzymatic reaction of APC/C for polyubiquitin chain (poly-Ub) formation. E1 and the combination of E2C with E3 ligase (ANAPC2–11) generates activated ubiquitin (Ub) for ubiquitin chain elongation. Details of the ubiquitylation factors are described in the Section 3. (B) In vitro ubiquitylation reactions using N-terminal FLAG-tagged ubiquitin (UbFLAG) and the E1-E2C-E3 system shown in panel A. UbFLAG adducts and UbFLAG chains were detected by anti-FLAG Western blotting (WB). The WB with the anti-E2C antibody shows the auto-ubiquitylation activity of E2C. (C) Inhibition of ubiquitin chain elongation by the indicated Emi2 C-terminal fragments. Numbers correspond to amino acid positions of mouse (Mm, Mus musculus) Emi2. (D) Inhibition of ubiquitin chain elongation by the ZBR–RL fragments from Mm Emi2 (residues 547–641) and Mm Emi1 (residues 326–421).
Fig. 6
Fig. 6
Inhibition of ubiquitin chain elongation by the Emi2 ZBR-domain fragment. (A) Diagram representing the minimized CRL-type E3 module of APC/C, mCRLA. (B) Purified protein components of the in vitro ubiquitylation system using mCRLA. The SDS–PAGE gel was stained with Oriole fluorescent gel stain. (C) In vitro ubiquitylation inhibition assay of the Emi2 ZBR–RL fragment, using the mCRLA system. Bands marked with asterisks contain ubiquitin dimers and partially ubiquitylated Emi2 fragments. (D) WB showing the concentration-dependent inhibitory effect of the ZBR fragment of Emi2 against the mCRLA-mediated ubiquitin chain elongation. (E) In vitro assay for the inhibitory activities of the ZBR fragments from mouse Emi2 (residues 566–617) and Emi1 (residues 345–396) against ubiquitin elongation by the mCRLA system. (F) and (G) Comparison of the inhibitory activities of the Emi2 ZBR–RL and ZBR fragments against ubiquitin chain elongation. (F) WB bands, visualized using a luminescent image analyzer system. (G) Graphs representing the production of poly-Ub, determined by measuring the chemiluminescent-signal intensities (arbitrary units, AU) of WBs, using the Image Gauge software. Baseline levels were adjusted by subtracting the time-zero value from all other time-point values. Each graph represents the mean ± SEM (n = 6; the other 5 WBs are shown in Supplementary Fig. S5A). (H) WB showing the effects of the K576M and K587M mutations on the inhibition of ubiquitin chain elongation by the Emi2 ZBR fragment. (I) Production levels of poly-Ub, representing the chemiluminescent intensities (AU) of the bands shown in panel H. Results represent the mean ± SEM of 3 independent experiments (the other two WBs are shown in Supplementary Fig. S5C).
Fig. 7
Fig. 7
The key residues exerting the characteristic inhibitory activity of the Emi2 ZBR-domain against APC/C. (A and B) Comparison of the Emi2 and Emi1 ZBRs by surface mapping of the functional residues involved in the inhibition of the APC/C E3 activity. The images on the top show surface representations of Emi2 ZBR (A) and Emi1 ZBR (B), in the same orientation. The merged images of the ribbon diagram and the surface structure are displayed at the bottom, respectively. The Emi2 residues colored red-brown and cyan correspond to the putative Cdc20 separation mechanism illustrated in Fig. 4F. K587 (cobalt blue) is responsible for the inhibition of ubiquitin chain elongation (Fig. 5H and I; Supplementary Fig. S6). The Emi1 residues colored yellow-orange are related to the inhibition of the ubiquitin chain elongation by the APC/C-Cdh1 with E2C . (C) Pairwise sequence alignment of the ZBR–RL regions from the mouse (Mm) and human (Hs) Emi/Erp family proteins. The amino acid sequence similarity between mouse and human: Emi1, 79.2% identical, Emi2, 86.3% identical (GENETYX). Arrows indicate the target residues within the Emi1 ZBR domain for the transplantation of Emi2-specific residues: N356Q of Mm Emi1 for Q577 of Mm Emi2; L365K of Mm Emi1 for K586 of Mm Emi2; E366K of Mm Emi1for K587 of Mm Emi2. The star indicates the functional Lys (K) residue conserved in the Emi1 and Emi2 ZBRs. (D) WB showing the effects of the transplantation of Emi2-specific residues into the Emi1 ZBR fragment on the mCRLA-mediated ubiquitin chain elongation. (E) Cellular phenotypes associated with the AcGFP-Emi1 ZBR mutants constructed by the transplantation of the Emi2-specific residues. Scale bar, 100 μm. Images of these transfectants stained with Hoechst 33342 for nuclear DNA are shown in Supplementary Fig. S7. (F) The functional residues of the Emi2 ZBR-domain surface, which are related to the inhibition of the APC/C activity. (G) Schematic representation of the inhibition mechanisms against APC/C-Cdc20 by the Emi2 ZBR domain and the post-ZBR (PZ) region. The C-terminal tail of Emi2 consists of the PZ region and the RL residues. The PZ region binds to ANAPC2 within the cullin-RING ligase module of APC/C (ANAPC2–11 subcomplex) while the RL residues bind to ANAPC10. The Emi2 ZBR domain inhibits the ubiquitin chain elongation by the ANAPC2–11 subcomplex combined with E2C. On the other hand, the Emi2 ZBR domain binds to the coactivator Cdc20 and impairs its association with the APC/C core complex, thereby turning off the E3 activity. The PZ region enhances the ZBR-mediated activities by anchoring it to the APC/C catalytic core complex. (For interpretation of the references to colour in this figure legend, the reader is referred to the web version of this article.)

Similar articles

Cited by

References

    1. Hershko A., Ciechanover A. The ubiquitin system. Annu. Rev. Biochem. 1998;67:425–479. - PubMed
    1. Weissman A.M., Shabek N., Ciechanover A. The predator becomes the prey: regulating the ubiquitin system by ubiquitylation and degradation. Nat. Rev. Mol. Cell Biol. 2011;12:605–620. - PMC - PubMed
    1. Deshaies R.J., Joazeiro C.A. RING domain E3 ubiquitin ligases. Annu. Rev. Biochem. 2009;78:399–434. - PubMed
    1. Peters J.M. The anaphase promoting complex/cyclosome: a machine designed to destroy. Nat. Rev. Mol. Cell Biol. 2006;7:644–656. - PubMed
    1. Sullivan M., Morgan D.O. Finishing mitosis, one step at a time. Nat. Rev. Mol. Cell Biol. 2007;8:894–903. - PubMed