. 2014 Jun 13;3(6):619-29.
doi: 10.1016/j.molmet.2014.05.006. eCollection 2014 Sep.

The histone acetyltransferase MOF activates hypothalamic polysialylation to prevent diet-induced obesity in mice

Affiliations

The histone acetyltransferase MOF activates hypothalamic polysialylation to prevent diet-induced obesity in mice

Xavier Brenachot et al. Mol Metab. .

Abstract

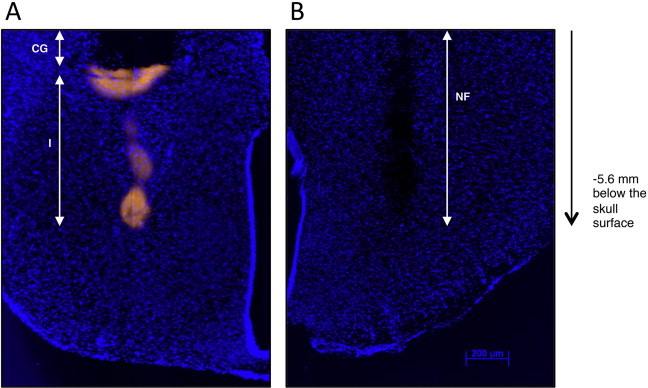
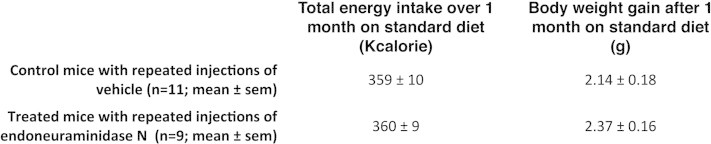
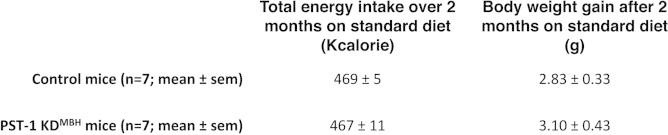
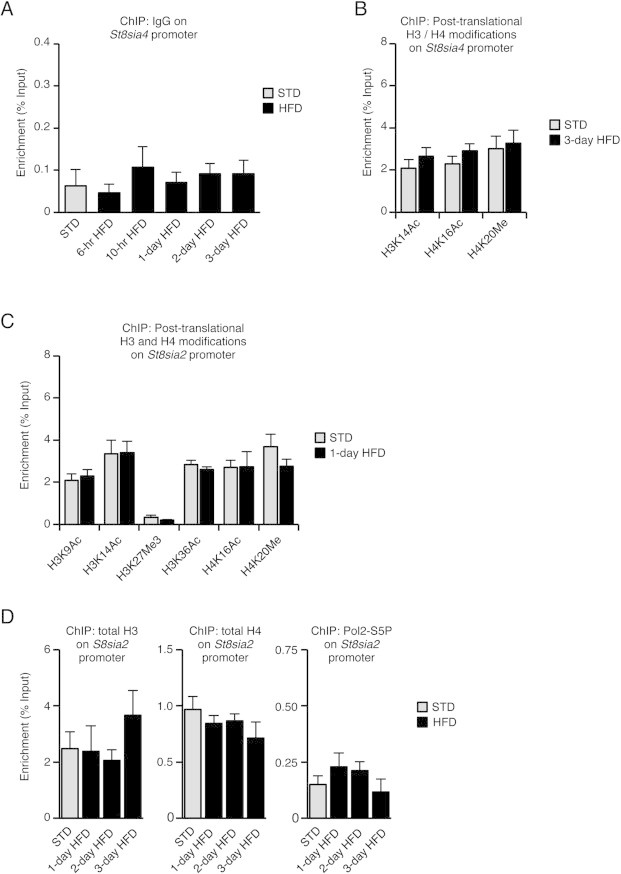
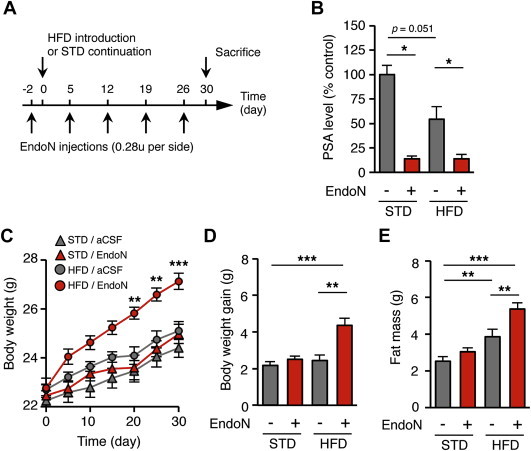
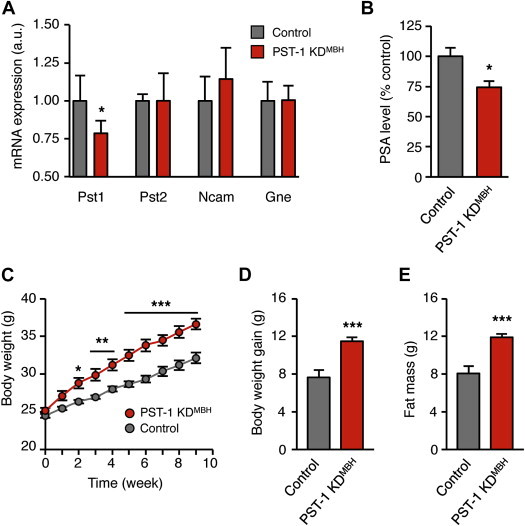
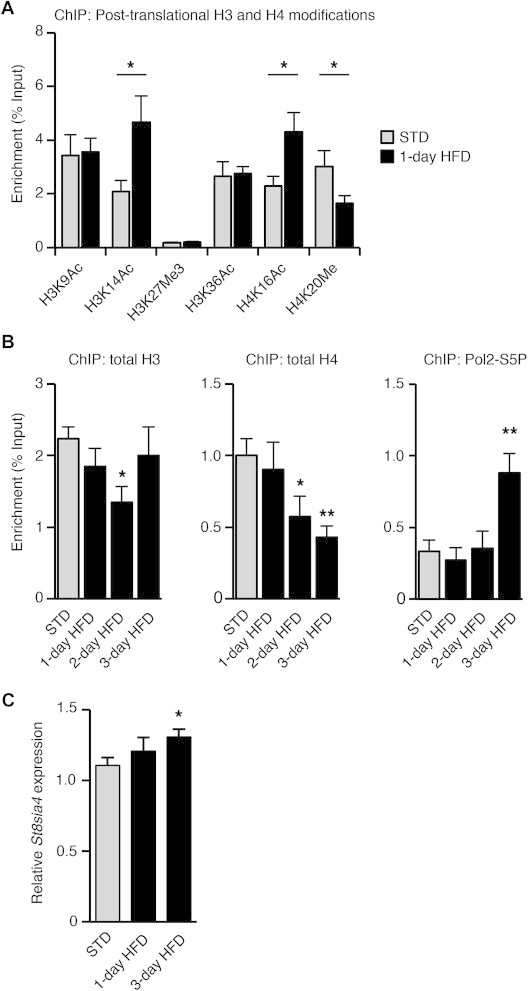
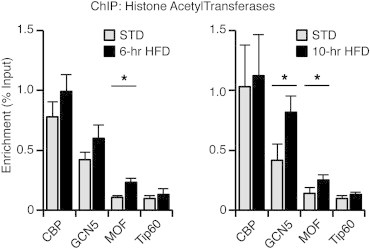
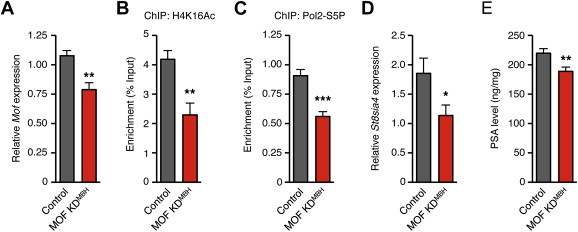
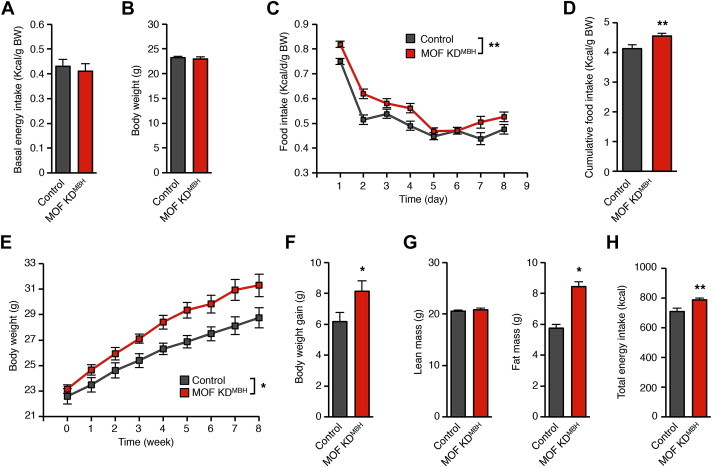
Overfeeding causes rapid synaptic remodeling in hypothalamus feeding circuits. Polysialylation of cell surface molecules is a key step in this neuronal rewiring and allows normalization of food intake. Here we examined the role of hypothalamic polysialylation in the long-term maintenance of body weight, and deciphered the molecular sequence underlying its nutritional regulation. We found that upon high fat diet (HFD), reduced hypothalamic polysialylation exacerbated the diet-induced obese phenotype in mice. Upon HFD, the histone acetyltransferase MOF was rapidly recruited on the St8sia4 polysialyltransferase-encoding gene. Mof silencing in the mediobasal hypothalamus of adult mice prevented activation of the St8sia4 gene transcription, reduced polysialylation, altered the acute homeostatic feeding response to HFD and increased the body weight gain. These findings indicate that impaired hypothalamic polysialylation contribute to the development of obesity, and establish a role for MOF in the brain control of energy balance.

Keywords: Chromatin; Food intake; Hypothalamus; Obesity; Polysialylation; Synaptic plasticity.


Figures

Supplementary Figure 1
Traces of injectors in stained brain sections. A. Traces of the cannula guide (CG) and the injectors (I) used for repeated injections of EndoN in the MBH. Injectors were inserted at −5.6 mm below the skull surface. Note that the permanent cannula guide was shorter than the injectors to minimize injury. The injectors were labeled with DiI (in yellow) to visualize their traces. Slides were stained with DAPI (in blue) to reveal nuclei. B. Traces of the nanofil (NF) used for single injection of lentiviral particles in the MBH. Nanofil was inserted at −5.6 mm below the skull surface. Slides were stained with DAPI (in blue) to reveal nuclei.
Supplementary Figure 2
Total energy intake and body weight gain of endoN-treated and control mice during 1 month. Mice received 5 weekly bilateral stereotactic injections of endoN or vehicle (artificial cerebrospinal fluid) in the MBH under gaseous anesthesia. Animals were kept on standard diet. Food intake and body weight were monitored daily during one month after the first injection.
Supplementary Figure 3
Total energy intake and body weight gain of PST-1 KDMBH and control mice during 2 months. Mice received shRNA-expressing lentiviral vectors against Pst-1 or control vectors, by bilateral stereotactic injections in the MBH. After a 3-week recovery period, mice were further maintained on standard diet for an additional 2 month-period. Food intake and body weight were monitored daily during this period.
Supplementary Figure 4
Specificity and reversibility of St8sia4 chromatin remodeling upon HFD exposure in MBH. A. Control ChIP with a non-specific isotype IgG antibody. B. Histones H3 and H4 post-translational modifications on the promoter of St8sia4 were analyzed by ChIP. Chromatin extracts were obtained from MBH of mice fed either a standard diet (STD) or a HFD for 3 days (3-day HFD). C. Histones H3 and H4 post-translational modifications on the promoter of St8sia2 were analyzed by ChIP. Chromatin extracts were obtained from MBH of mice fed either a standard diet (STD) or a HFD for 24 h (1-day HFD). D. Association of total histones H3 and H4 and of Pol2-S5P with the promoter of St8sia2 was analyzed by ChIP on MBH extracts obtained after 1, 2 or 3 days of HFD exposure and compared to levels in MBH from mice fed a standard diet (STD). n = 6–8. Data are expressed as mean ± SEM. *p < 0.05.
Figure 1
Figure 1
PSA removal in the hypothalamus accelerates the onset of DIO. (A) Picture showing the injection protocol of endoN in the mediobasal hypothalamus of mice fed either standard or a high-fat diet for one month. Five weekly bilateral injections of endoN (0.28 units/side) were performed. Control mice received artificial cerebrospinal fluid. (B) Effect of endoN injections on PSA level in the mediobasal hypothalamus, at the end of the treatment (n = 4 STD/aCSF; n = 5 STD/endoN; n = 5 HFD/aCSF; n = 6 HFD/endoN; *: p < 0.05; Mann Whitney test). (C) Body weight of endoN-treated and control mice fed a standard diet or a HFD for one month (n = 10 STD/aCSF; n = 9 STD/endoN; n = 13 HFD/aCSF; n = 14 HFD/endoN; **: p < 0.01. ***: p < 0.001; two-way ANOVA and Bonferroni post-hoc test). (D) Body weight gain of endoN-treated and control mice fed a standard diet or a HFD for one month (**: p < 0.01. ***: p < 0.001; Mann Whitney test). (E) Fat mass of endoN-treated and control mice fed a standard diet or a HFD for one month (**: p < 0.01. ***: p < 0.001; Mann Whitney test). All results are mean ± SEM.
Figure 2
Figure 2
Reduction of polysialylation in the hypothalamus increases the body weight gain on HFD. St8sia4 knockdown mice, designated as PST-1 KDMBH mice, were stereotactically injected in the mediobasal hypothalamus with ∼7.5 × 105 shRNA-expressing lentiviral vectors against a Pst1 sequence. Control mice received lentiviral vectors targeting a non-mammalian sequence. (A) Effect of the lentiviral vectors-mediated RNA interference on relative mRNA expression of genes involved in the PSA signaling, assessed by RT-qPCR on mediobasal hypothalamus extracts from standard diet-fed mice (n = 4 control; n = 5 PST-1 KDMBH; *: p < 0.05; unpaired t test. (B) PSA level in the mediobasal hypothalamus of PST-1 KDMBH mice fed a HFD for 2 months, compared to control mice (n = 9 control; n = 9 PST-1 KDMBH; *: p < 0.05; unpaired t test). (C) Kinetic of the body weight of PST-1 KDMBH and control mice during 2-month HFD (*: p < 0.05, **: p < 0.01. ***: p < 0.001; two-way ANOVA and Bonferroni post-hoc test). (D) Body weight gain of PST-1 KDMBH and control mice after 2-month HFD (***: p < 0.001; unpaired t test). (E) Fat mass of PST-1 KDMBH and control mice after 2 month-HFD (***: p < 0.001; unpaired t test). All results are mean ± SEM.
Figure 3
Figure 3
HFD exposure activates St8sia4 gene transcription. (A) Histones H3 and H4 post-translational modifications on the promoter of St8sia4 were analyzed by ChIP. Chromatin extracts were obtained from MBH of mice fed either a standard diet (STD) or a HFD for 24 h (1-day HFD). (B) Association of total histones H3 and H4 and of Pol2-S5P with the promoter of St8sia4 was analyzed by ChIP on MBH extracts obtained after 1, 2 or 3 days of HFD exposure and compared to levels in MBH of mice fed a standard diet (STD). (C) St8sia4 mRNA expression analyzed by RT-qPCR on MBH of mice fed a either a standard diet (STD) or a HFD for 1 or 3 day(s). STD: n = 9–12; HFD: n = 5–10. Data are expressed as mean ± SEM. *p < 0.05.
Figure 4
Figure 4
Histone acetyltransferases are recruited at the promoter of St8sia4 upon HFD exposure. The recruitment of the histone acetyltransferases CBP, GCN5, MOF and TIP60 on the promoter of St8sia4 was analyzed by ChIP. MBH chromatin extracts were prepared from mice either fed a standard diet (STD) or exposed to a HFD for 6 h (6-hr HFD) and 10 h (10-hr HFD). STD: n = 9–10; HFD 6 h: n = 9–10; HFD 10 h: n = 8. Data are expressed as mean ± SEM. *p < 0.05.
Figure 5
Figure 5
Mof knock-down impairs St8sia4-dependent polysialylation in the mediobasal hypothalamus. Mof knock-down was obtained by stereotaxic injection of lentiviral particles (∼1.0 × 106 particles) containing Mof targeting shRNA (MOF KDMBH) or a shRNA targeting a non-mammalian RNA sequence (control) in the MBH. All analyses were performed 3 weeks after the delivery of lentiviral particles to the MBH. (A) RT-qPCR analysis of hypothalamic Mof mRNA levels in MOF KDMBH and control mice. Control: n = 6; MOF KDMBH: n = 7. (B) ChIP analysis of H4K16Ac interaction with the St8sia4 promoter in the MBH of control and MOF KDMBH mice after 24 h of HFD. Control: n = 7; MOF KDMBH: n = 7. (C) ChIP analysis of Pol2-S5P interaction with St8sia4 promoter in control and MOF KDMBH mice fed a HFD for 3 days. Control: n = 7; MOF KDMBH: n = 7. (D) RT-qPCR analysis of hypothalamic St8sia4 mRNA levels in MOF KDMBH and control mice. Control: n = 6; MOF KDMBH: n = 7. (E) PSA levels in control and MOF KDMBH mice fed a HFD for 8 days. Control: n = 9; MOF KDMBH: n = 9. Data are expressed as mean ± SEM. *p < 0.05.
Figure 6
Figure 6
Lentiviral-mediated Mof knock-down in the hypothalamus accelerates the onset of DIO. (A) Energy intake of control and MOF KDMBH mice fed a standard diet, 3 weeks after the injection of the shRNA-containing lentiviral particles. Control: n = 12; MOF KDMBH: n = 14. (B) Body weight of control and MOF KDMBH mice fed a standard diet, 3 weeks after the injection of the shRNA-containing lentiviral particles. Control: n = 12; MOF KDMBH: n = 14. (C)–(H) Effect of Mof knock-down on food intake and body weight during short-term and long-term HFD. Control and MOF KDMBH mice were fed a HFD for 8 weeks. (C) Analysis of the effect of Mof knock-down on the homeostatic feeding response to HFD. Daily energy intake of control and MOF KDMBH mice was recorded for 8 days. (D) Cumulative energy intake over 8 days of HFD. (E) Body weight of control and MOF KDMBH mice fed a HFD for 8 weeks. (F) Body weight gain of control and MOF KDMBH mice after 8 weeks of HFD feeding. (G) Lean mass and fat mass of control and MOF KDMBH mice after 8 weeks of HFD. (H) Total energy intake of control and MOF over 8 weeks of HFD feeding. Control: n = 7; MOF KDMBH: n = 8. Data are expressed as mean ± SEM. *p < 0.05; **p < 0.01; ***p < 0.001.

Similar articles

Cited by

References

    1. Morton G.J., Cummings D.E., Baskin D.G., Barsh G.S., Schwartz M.W. Central nervous system control of food intake and body weight. Nature. 2006;443(7109):289–295. - PubMed
    1. Cone R.D. Anatomy and regulation of the central melanocortin system. Nature Neuroscience. 2005;8(5):571–578. - PubMed
    1. Warne J.P., Xu A.W. Metabolic transceivers: in tune with the central melanocortin system. Trends in Endocrinology and Metabolism: TEM. 2013;24(2):68–75. - PMC - PubMed
    1. Liu T., Kong D., Shah B.P., Ye C., Koda S., Saunders A. Fasting activation of AgRP neurons requires NMDA receptors and involves spinogenesis and increased excitatory tone. Neuron. 2012;73(3):511–522. - PMC - PubMed
    1. Vong L., Ye C., Yang Z., Choi B., Chua S., Jr., Lowell B.B. Leptin action on GABAergic neurons prevents obesity and reduces inhibitory tone to POMC neurons. Neuron. 2011;71(1):142–154. - PMC - PubMed

LinkOut - more resources