. 2014 Jun 14;3(6):652-63.
doi: 10.1016/j.molmet.2014.06.002. eCollection 2014 Sep.

PLIN5 deletion remodels intracellular lipid composition and causes insulin resistance in muscle

Affiliations

PLIN5 deletion remodels intracellular lipid composition and causes insulin resistance in muscle

Rachael R Mason et al. Mol Metab. .

Abstract

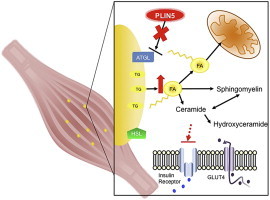
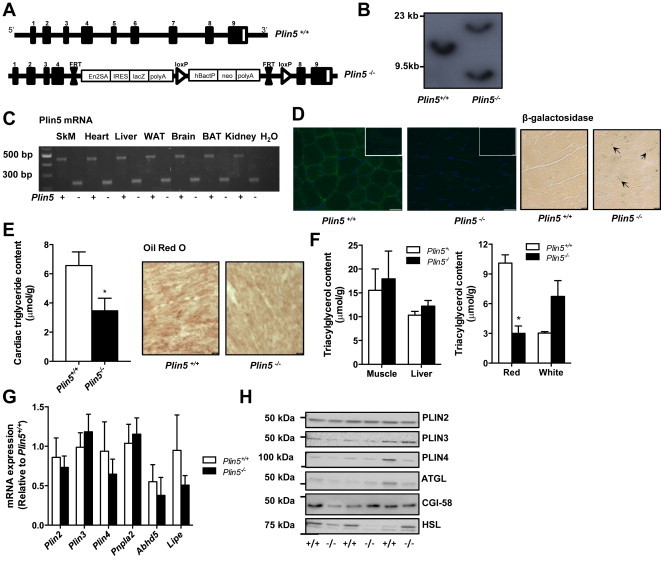
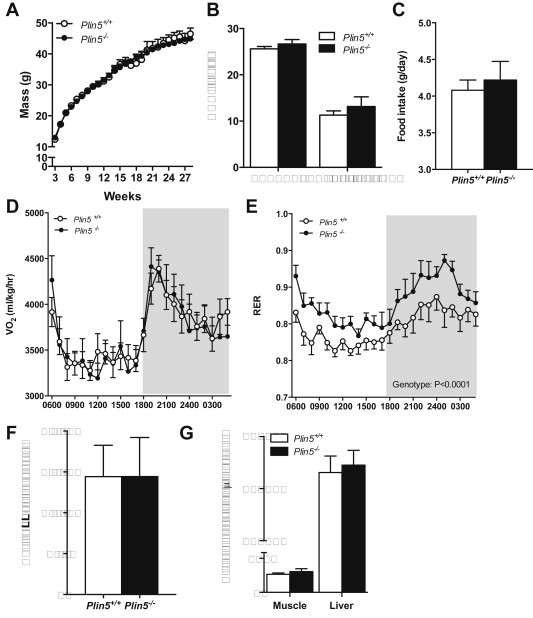
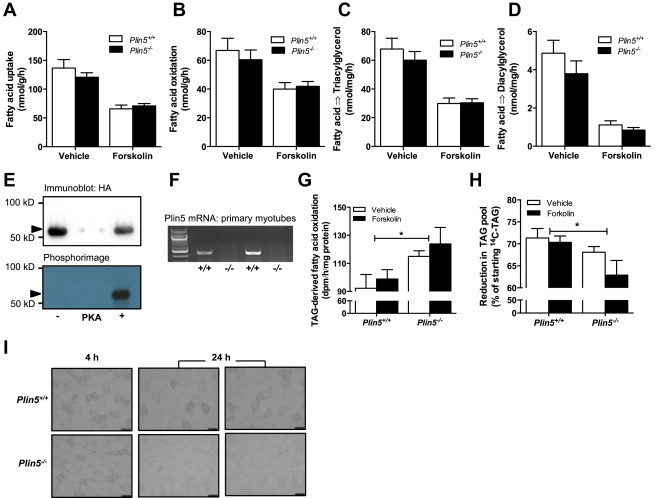
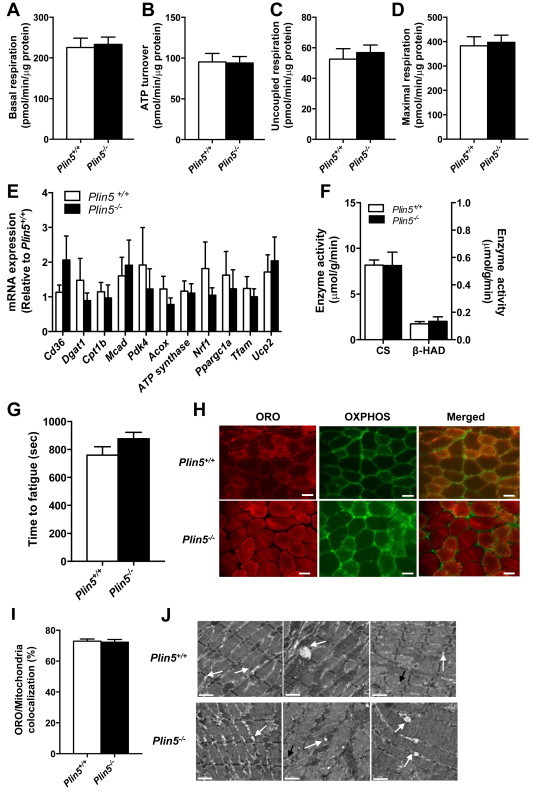
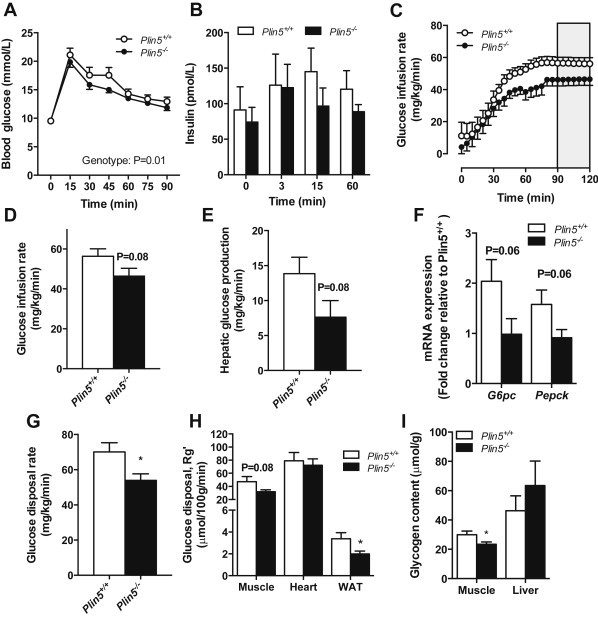
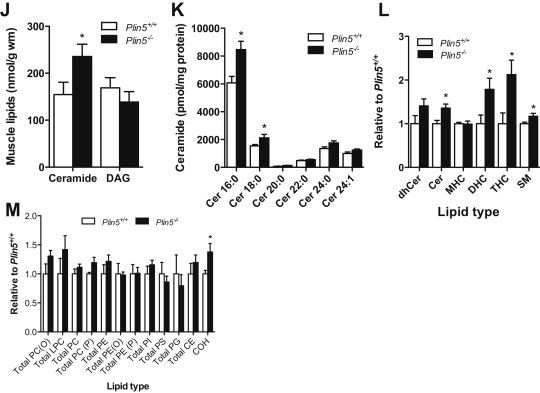
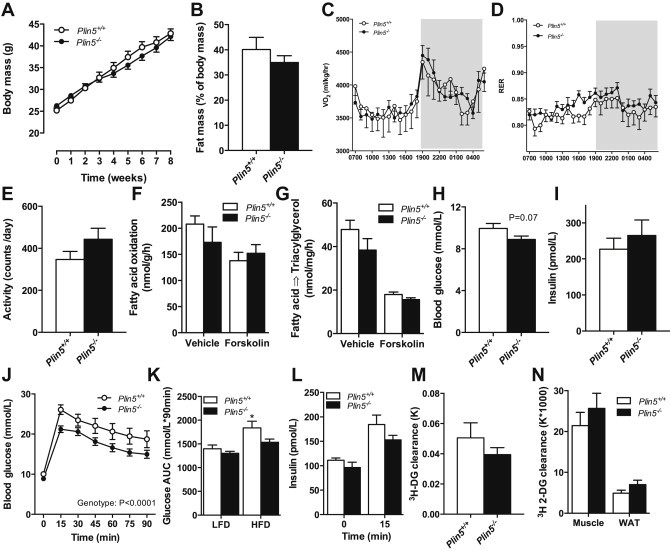
Defective control of lipid metabolism leading to lipotoxicity causes insulin resistance in skeletal muscle, a major factor leading to diabetes. Here, we demonstrate that perilipin (PLIN) 5 is required to couple intramyocellular triacylglycerol lipolysis with the metabolic demand for fatty acids. PLIN5 ablation depleted triacylglycerol stores but increased sphingolipids including ceramide, hydroxylceramides and sphingomyelin. We generated perilipin 5 (Plin5)(-/-) mice to determine the functional significance of PLIN5 in metabolic control and insulin action. Loss of PLIN5 had no effect on body weight, feeding or adiposity but increased whole-body carbohydrate oxidation. Plin5 (-/-) mice developed skeletal muscle insulin resistance, which was associated with ceramide accumulation. Liver insulin sensitivity was improved in Plin5 (-/-) mice, indicating tissue-specific effects of PLIN5 on insulin action. We conclude that PLIN5 plays a critical role in coordinating skeletal muscle triacylglycerol metabolism, which impacts sphingolipid metabolism, and is requisite for the maintenance of skeletal muscle insulin action.

Keywords: Insulin resistance; Lipid droplet; Lipid metabolism; Perilipin; Skeletal muscle.


Figures

None
Graphical abstract
Figure 1
Figure 1
Generation of Plin5−/− mice. (A) Targeting vector used for the generation of Plin5−/− mice. (B) Confirmation of Plin5 disruption by Southern blotting of genomic tail DNA and (C) RT-PCR of RNA from Plin5+/+ and Plin5−/− mice. SkM, skeletal muscle, WAT, white adipose tissue, BAT, brown adipose tissue. Upper band (Plin5+/+) 466 bp; lower band (Plin5−/−) 254 bp. (D) Left: Representative images of skeletal muscle sections stained with PLIN5 antibody from Plin5+/+ and Plin5−/− mice, with concentration matched serum controls inset. Scale bar = 50 μm. Right: Confirmation of lacZ expression in Plin5−/− hearts with β-galactosidase staining. Arrows pointing to regions of staining. Scale bar = 10 μm. (E) Cardiac triacylglycerol content (♂, n = 13 Plin5+/+, n = 15 Plin5−/−, Age = 12–17 weeks). Representative image of lipid droplet staining with ORO in heart. Scale bar = 10 μm. (F) Left: Skeletal muscle (mixed quadriceps) and liver triacylglycerol content (♂, n = 13 Plin5+/+, n = 15 Plin5−/−, Age = 12–17 weeks). Right: Triacylglycerol content in red and white portions of the quadriceps (♂, n = 4 Plin5+/+, n = 4 Plin5−/−, Age = 12–17 weeks). *P < 0.05 vs. Plin5+/+ mice. (G) Skeletal muscle expression of PLIN genes Plin2, Plin3 and Plin4 and of lipase and lipase coactivator genes Pnp1a2, Abhd5 and Lipe (♂, n = 4–5 Plin5+/+, n = 6–7 Plin5−/−). (H) Representative immunoblots of PLIN proteins and lipases in skeletal muscle (♂, n = 3 Plin5+/+, n = 3 Plin5−/−).
Figure 2
Figure 2
Plin5 deletion does not alter growth, adiposity, or energy expenditure but does impact substrate partitioning. (A) Body mass (♂, n = 6–16 Plin5+/+, n = 10–16 Plin5−/−). (B) Lean mass and fat mass assessed by DEXA (♂, n = 10 Plin5+/+, n = 6 Plin5−/−, Age = 14–16 weeks). (C) Food intake (♂, n = 5 Plin5+/+, n = 5 Plin5−/−, Age = 14–16 weeks). (D) Oxygen consumption (VO2) and (E) respiratory exchange ratio (RER) were assessed by indirect calorimetry (♂, n = 10 Plin5+/+, n = 6 Plin5−/−, Age = 14–16 weeks). Shaded area represents dark phase. (F) Total daily activity (♂, n = 9 Plin5+/+, n = 5 Plin5−/−, Age = 14–16 weeks). (G) Muscle (n = 7 Plin5+/+, n = 8 Plin5−/−) and liver (n = 8 Plin5+/+, n = 9 Plin5−/−) glycogen content in 4 h fasted mice (♂, Age = 14–16 weeks).
Figure 3
Figure 3
Effects of PLIN5 on skeletal muscle fatty acid metabolism. Fatty acid metabolism was examined in isolated soleus muscle. (A) Fatty acid uptake, (B) fatty acid oxidation, (C) fatty acid incorporation into triacylglycerol and (D) fatty acid incorporation into diacylglycerol (♂, Vehicle: n = 12–16 Plin5+/+, n = 15–18 Plin5−/−; Forskolin, n = 7–12 Plin5+/+, n = 9–12 Plin5−/−, Age = 14–16 weeks). (E) Recombinant murine PLIN5 was phosphorylated by cAMP-dependent protein kinase (PKA) catalytic subunit in kinase assay buffer containing [γ-32P]ATP. The protein mixture was separated by SDS-PAGE and PLIN5 identified by immunoblotting against HA (upper band). The 32P-labeled PLIN5 was detected by phosphorimaging (lower band). Arrow denotes PLIN5. Representative of 2 independent experiments. (F) Plin5 mRNA expression in primary myotubes of Plin5−/− and Plin5+/+ mice. (G) Oxidation of triacylglycerol (TAG)-derived fatty acids in myotubes and (H) the percentage reduction of the radiolabeled TAG lipid pool (n = 8 for each group from 2 independent donor mice and two independent experiments). *Main effect for genotype, P < 0.05. (I) Representative image of lipid droplets stained with oil red O in skeletal muscle of Plin5−/− and Plin5+/+ mice following a 4 h and 24 h fast. Scale bar = 50 μm.
Figure 4
Figure 4
Mitochondrial capacity is not altered by PLIN5 deletion. Measures of mitochondrial capacity in Plin5−/− vs. Plin5+/+ myotubes: (A) basal mitochondrial oxygen consumption rate, (B) ATP turnover, (C) uncoupled respiration and (D) maximal respiration (n = 10 for each group obtained from three independent donor mice and three independent experiments). (E) Expression of fatty acid uptake, storage, and oxidation genes and oxidative phosphorylation genes (♂, n = 4–6 Plin5+/+, n = 5–7 Plin5−/−). (F) Skeletal muscle citrate synthase and ß-hydroxyacyl CoA dehydrogenase (β-HAD) maximal enzyme activity (♂, n = 8 Plin5+/+, n = 8 Plin5−/−). (G) Maximal running capacity assessed on a treadmill (♂, n = 7 Plin5+/+, n = 12 Plin5−/−). The exercise intensity was increased every minute until mice reached exhaustion. (H) Confocal images showing oil red O (lipid, red), OXPHOS (mitochondria, green) staining and the merged images in mixed quadriceps muscle. Scale bar = 50 μm. (I) The mitochondria/oil Red O colocation was not different between genotypes (♂, n = 3 Plin5+/+, n = 3 Plin5−/−. Nine independent sections were counted per animal with an average total of 27 ± 2 fibers per animal). (J) Electron microscopy imaging of mixed quadriceps muscle. The white arrows highlight lipid droplets and mitochondria in contact, black arrows highlight lipid droplets not in contact with mitochondria. Scale bar = 1 μm.
Figure 5
Figure 5
Glucose tolerance is maintained, but insulin sensitivity is reduced in association with muscle ceramide accumulation in Plin5−/− mice fed a low-fat diet. (A) Glucose tolerance of Plin5−/− mice and Plin5+/+ littermates (♂, n = 23 Plin5+/+, n = 22 Plin5−/−, Age = 10–17 weeks). (B) Plasma insulin in response to glucose tolerance test (♂, n = 10 Plin5+/+, n = 7 Plin5−/−, Age = 10–17 weeks). (C) Glucose infusion rate during the hyperinsulinemic euglycemic clamp with the steady-state period highlighted in grey shading. (D) Average glucose infusion rate during steady state (♂, n = 10 Plin5+/+, n = 12 Plin5−/−, Age = 13–16 weeks). (E) Hepatic glucose production during hyperinsulinemic euglycemic clamp (♂, n = 10 Plin5+/+, n = 12 Plin5−/−, Age = 13–16 weeks). (F) Expression of gluconeogenic genes G6pc and Pepck (♂, n = 9 Plin5+/+, n = 10 Plin5−/−, Age = 13–16 weeks). (G) Glucose disposal rate during the hyperinsulinemic euglycemic clamp (♂, n = 10 Plin5+/+, n = 12 Plin5−/−, Age = 13–16 weeks). (H) Uptake of 2-deoxyglucose by skeletal muscle, heart and epididymal white adipose tissue (WAT) (♂, n = 7 Plin5+/+, n = 8 Plin5−/−, Age = 13–16 weeks). (I) Muscle (n = 9 Plin5+/+, n = 9 Plin5−/−) and liver (n = 8 Plin5+/+, n = 8 Plin5−/−) glycogen content following hyperinsulinemic euglycemic clamp (♂, Age = 13–16 weeks). *P < 0.05 vs. Plin5+/+. (J) Ceramide and diacylglycerol content in skeletal muscle (♂, n = 8 Plin5+/+, n = 8 Plin5−/−, Age = 13–16 weeks). (K) Ceramide species in Plin5−/− vs. Plin5+/+ myotubes (n = 6 for each group) *P < 0.05 vs. Plin5+/+. (L) Sphingolipids in Plin5−/− vs. Plin5+/+ myotubes (n = 6 for each group) *P < 0.05 vs. Plin5+/+. dhCer, dihydroceramide; Cer, ceramide; MHC, monohexosylceramide; DHC, dihexosylceramide; THC, trihexosylceramide; SM, sphingomyelin. (M) Lipids were assessed by electrospray ionization-tandem mass spectrometry in Plin5−/− vs. Plin5+/+ myotubes (n = 6 for each group). Alkylphosphatidylcholine (PC(O)), lysophosphatidylcholine (LPC), phosphatidylcholine (PC), alkenylphosphatidylcholine (PC(P)), phosphatidylethanolamine (PE), alkylphosphatidylethanolamine (PE(O)), alkenylphosphatidylethanolamine (plasmalogen) (PE(P)), phosphatidylinositol (PI), phosphatidylserine (PS), phosphatidylglycerol (PG), cholesterol ester (CE) and cholesterol (COH). *P < 0.05 vs. Plin5+/+.
Figure 5
Figure 5
Glucose tolerance is maintained, but insulin sensitivity is reduced in association with muscle ceramide accumulation in Plin5−/− mice fed a low-fat diet. (A) Glucose tolerance of Plin5−/− mice and Plin5+/+ littermates (♂, n = 23 Plin5+/+, n = 22 Plin5−/−, Age = 10–17 weeks). (B) Plasma insulin in response to glucose tolerance test (♂, n = 10 Plin5+/+, n = 7 Plin5−/−, Age = 10–17 weeks). (C) Glucose infusion rate during the hyperinsulinemic euglycemic clamp with the steady-state period highlighted in grey shading. (D) Average glucose infusion rate during steady state (♂, n = 10 Plin5+/+, n = 12 Plin5−/−, Age = 13–16 weeks). (E) Hepatic glucose production during hyperinsulinemic euglycemic clamp (♂, n = 10 Plin5+/+, n = 12 Plin5−/−, Age = 13–16 weeks). (F) Expression of gluconeogenic genes G6pc and Pepck (♂, n = 9 Plin5+/+, n = 10 Plin5−/−, Age = 13–16 weeks). (G) Glucose disposal rate during the hyperinsulinemic euglycemic clamp (♂, n = 10 Plin5+/+, n = 12 Plin5−/−, Age = 13–16 weeks). (H) Uptake of 2-deoxyglucose by skeletal muscle, heart and epididymal white adipose tissue (WAT) (♂, n = 7 Plin5+/+, n = 8 Plin5−/−, Age = 13–16 weeks). (I) Muscle (n = 9 Plin5+/+, n = 9 Plin5−/−) and liver (n = 8 Plin5+/+, n = 8 Plin5−/−) glycogen content following hyperinsulinemic euglycemic clamp (♂, Age = 13–16 weeks). *P < 0.05 vs. Plin5+/+. (J) Ceramide and diacylglycerol content in skeletal muscle (♂, n = 8 Plin5+/+, n = 8 Plin5−/−, Age = 13–16 weeks). (K) Ceramide species in Plin5−/− vs. Plin5+/+ myotubes (n = 6 for each group) *P < 0.05 vs. Plin5+/+. (L) Sphingolipids in Plin5−/− vs. Plin5+/+ myotubes (n = 6 for each group) *P < 0.05 vs. Plin5+/+. dhCer, dihydroceramide; Cer, ceramide; MHC, monohexosylceramide; DHC, dihexosylceramide; THC, trihexosylceramide; SM, sphingomyelin. (M) Lipids were assessed by electrospray ionization-tandem mass spectrometry in Plin5−/− vs. Plin5+/+ myotubes (n = 6 for each group). Alkylphosphatidylcholine (PC(O)), lysophosphatidylcholine (LPC), phosphatidylcholine (PC), alkenylphosphatidylcholine (PC(P)), phosphatidylethanolamine (PE), alkylphosphatidylethanolamine (PE(O)), alkenylphosphatidylethanolamine (plasmalogen) (PE(P)), phosphatidylinositol (PI), phosphatidylserine (PS), phosphatidylglycerol (PG), cholesterol ester (CE) and cholesterol (COH). *P < 0.05 vs. Plin5+/+.
Figure 6
Figure 6
Effects of high-fat feeding on substrate metabolism and insulin action in Plin5−/− mice. (A) Body mass (♂, n = 14 Plin5+/+, n = 12 Plin5−/−). (B) Percent body fat mass assessed by DEXA (♂, n = 6 Plin5+/+, n = 10 Plin5−/−, Age = 14–16 weeks). (C) Oxygen consumption (VO2) and (D) respiratory exchange ratio (RER) were assessed by indirect calorimetry (♂, n = 6 Plin5+/+, n = 10 Plin5−/−, Age = 14–16 weeks). (E) Total daily activity (♂, n = 6 Plin5+/+, n = 9 Plin5−/−, Age = 14–16 weeks). (F) Fatty acid oxidation and (G) fatty acid incorporation into triacylglycerol (TAG) (♂, n = 8 Plin5+/+, n = 5 Plin5−/−; Age = 14–16 weeks). (H) Blood glucose in 4 h fasted mice (♂, n = 14 Plin5+/+, n = 16 Plin5−/−; Age = 14–16 weeks). (I) Plasma insulin in 4 h fasted mice (♂, n = 7 Plin5+/+, n = 8 Plin5−/−; Age = 14–16 weeks). (J) Glucose tolerance (♂, n = 13 Plin5+/+, n = 16 Plin5−/−, Age = 14–16 weeks) (K) Total glucose area under the curve (AUC) for low fat diet (LFD) and high fat diet (HFD) from the glucose tolerance test (LFD, ♂, n = 23 Plin5+/+, n = 22 Plin5−/−, Age = 10–17 weeks; HFD, ♂, n = 14 Plin5+/+, n = 16 Plin5−/−, Age = 14–16 weeks). *P < 0.05 vs. all other groups. (L) Plasma insulin in response to glucose tolerance test (♂, n = 7 Plin5+/+, n = 7 Plin5−/−, Age = 14–16 weeks). (M) Rate of insulin-stimulated 3H 2-deoxyglucose disappearance from the blood and (N) rate of insulin-stimulated 3H 2-deoxyglucose (DG) clearance into mixed quadriceps skeletal muscle and white (WAT) adipose tissue (♂, n = 6 Plin5+/+, n = 8 Plin5−/−, Age = 14–16 weeks).

Similar articles

Cited by

References

    1. Kelley D., Mitrakou A., Marsh H., Schwenk F., Benn J., Sonnenberg G. The Journal of Clinical Investigation. 1988;81:1563–1571. - PMC - PubMed
    1. Krssak M., Falk P.K., Dresner A., DiPietro L., Vogel S.M., Rothman D.L. Diabetologia. 1999;42:113–116. - PubMed
    1. Pan D.A., Lillioja S., Kriketos A.D., Milner M.R., Baur L.A., Bogardus C. Diabetes. 1997;46:983–988. - PubMed
    1. Perseghin G., Scifo P., De Cobelli F., Pagliato E., Battezzati A., Arcelloni C. Diabetes. 1999;48:1600–1606. - PubMed
    1. Jacob S., Machann J., Rett K., Brechtel K., Volk A., Renn W. Diabetes. 1999;48:1113–1119. - PubMed

LinkOut - more resources