. 2014 Jul 24:5:298-308.
doi: 10.1016/j.nicl.2014.07.003. eCollection 2014.

Dynamic functional connectivity analysis reveals transient states of dysconnectivity in schizophrenia

Affiliations

Dynamic functional connectivity analysis reveals transient states of dysconnectivity in schizophrenia

E Damaraju et al. Neuroimage Clin. .

Abstract

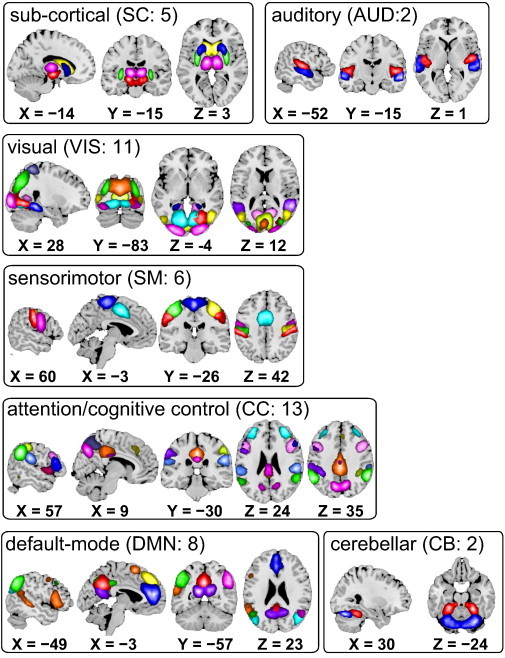
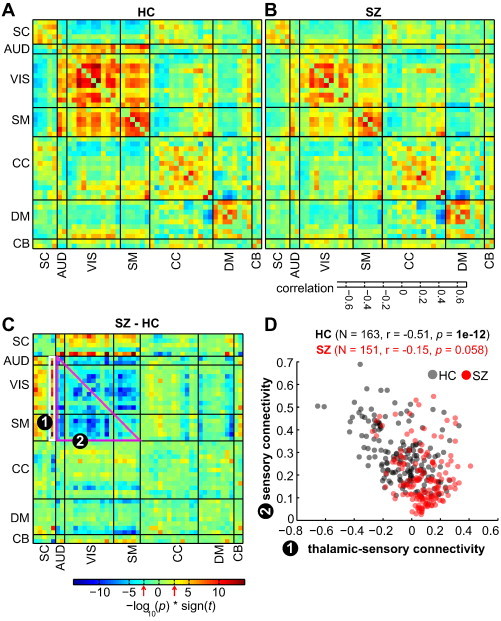
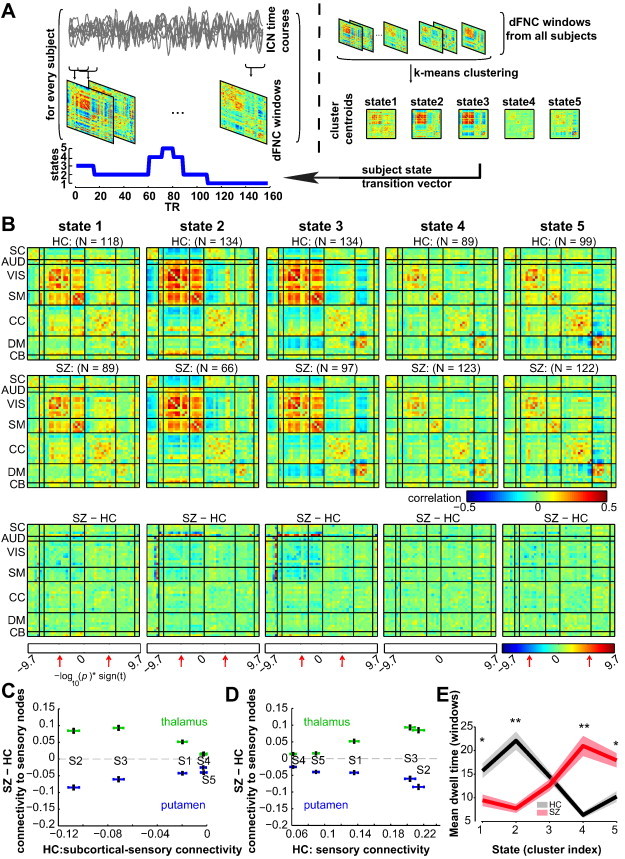
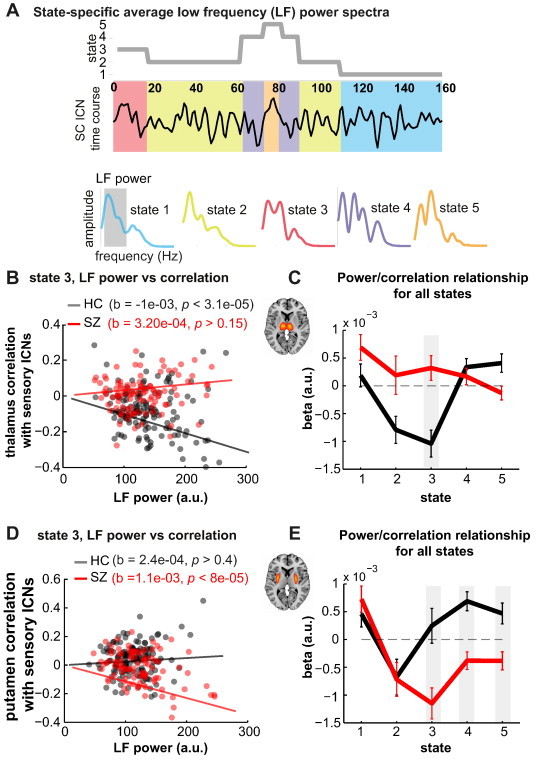
Schizophrenia is a psychotic disorder characterized by functional dysconnectivity or abnormal integration between distant brain regions. Recent functional imaging studies have implicated large-scale thalamo-cortical connectivity as being disrupted in patients. However, observed connectivity differences in schizophrenia have been inconsistent between studies, with reports of hyperconnectivity and hypoconnectivity between the same brain regions. Using resting state eyes-closed functional imaging and independent component analysis on a multi-site data that included 151 schizophrenia patients and 163 age- and gender matched healthy controls, we decomposed the functional brain data into 100 components and identified 47 as functionally relevant intrinsic connectivity networks. We subsequently evaluated group differences in functional network connectivity, both in a static sense, computed as the pairwise Pearson correlations between the full network time courses (5.4 minutes in length), and a dynamic sense, computed using sliding windows (44 s in length) and k-means clustering to characterize five discrete functional connectivity states. Static connectivity analysis revealed that compared to healthy controls, patients show significantly stronger connectivity, i.e., hyperconnectivity, between the thalamus and sensory networks (auditory, motor and visual), as well as reduced connectivity (hypoconnectivity) between sensory networks from all modalities. Dynamic analysis suggests that (1), on average, schizophrenia patients spend much less time than healthy controls in states typified by strong, large-scale connectivity, and (2), that abnormal connectivity patterns are more pronounced during these connectivity states. In particular, states exhibiting cortical-subcortical antagonism (anti-correlations) and strong positive connectivity between sensory networks are those that show the group differences of thalamic hyperconnectivity and sensory hypoconnectivity. Group differences are weak or absent during other connectivity states. Dynamic analysis also revealed hypoconnectivity between the putamen and sensory networks during the same states of thalamic hyperconnectivity; notably, this finding cannot be observed in the static connectivity analysis. Finally, in post-hoc analyses we observed that the relationships between sub-cortical low frequency power and connectivity with sensory networks is altered in patients, suggesting different functional interactions between sub-cortical nuclei and sensorimotor cortex during specific connectivity states. While important differences between patients with schizophrenia and healthy controls have been identified, one should interpret the results with caution given the history of medication in patients. Taken together, our results support and expand current knowledge regarding dysconnectivity in schizophrenia, and strongly advocate the use of dynamic analyses to better account for and understand functional connectivity differences.


Figures

Fig. 1
Fig. 1
Composite maps of the 47 identified intrinsic connectivity networks (ICNs), sorted into seven subcategories. Each color in the composite maps corresponds to a different ICN. Component labels and peak coordinates are provided in Table 1.
Fig. 2
Fig. 2
(A–B) Mean static functional network connectivity (sFNC) map for healthy controls (A) and patients with schizophrenia (B) after correcting for age, gender and meanFD. Thick black lines partition the FNC maps into the seven subcategories depicted in Fig. 1. The seven subcategories into which the ICNs are partitioned into are: sub-cortical (SC), auditory (AUD), visual (VIS), sensorimotor (SM), cognitive control (CC) and attention, default-mode network (DMN), and cerebellar (CB) components. C) The group difference (SZ–HC) in sFNC. Values are plotted as −log10(p-value) × sign(t-statistic), where statistics are obtained from the diagnosis term in univariate multiple regression models (see SI methods). The FDR threshold (q < 0.05) is depicted on the color bar with red arrows. D) Covariation between thalamic-sensory (AUD, VIS, SM) connectivity and sensory connectivity. Thalamic-sensory connectivity is defined as the average correlation between the thalamic network and all AUD, VIS and SM networks (average of cells within white rectangle labeled (1)); sensory connectivity is defined as the average correlation between all AUD, VIS, and SM ICNs (average of cells within magenta rectangle labeled (2)). Correlation between thalamic-sensory connectivity and sensory connectivity is more pronounced in HC (black circles) compared to SZ (red circles).
Fig. 3
Fig. 3
A) Schematic depicting the computation of the state transition vector for each subject. First, dFNC matrices are computed on windowed portions of the ICN time courses. Then, dFNC matrices from all subjects are clustered using the k-means algorithm, yielding cluster centroids and cluster membership assignment for all windows. When viewed in time, the window membership represents the state transition vector. B) The medians of cluster centroids by state for HC (top) and SZ (middle) along with the count of subjects that had at least one window in each state are shown. The bottom row shows the results of two sample t-test results performed across subject median dFNC maps by state, with the FDR threshold (q < 0.05) indicated by red arrows. (C–D) Illustration of the dependence of group differences on connectivity states/patterns. In (C), the group difference (SZ–HC) in thalamic-sensory connectivity, and putamen–sensory connectivity are plotted as a function of subcortical-sensory antagonism (average of cells within subcortical to sensory nodes) found in each state averaged over HC. In (D), the same group differences are displayed as a function of sensory connectivity. The error bars in (C–D) are obtained using bootstrap resampling. E) The mean ± standard error of dwell times by state for HC (black) and SZ (red). Asterisks indicate p < 0.05 (FDR corrected) and double asterisks indicate p < 0.001 (FDR corrected), as obtained via two-sample t-tests.
Fig. 4
Fig. 4
A) Schematic depicting the computation of state-specific average low frequency (LF) power spectra. A power spectrum is computed for each window (22 TRs) of an ICN time course and the spectra corresponding to the same state (obtained from subject state transition vector) are averaged together to obtain the power spectrum for that state and ICN. LF power is defined as the area under the curve in the low frequency range (0.023–0.08 Hz). B) Scatter plot showing the relationship between thalamic LF power from state 3 and state 3 thalamic-sensory connectivity for HC (black circles) and SZ (red circles). Robust fit least square regression lines are also plotted. C) Slopes estimating the linear relationship between thalamic LF power and thalamic-sensory connectivity for all states. Shaded gray area denotes a significant difference in slopes between groups (p < 0.05, FDR corrected). D) and E) show the same relationships for putamen LF power and putamen–sensory connectivity.

References

    1. Allen E.A., Damaraju E., Plis S.M., Erhardt E.B., Eichele T., Calhoun V.D. Tracking whole-brain connectivity dynamics in the resting state. Cerebral Cortex. 2012;24(3):663–676. - PMC - PubMed
    1. Allen E.A., Eichele T., Wu L., Calhoun V.D. EEG Signature of Functional Connectivity States. Organization of Human Brain Mapping; Seattle: 2013.
    1. Allen E.A., Erhardt E.B., Damaraju E., Gruner W., Segall J.M., Silva R.F., Havlicek M., Rachakonda S., Fries J., Kalyanam R., Michael A.M., Caprihan A., Turner J.A., Eichele T., Adelsheim S., Bryan A.D., Bustillo J., Clark V.P., Feldstein Ewing S.W., Filbey F., Ford C.C., Hutchison K., Jung R.E., Kiehl K.A., Kodituwakku P., Komesu Y.M., Mayer A.R., Pearlson G.D., Phillips J.P., Sadek J.R., Stevens M., Teuscher U., Thoma R.J., Calhoun V.D. A baseline for the multivariate comparison of resting-state networks. Frontiers in Systems Neuroscience. 2011 - PMC - PubMed
    1. Bell A.J., Sejnowski T.J. An information-maximization approach to blind separation and blind deconvolution. Neural Computation. 1995;7:1129–1159. 7584893 - PubMed
    1. Anticevic A., Cole M.W., Repovs G., Murray J.D., Brumbaugh M.S., Winkler A.M., Savic A., Krystal J.H., Pearlson G.D., Glahn D.C. Characterizing thalamo-cortical disturbances in schizophrenia and bipolar illness. Cerebral Cortex. 2013 - PMC - PubMed