. 2014 Aug 12:4:202.
doi: 10.3389/fonc.2014.00202. eCollection 2014.

Ultra-High Density SNParray in Neuroblastoma Molecular Diagnostics

Affiliations

Ultra-High Density SNParray in Neuroblastoma Molecular Diagnostics

Inge M Ambros et al. Front Oncol. .

Abstract

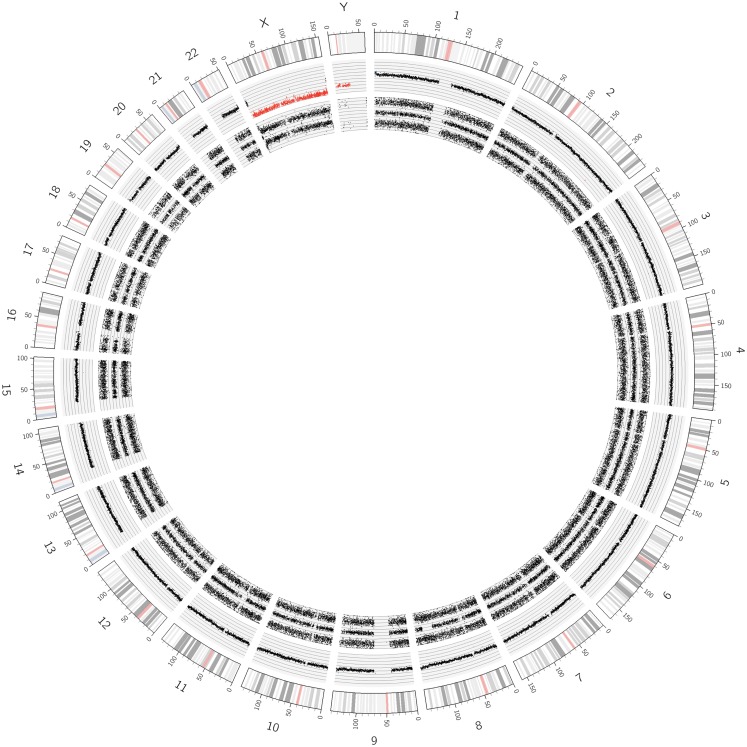
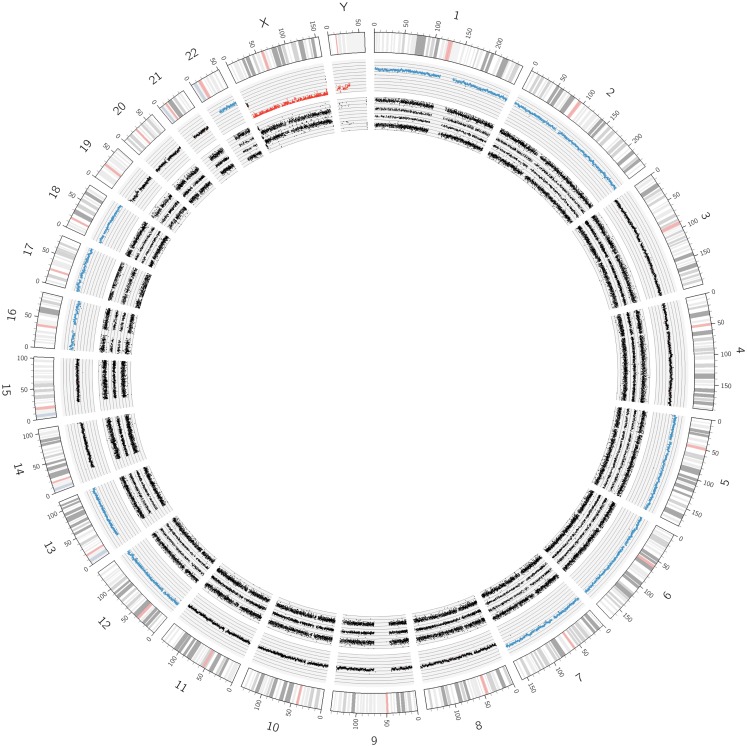
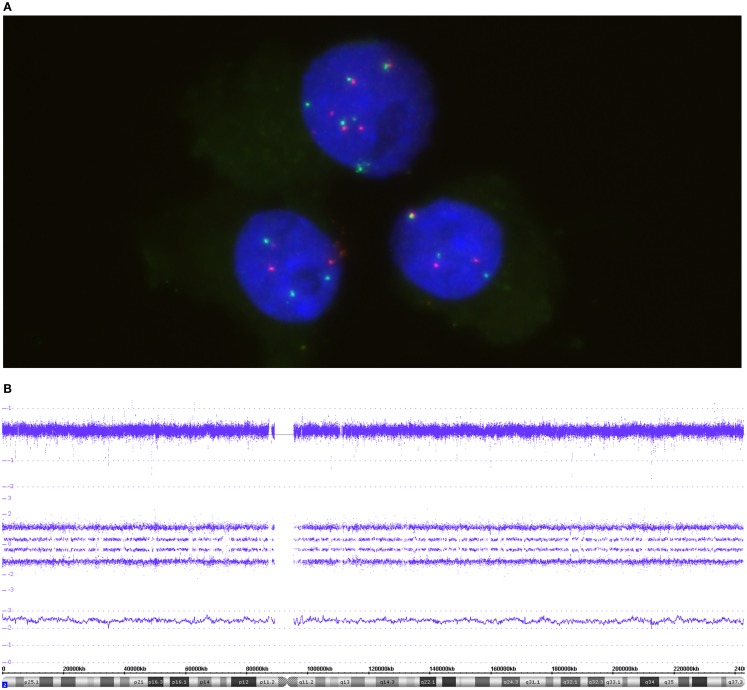
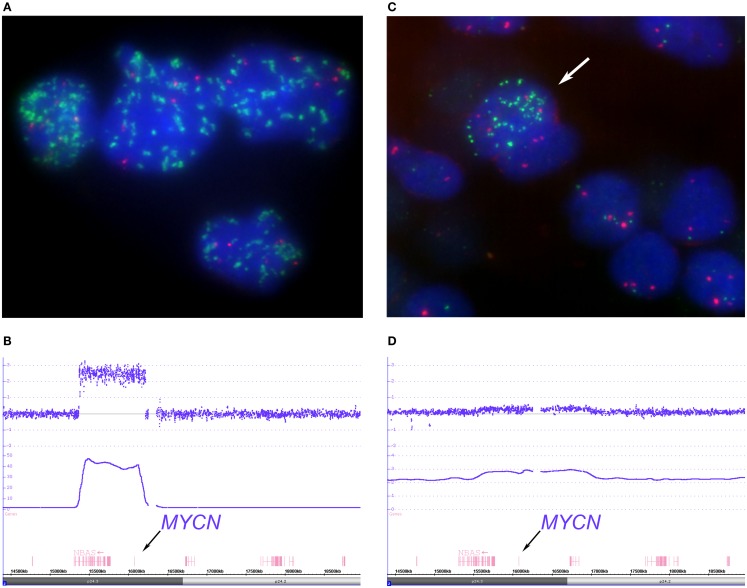
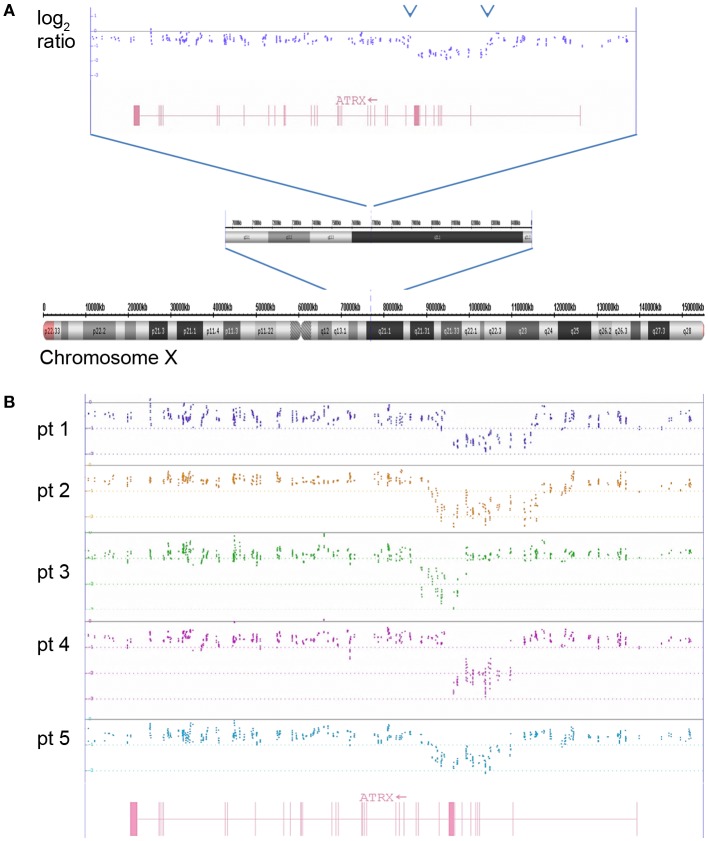
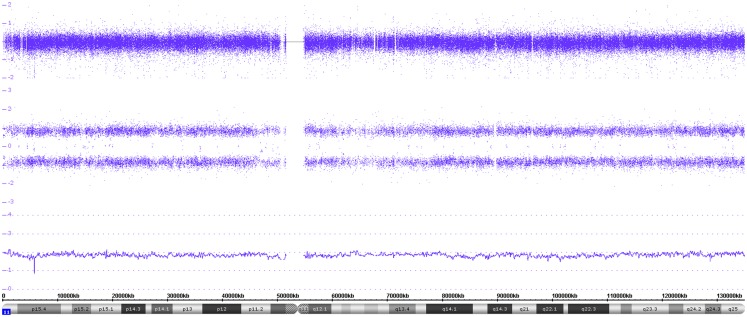
Neuroblastoma serves as a paradigm for applying tumor genomic data for determining patient prognosis and thus for treatment allocation. MYCN status, i.e., amplified vs. non-amplified, was one of the very first biomarkers in oncology to discriminate aggressive from less aggressive or even favorable clinical courses of neuroblastoma. However, MYCN amplification is by far not the only genetic change associated with unfavorable clinical courses. So called "segmental chromosomal aberrations," (SCAs) i.e., gains or losses of chromosomal fragments, can also indicate tumor aggressiveness. The clinical use of these genomic aberrations has, however, been hampered for many years by methodical and interpretational problems. Only after reaching worldwide consensus on markers, methodology, and data interpretation, information on SCAs has recently been implemented in clinical studies. Now, a number of collaborative studies within COG, GPOH, and SIOPEN use genomic information to stratify therapy for patients with localized and metastatic disease. Recently, new types of DNA based aberrations influencing the clinical behavior of neuroblastomas have been described. Deletions or mutations of genes like ATRX and a phenomenon referred to as "chromothripsis" are all assumed to correlate with an unfavorable clinical behavior. However, these genomic aberrations need to be scrutinized in larger studies applying the most appropriate techniques. Single nucleotide polymorphism arrays have proven successful in deciphering genomic aberrations of cancer cells; these techniques, however, are usually not applied in the daily routine. Here, we present an ultra-high density (UHD) SNParray technique which is, because of its high specificity and sensitivity and the combined copy number and allele information, highly appropriate for the genomic diagnosis of neuroblastoma and other malignancies.

Keywords: INRG; SNParray; amplification; chromothripsis; genetic risk factors; genomic; neuroblastoma; precision medicine.


Figures

Figure 1
Figure 1
Circos plot showing the normal chromosomal complement from a Schwann cell dominant tumor. The outer ring indicates the chromosome ideograms and distances in Mb. The next ring indicates the copy number information. All autosomes are disomic (black dots), the X and Y chromosomes are present in one copy each (red dots). The innermost ring represents the allele peak frequency of the chromosomes. All autosomes disclose three allele peak tracks whereas the X and Y chromosomes show only two tracks; exception: the pseudo-autosomal regions on the tips of the X chromosome, which have three allele tracks.
Figure 2
Figure 2
Circos plot of a near-triploid neuroblastoma. Chromosomes 1, 2, 5, 6, 7, 12, 13, 16, 18, and 22 are trisomic, represented by the blue dots in the copy number track and four tracks each for the allele peaks. Note that chromosome 17, despite showing three allele peak tracks, is not disomic but tetrasomic, as can be seen by the blue copy number dots. All other autosomes are disomic.
Figure 3
Figure 3
The FISH picture in (A) highlights three nuclei co-hybridized with MYCN and 2p specific probes. Both probes, MYCN (green) and the reference probe (red), are present in a balanced manner – either 3 pairs or 6 pairs in the upper cell. (B) The SNP array profile for chromosome 2. Copy number probe intensities (log2 ratio) are represented in the upper track. The four allele peak tracks in the middle indicate a trisomic situation due to the allele distribution AAA, AAB, ABB, and BBB. The smooth signal above the ideogram is between 2 and 3 because of difficulties in base line adjustment in cases of triploid tumors.
Figure 4
Figure 4
Depicts examples of homogenous “classical” and heterogeneous MYCN amplified tumors. The FISH picture, (A) (MYCN FISH probe in green, 2p probe in red), shows tumor cell nuclei with a varying number of MYCN signals ranging from approximately 30 signals up to hundreds distributed randomly within the nuclei. The large size of some of the MYCN hybridization spots can be explained by repeated amplicon units. The SNParray profile of a segment of the short arm of chromosome 2 from a homogeneously amplified neuroblastoma is given in (B) which shows a clear peak for the MYCN locus (copy number ~48). (C,D) Examples of a so called hetMNA tumor. In the I-FISH picture (C), one tumor cell nucleus clearly displays MYCN amplification (arrow), while the others do have a balanced number of MYCN and reference probe hybridization signals. The SNParray profile (D) shows an example of a heterogeneous MYCN amplified tumor with much lower peaks (copy number < 3 of the smooth signals, lower line) than compared to the profile given in (B) and could easily be missed if the number of tumor cell nuclei with MYCN amplification is too small in the sample under examination.
Figure 5
Figure 5
The copy number data disclose a high number of amplicons on the long arm of chromosome 12. The log2 copy number track and the smooth signal track show a number of copy number peaks ranging from ~10 to ~42 copies. The different amplicons contain the following genes MDM2, MDM1, CDK4, DCD, INHBC, GLI1, OS9, METTL1, RSSFJ, GNS, MSRB3, and IL26 besides a number of other ones.
Figure 6
Figure 6
A Circos plot of chromosome 11q deleted neuroblastoma. The red track in the log2 copy number lane already indicates the loss of genomic material. The two allele peak tracks indicate LOH. In addition, the short arms of chromosomes 3 and 4 and the long arm of chromosome 16 show deletions accompanied by LOHes. The chromosome 9 shows a whole chromosome UPD and a 9p21.3 loss resulting in a nullisomy for the genes CDKN2A and 2B. Further segmental aberrations were found on chromosomes 14 and 17. A whole chromosome gain was found for chromosome 7.
Figure 7
Figure 7
An example of the recently described “chromothripsis.” As visualized by the Circos plot, only chromosome 2 but no other chromosome showed structural aberrations. However, the concerned chromosome underwent extreme shattering and reshuffling, as detailed in Figure 8.
Figure 8
Figure 8
A detailed view of the genomic features of the chromothripsis case described in Figure 7. The chromothripsis with 60 breakpoints lying in both chromosomal arms (chromosome 2) lead to a large number of copy number variations represented in an oscillating copy number profile (visible in all tracks). In addition, the profile shows two amplicons including MYCN and ALK besides other genes (highlighted by asterisks).
Figure 9
Figure 9
The log2 copy number plot displays the structural variations in the ATRX gene. (A) Complete chromosome X with small deletion at Xq21.1 visible in the zoomed-in chromosomal sub-band. The dots indicate the log2 copy values of individual copy number probes. The intron–exon structure of ATRX is shown in red (vertical bars are exons). (B) Five examples of ATRX deletions spanning different parts of the gene are depicted (log2 ratio from five neuroblastomas are shown in different colors analyzed with the ChAS software).
Figure 10
Figure 10
Gives an example of a whole chromosome uniparental isodisomy. Both the log2 copy values and the smooth signal indicate two copies of chromosome 11. However, only two allele peak tracks are visible representing the AA and BB alleles.

References

    1. Evans AE, Gerson J, Schnaufer L. Spontaneous regression of neuroblastoma. Natl Cancer Inst Monogr (1976) 44:49–54 - PubMed
    1. D’Angio GJ, Evans AE, Koop CE. Special pattern of widespread neuroblastoma with a favourable prognosis. Lancet (1971) 1(7708):1046–910.1016/S0140-6736(71)91606-0 - DOI - PubMed
    1. Brodeur GM. Neuroblastoma: biological insights into a clinical enigma. Nat Rev Cancer (2003) 3(3):203–1610.1038/nrc1014 - DOI - PubMed
    1. Maris JM, Hogarty MD, Bagatell R, Cohn SL. Neuroblastoma. Lancet (2007) 369(9579):2106–2010.1016/S0140-6736(07)60983-0 - DOI - PubMed
    1. Cohn SL, Pearson AD, London WB, Monclair T, Ambros PF, Brodeur GM, et al. The International Neuroblastoma Risk Group (INRG) classification system: an INRG Task Force report. J Clin Oncol (2009) 27(2):289–9710.1200/JCO.2008.16.6785 - DOI - PMC - PubMed

LinkOut - more resources