. 2014 Sep 11;513(7517):189-94.
doi: 10.1038/nature13724. Epub 2014 Aug 27.

A synaptic and circuit basis for corollary discharge in the auditory cortex

Affiliations

A synaptic and circuit basis for corollary discharge in the auditory cortex

David M Schneider et al. Nature. .

Abstract

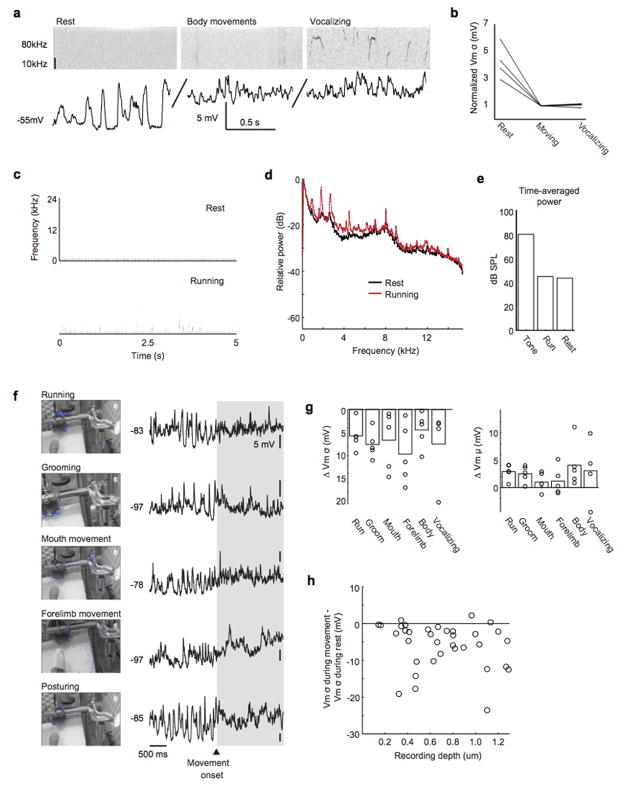
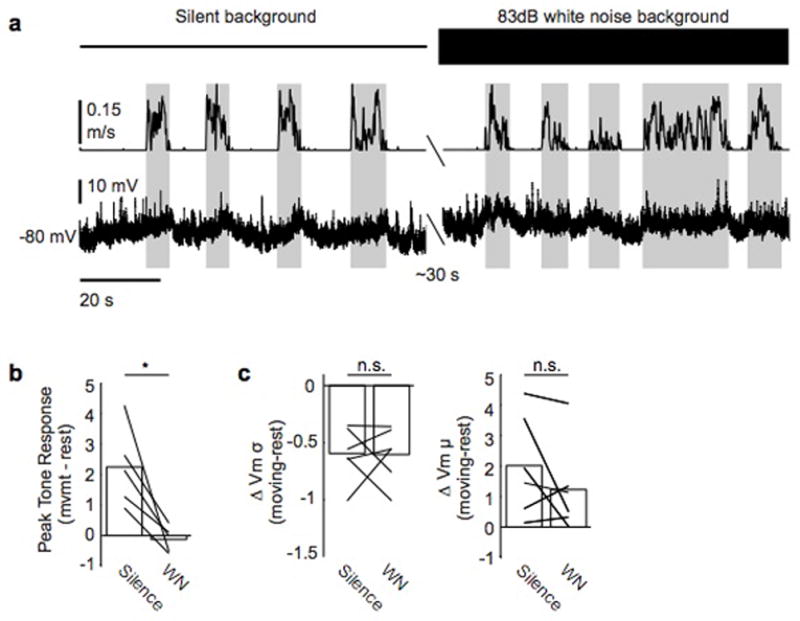
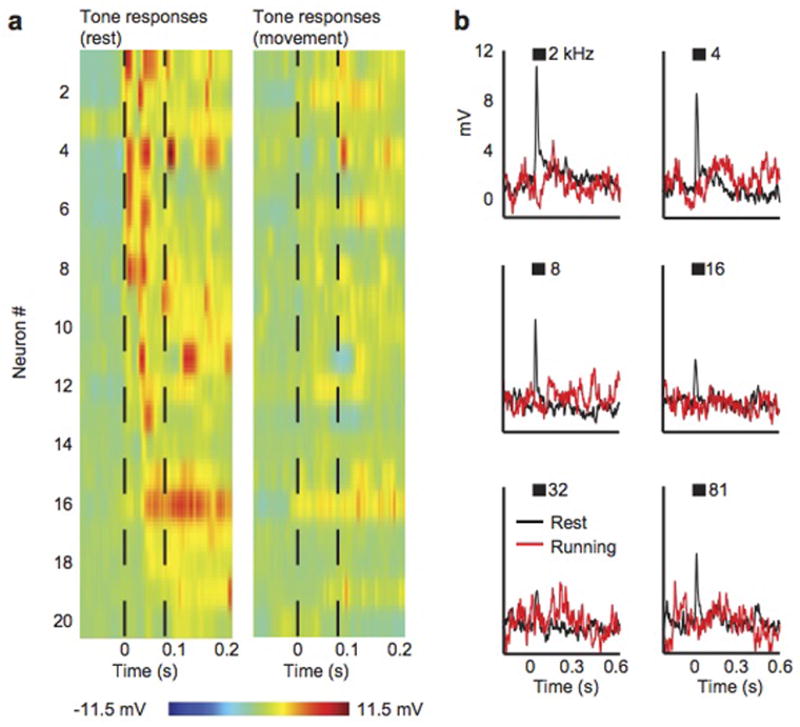
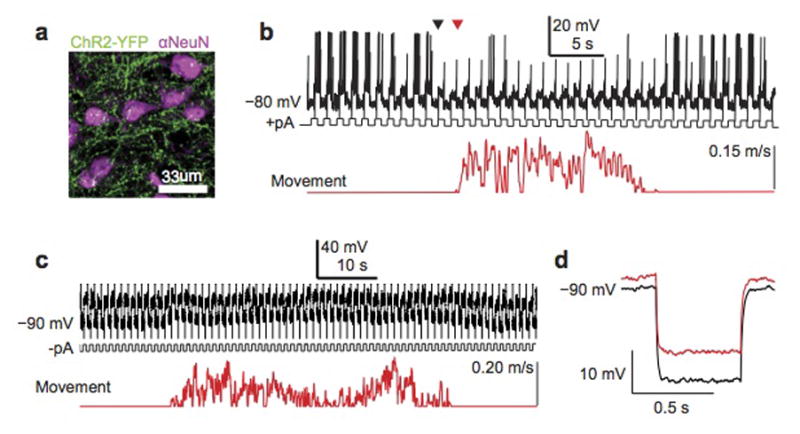
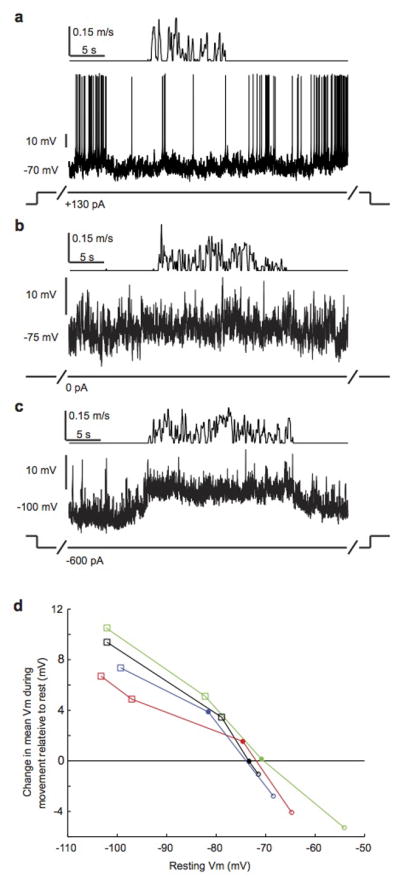
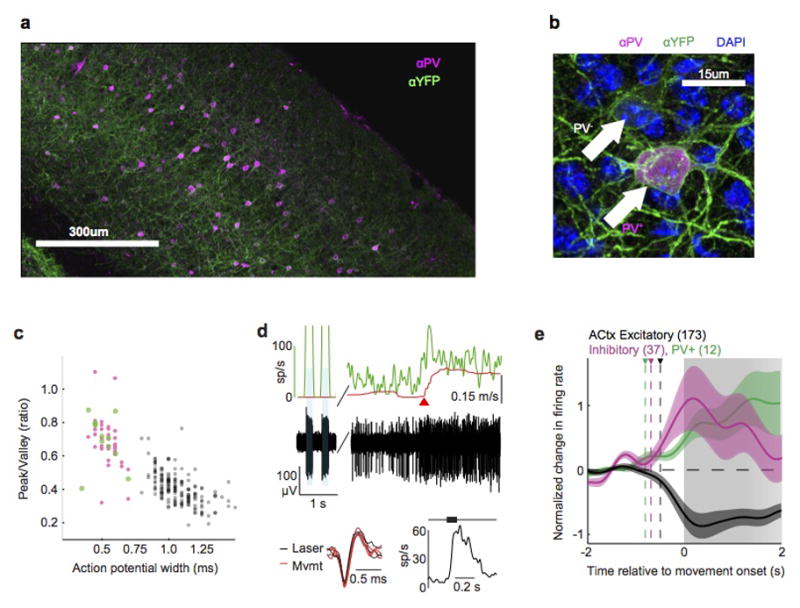
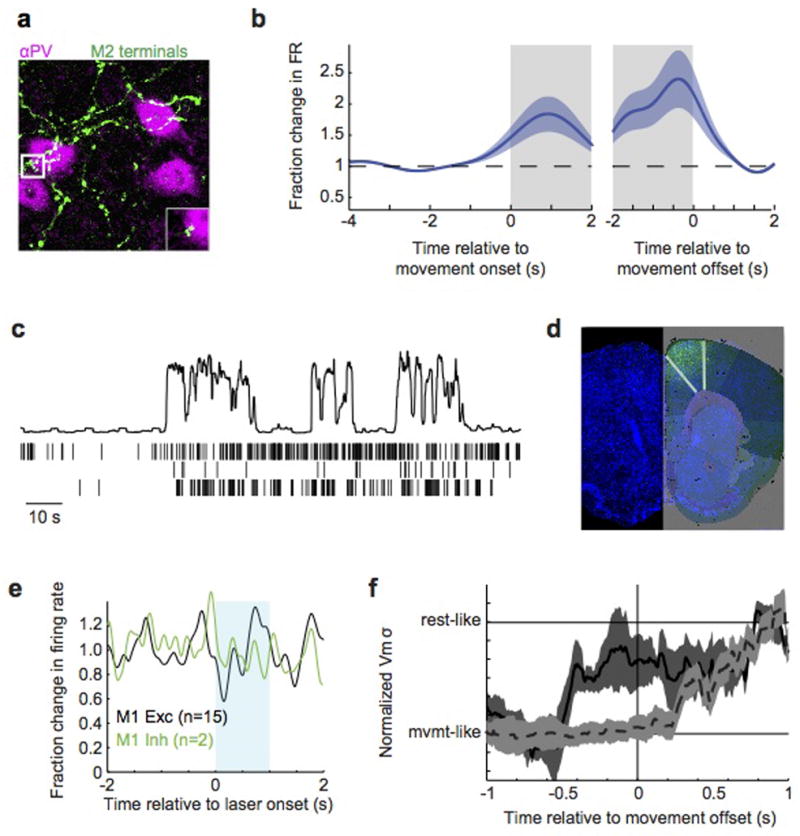
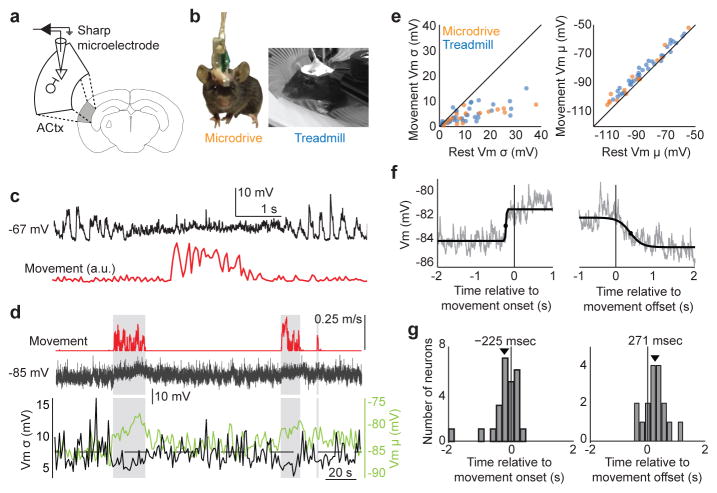
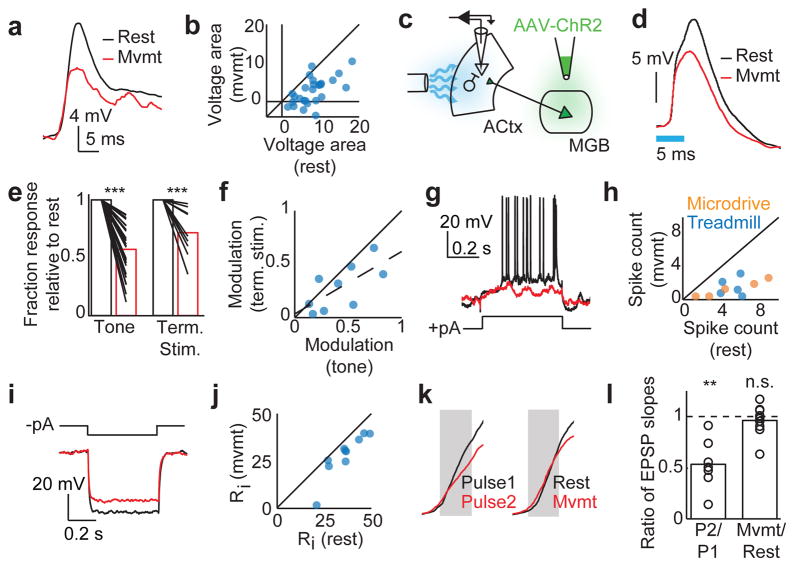
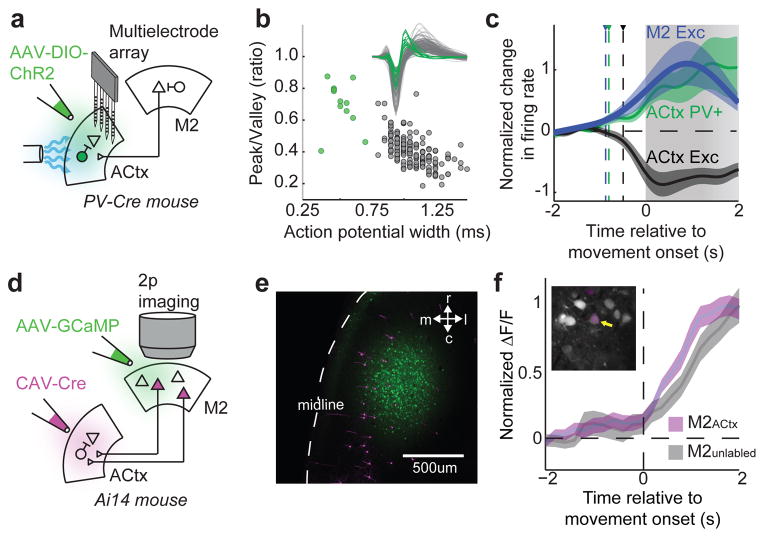
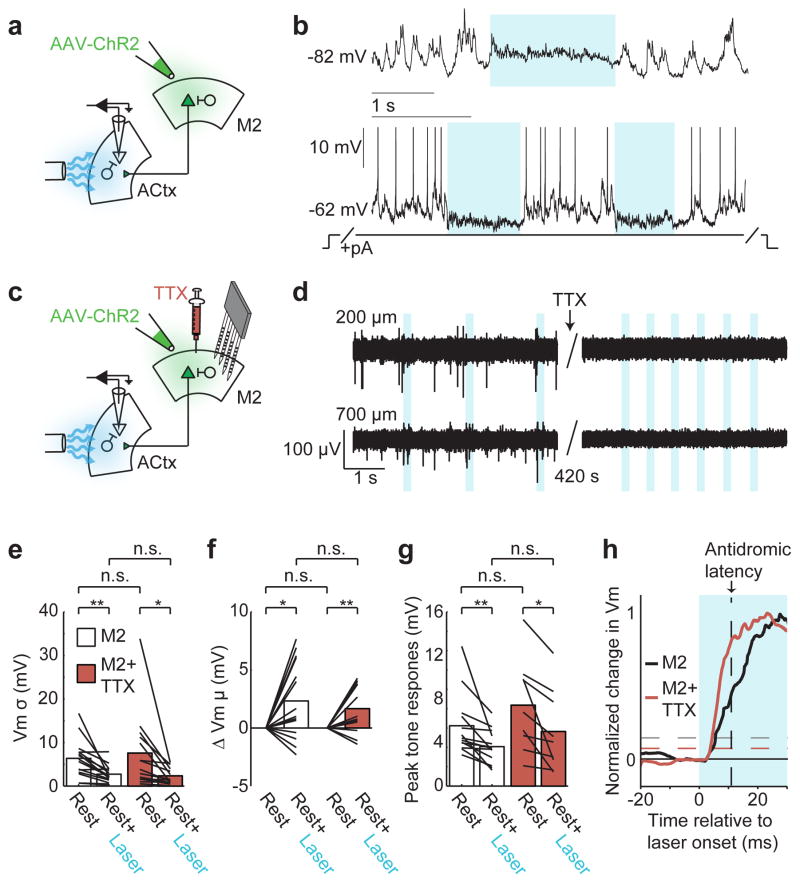
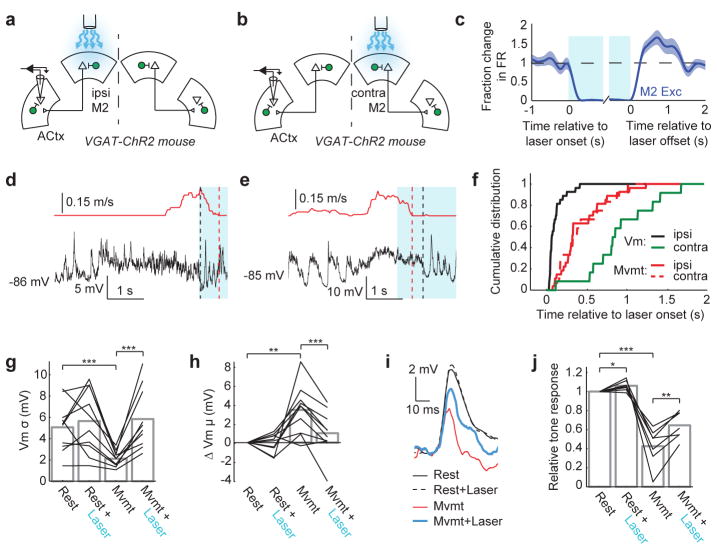
Sensory regions of the brain integrate environmental cues with copies of motor-related signals important for imminent and ongoing movements. In mammals, signals propagating from the motor cortex to the auditory cortex are thought to have a critical role in normal hearing and behaviour, yet the synaptic and circuit mechanisms by which these motor-related signals influence auditory cortical activity remain poorly understood. Using in vivo intracellular recordings in behaving mice, we find that excitatory neurons in the auditory cortex are suppressed before and during movement, owing in part to increased activity of local parvalbumin-positive interneurons. Electrophysiology and optogenetic gain- and loss-of-function experiments reveal that motor-related changes in auditory cortical dynamics are driven by a subset of neurons in the secondary motor cortex that innervate the auditory cortex and are active during movement. These findings provide a synaptic and circuit basis for the motor-related corollary discharge hypothesized to facilitate hearing and auditory-guided behaviours.


Conflict of interest statement

Competing financial interests

The authors declare no competing financial interests.
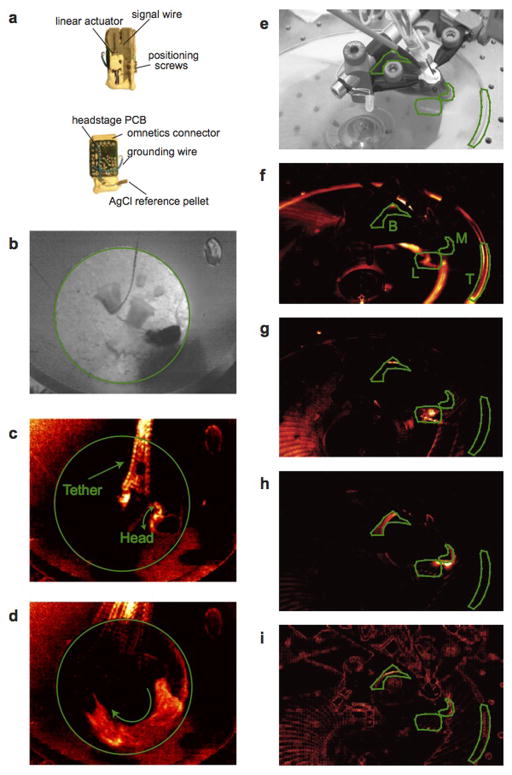
Figures

Extended Data Figure 1
Extended Data Figure 1. Analysis of behavior in unrestrained and head-fixed mice
a, The miniature-motorized microdrive used for making intracellular recordings from unrestrained mice. b, Video still of unrestrained mouse in a circular arena during microdrive recording. Green circle indicates full-field ROI that was used for semi-automated movement detection. c, Changes in pixel intensity over time were measured to detect movements and the heat map shows the average change in pixel intensity across frames for a 2-second clip. Image in c shows a back-and-forth head movement as indicated by green arrows. d, As in c, but for translocation in the direction indicated by the green arrow. e, Video still of head-restrained mouse positioned on a circular treadmill. Green polygons show regions of interest for the treadmill (T), body (B), forelimb (L) and facial (M), with labels shown in f. f–i, Heat maps showing average movement for 2-second video clips during running (f), forelimb movements (g), grooming (h) and facial movements (i).
Extended Data Figure 2
Extended Data Figure 2. Motor-related dynamics across a variety of behaviors
a, Top shows spectrogram of sound recorded during microdrive experiment, bottom is simultaneous current clamp recording from auditory cortical excitatory neuron. Left panel shows rest, middle panel shows movement, and right panel shows vocalization. b, Normalized membrane potential variance during rest, body movements, and vocalizations. c, Spectrograms of head-fixed mouse on treadmill during 5-second periods of rest (top) and running (bottom). d, Power spectra of sound measured during rest and running. The power spectra are indistinguishable at frequencies greater than 12 kHz. e, Mean RMS power (in dB SPL) of tone playback (80 dB), running (43 dB) and rest (42 dB). f, Left panels show static images of head-fixed mouse with heat maps indicating regions of movement during the movement epochs shown at right. Right panels show current clamp recordings during the movements depicted on the left. g, Change in membrane potential variance (left) and mean (right) for 5 examples of unique movements and 4 examples of vocalization. h, Change in variance as a function of recording depth.
Extended Data Figure 3
Extended Data Figure 3. Motor-related dynamics persist in broadband masking noise
a, Example neuron recorded during movement and rest and during periods of silence (left) and 83 dB white noise playback (right). Top panel shows ambient environment, middle panel shows treadmill velocity, and bottom panel shows membrane potential. b, White noise masking abolishes tone-evoked responses. c, Masking does not alter changes in membrane potential variance or mean exhibited during movement.
Extended Data Figure 4
Extended Data Figure 4. Tone-evoked responses are suppressed during movement
a, Tone-evoked synaptic responses from 20 auditory cortical excitatory neurons during rest (left) and during movement (right). Black dashed lines show tone onset and offset. The tone presented to each neuron was chosen to evoke the largest response. b, Mean synaptic responses from a single neuron to multiple presentations of tones presented at multiple frequencies. Black shows response during rest, red shows response during movement. Black bars indicate duration of tone.
Extended Data Figure 5
Extended Data Figure 5. Excitability and input resistance decrease during movement
a, Confocal micrograph of ChR2+ thalamocortical terminals (green) amidst neurons immunostained for NeuN (magenta). b, Top panel shows spiking response of an auditory cortical excitatory neuron recorded in treadmill preparation to positive current pulses injected with the recording electrode. Bottom trace shows treadmill movement. The onset of motor-related changes in excitability (black triangle) precedes movement onset (red triangle) c, Top panel shows membrane potential response of an auditory cortical excitatory neuron to negative current pulses injected with the recording pipette. Bottom trace shows treadmill movement. d, Average hyperpolarizing response to negative current pulses injected during rest (black) and during movement (red).
Extended Data Figure 6
Extended Data Figure 6. Estimating the reversal potential of motor-related currents
a, Auditory cortical excitatory neuron recorded with treadmill preparation as mouse transitions from rest to movement and back to rest. Top panel shows treadmill movement. Prior to and throughout movement, neuron was depolarized with positive current injection with recording pipette. b, Same neuron as a, but with no current injection. c, Same neuron as a, but with hyperpolarizing current injection. d, Change in mean membrane potential during movement relative to rest as a function of the membrane potential prior to movement for 4 neurons. Filled circles indicate movements without current injection. Open circles show movements with depolarizing current injection. Open squares show movements with hyperpolarizing current injection. Movement-related modulation of mean membrane potential switches from depolarizing to hyperpolarizing when the resting membrane potential exceeds ~−72 mV.
Extended Data Figure 7
Extended Data Figure 7. Inhibitory activity increases during movement
a, Composite micrograph of a coronal slice of auditory cortex from a VGAT-ChR2-YFP mouse, immunostained for YFP (green) and parvalbumin (PV, magenta). b, High magnification image of a section from a, showing both PV+ (magenta) and PV− interneurons expressing ChR2 (green). c, Scatter plot showing action potential width and peak-to-valley ratio for all identified PV+ interneurons (green), identified VGAT+ interneurons, and putative excitatory neurons (gray) in the auditory cortex. d, Identified PV+ interneuron recorded from PV-ChR2 mouse. Top panel shows treadmill velocity (red), instantaneous firing rate (green) and raw voltage trace (black) recorded during laser stimulation (blue shaded regions), rest and locomotion. Instantaneous firing rate during laser stimulation was truncated and reaches a maximum of 500 spikes/s. Red triangle indicates time of movement onset. Bottom left shows overlaid action potential waveforms produced during laser stimulation (black, n=3) and locomotion (red, n=3). Bottom right shows average sound-evoked response to tone presented at neuron’s preferred frequency. e. Normalized change in firing rate aligned to movement onset for PV+ neurons (green), VGAT+ interneurons (pink) and putative excitatory neurons (gray).
Extended Data Figure 8
Extended Data Figure 8. M2 activity drives motor-related changes in auditory cortical dynamics
a, Z-stack micrograph of M2 axons (green, AAV-GFP injection) forming appositions with PV+ immunostained interneurons in auditory cortex (magenta). Inset shows a high magnification single (2um) optical section of an apposition. b, M2 spiking activity relative to movement onset (left) and offset (right), normalized to pre-movement activity. c, Three simultaneously recorded M2 neurons during three transitions from rest to movement. Top panel shows movement extracted from video (a.u.). d, Cell bodies and local terminal field of ChR2+ neurons following injection of AAV.2/1.ChR2 into M2. Image is overlaid with an atlas from the Allen Brain Institute. e, Extracellular recordings in M1 of VGAT-ChR2 mouse during blue laser stimulation over ipsilateral M2 showing no change in firing of neurons with broad (black, putative excitatory) or narrow (green, putative inhibitory) neurons. f, Change in membrane potential variance of auditory cortical excitatory neurons over time during optogenetic silencing of either ipsilateral (black, solid) or contralateral (gray, dashed) M2. For each neuron, the time-varying membrane potential variance was measured during a sliding window that extended 500 ms into the past. Traces were then averaged across neurons after aligning each to the time of movement cessation. Silencing ipsilateral M2 causes membrane potential variance to change prior to movement offset, whereas silencing contralateral M2 causes the variance to change after movement offset.
Figure 1
Figure 1. Movement modulates membrane potential dynamics of auditory cortical neurons
a, Schematic showing sharp microelectrode current-clamp recordings from auditory cortical excitatory neuron in the behaving mouse. b, Video stills showing mouse with intracellular microdrive (left) and head-fixed mouse on treadmill (right). c, Membrane potential (top) of an auditory cortical neuron in an unrestrained mouse during rest and a brief movement (bottom). d, Membrane potential (middle) of an auditory cortical neuron in a head-restrained mouse during rest and long bouts of locomotion on a treadmill (top). The bottom panel depicts the variance and mean of membrane potential across time. e, Membrane potential variance and mean during rest versus movement (n = 16/37 cells for microdrive/treadmill, p < 0.001 for variance and mean, Paired t-test). f, Membrane potential of an example neuron relative to movement onset and offset, averaged across 20 movements. Black lines show sigmoidal fit and the black dots show half rise/fall times. g, Histogram of the lag between membrane depolarization and movement onset (left, p = 0.06, t-test) and membrane hyperpolarization and movement offset (right, p = 0.01, t-test). Black arrows indicate population means (n = 25 cells, t-test). Statistical details in Methods.
Figure 2
Figure 2. Auditory cortical excitatory neurons are suppressed during movement
a, An example neuron’s response to a preferred tone during rest (black) and movement (red). b, The voltage area response of multiple neurons to preferred tone stimulus during rest versus movement (n = 27, p < 0.001, Paired t-test). c, Schematic showing viral infection of AAV-ChR2 into MGB and optogenetic activation of ChR2+ axon terminals in the auditory cortex. d, Responses of an example neuron to optogenetic stimulation of thalamocortical terminals during rest (black) and movement (red). Blue bar indicates duration of light stimulation. e, Normalized responses to preferred tone stimulus (left, n = 27, t-test) and thalamocortical terminal stimulation (right, n = 9, t-test) during rest (black bars) and movement (red bars). f, Modulation of tone-evoked versus thalamocortical terminal stimulation. Modulation was defined as (1 − Rmvmt/Rrest), where Rmvmt and Rrest were the peak response during movement and rest, respectively. Dashed line shows the linear regression (n = 9, r = 0.69). g, Evoked response of an example neuron to intracellular positive current injection during rest (black) and movement (red). h, Number of spikes evoked by positive current injection during rest versus movement (n = 5/5 for microdrive/treadmill, p < 0.001, Paired t-test). i, Evoked voltage response of an example neuron to intracellular negative current injection during rest (black) and movement (red). j, Input resistance (Ri) during rest versus movement (n = 10, p < 0.001, Paired t-test). k, Initial phase of the EPSP evoked by optogenetic stimulation of thalamic terminals in the auditory cortex. Left panel shows the responses to two simultaneous pulses delivered 50 ms apart. Right panel shows the responses to pulses delivered during rest and movement. l, Ratio of the EPSP slopes measured during paired-pulse stimulation (n = 7, t-test) and during movement vs. rest (n = 9, t-test). **P<0.01, ***P<0.001. Statistical details in Methods.
Figure 3
Figure 3. Auditory cortical PV+ interneurons and M2ACtx neurons are active during movement
a, Schematic showing viral infection of PV-Cre mice with a Cre-dependent ChR2 construct. b, Width and peak-to-valley ratio of action potentials of excitatory (black, n = 173) and PV+ (green, n = 12) auditory cortical neurons. Inset shows average action potential of every neuron. c, Average spiking activity of excitatory (black) and PV+ (green) populations in the auditory cortex and excitatory M2 neurons (blue, n = 90) relative to movement onset, normalized to spontaneous firing levels during rest. Triangles and dashed vertical lines show time of significant deviation from resting. All movements lasted at least 1 second, and 80 percent of movements persisted for at least 2 seconds, as indicated by gradation of grey bar. d, Schematic showing Cre-dependent expression of tdTomato in M2ACtx neurons, injection of M2 with GCaMP6s, and 2-photon calcium imaging. e, tdTomato+ and tdTomato- M2 neurons expressing GCaMP6s in M2. f, Change in fluorescence of tdTomato+ (n = 7) and tdTomato- (n = 23) M2 neurons aligned to movement onset. Inset shows a representative imaging region in M2 with tdTomato+ and tdTomato- M2 neurons expressing GCaMP6s. Error bars show mean+/−s.e. Statistical details in Methods.
Figure 4
Figure 4. M2 axon terminals in the auditory cortex are sufficient to produce movement-like auditory cortical dynamics during rest
a, Schematic showing intracellular recording in the auditory cortex during optogenetic activation of ChR2+ M2 terminals. b, Optogenetic stimulation of M2 terminals in the auditory cortex causes a slight depolarization and decreased variability (top), and during tonic depolarization, M2 terminal stimulation suppresses spontaneous spiking and hyperpolarizes neurons (bottom, spikes truncated). c, Schematic showing intracellular recording in auditory cortex during optogenetic activation of ChR2+ M2 terminals and multielectrode array recordings in M2 during pharmacological silencing of M2 cell bodies with the sodium channel blocker, TTX. d, Left panels show superficial and deep recordings in M2 with spontaneous spikes (top and bottom) and antidromic spikes evoked by optogenetic stimulation of M2ACtx terminals (bottom). Right panels show the abolition of spontaneous and antidromic spiking in M2 after TTX application. eg, M2 terminal stimulation leads to decreases in membrane potential variability (e, n = 15/14, Paired t-test), a slight depolarization (f, n = 15/14, t-test), and decreased tone-evoked responses (g, n = 13/9, Paired t-test), with and without M2 cell bodies inactivated with TTX (n = number of cells recorded without/with TTX; legend in e applies to e-g). h, Normalized average change in membrane potential after M2 terminal stimulation without (red, n = 15) and with (black, n = 14) M2 cell bodies inactivated. Vertical black dashed line shows the latency of an antidromic spike traveling from the auditory cortex to M2. Horizontal dashed lines indicate significant depolarizations relative to baseline. *P<0.05, **P<0.01. Statistical details in Methods.
Figure 5
Figure 5. M2 activity is necessary to sustain movement-related dynamics in the auditory cortex
a,b, Schematics showing intracellular recording in auditory cortex while silencing ipsilateral (a) or contralateral (b) M2. c, Average spiking activity (mean+/−se) of a population of M2 excitatory neurons (n = 66) before, during, and after optogenetic activation of M2 inhibitory neurons. d, Membrane potential dynamics of example auditory cortical excitatory neuron during rest, during movement, and during movement with optogenetic suppression of ipsilateral M2 excitatory neurons (blue bar). e, As in (d), but while silencing contralateral M2. f, Transition to rest-like membrane potential dynamics precedes movement offset with ipsilateral M2 silencing (n = 27, p < 0.001, Two-sample KS-test) but follows movement offset with contralateral M2 silencing (n = 12, p < 0.05, Two-sample KS-test). g,h, Membrane potential variance (g, n = 10, Paired t-test) and mean (h, n = 10, Paired t-test) of auditory cortical excitatory neurons during rest and movement with and without optogenetic suppression of ipsilateral M2. i, Tone-evoked responses of an example neuron during rest and movement, with and without optogenetic suppression of ipsilateral M2. j, Tone-evoked responses of auditory cortical excitatory neurons during rest and movement, with and without optogenetic suppression of ipsilateral M2 (n = 7, Paired t-test). *P<0.05, **P<0.01, ***P<0.001. Statistical details in Methods.

Comment in

References

    1. Eliades SJ, Wang X. Sensory-motor interaction in the primate auditory cortex during self-initiated vocalizations. Journal of neurophysiology. 2003;89:2194–2207. doi: 10.1152/jn.00627.2002. - DOI - PubMed
    1. Lee S, Kruglikov I, Huang ZJ, Fishell G, Rudy B. A disinhibitory circuit mediates motor integration in the somatosensory cortex. Nature neuroscience. 2013;16:1662–1670. doi: 10.1038/nn.3544. - DOI - PMC - PubMed
    1. Maimon G, Straw AD, Dickinson MH. Active flight increases the gain of visual motion processing in Drosophila. Nature neuroscience. 2010;13:393–399. doi: 10.1038/nn.2492. - DOI - PubMed
    1. Petreanu L, et al. Activity in motor-sensory projections reveals distributed coding in somatosensation. Nature. 2012;489:299–303. doi: 10.1038/nature11321. - DOI - PMC - PubMed
    1. Polack PO, Friedman J, Golshani P. Cellular mechanisms of brain state-dependent gain modulation in visual cortex. Nature neuroscience. 2013;16:1331–1339. doi: 10.1038/nn.3464. - DOI - PMC - PubMed

Publication types