

Simulated cytoskeletal collapse via tau degradation
- PMID: 25162587
- PMCID: PMC4146510
- DOI: 10.1371/journal.pone.0104965
Simulated cytoskeletal collapse via tau degradation
Abstract
We present a coarse-grained two dimensional mechanical model for the microtubule-tau bundles in neuronal axons in which we remove taus, as can happen in various neurodegenerative conditions such as Alzheimers disease, tauopathies, and chronic traumatic encephalopathy. Our simplified model includes (i) taus modeled as entropic springs between microtubules, (ii) removal of taus from the bundles due to phosphorylation, and (iii) a possible depletion force between microtubules due to these dissociated phosphorylated taus. We equilibrate upon tau removal using steepest descent relaxation. In the absence of the depletion force, the transverse rigidity to radial compression of the bundles falls to zero at about 60% tau occupancy, in agreement with standard percolation theory results. However, with the attractive depletion force, spring removal leads to a first order collapse of the bundles over a wide range of tau occupancies for physiologically realizable conditions. While our simplest calculations assume a constant concentration of microtubule intercalants to mediate the depletion force, including a dependence that is linear in the detached taus yields the same collapse. Applying percolation theory to removal of taus at microtubule tips, which are likely to be the protective sites against dynamic instability, we argue that the microtubule instability can only obtain at low tau occupancy, from 0.06-0.30 depending upon the tau coordination at the microtubule tips. Hence, the collapse we discover is likely to be more robust over a wide range of tau occupancies than the dynamic instability. We suggest in vitro tests of our predicted collapse.
Conflict of interest statement
Figures
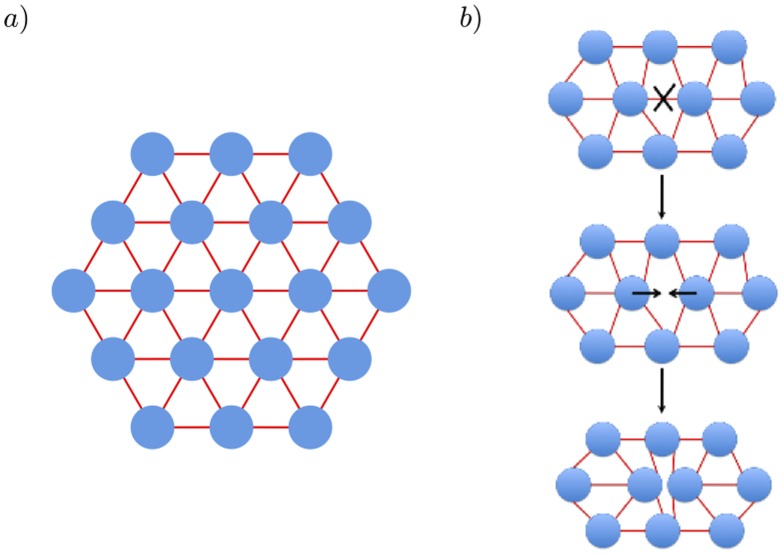
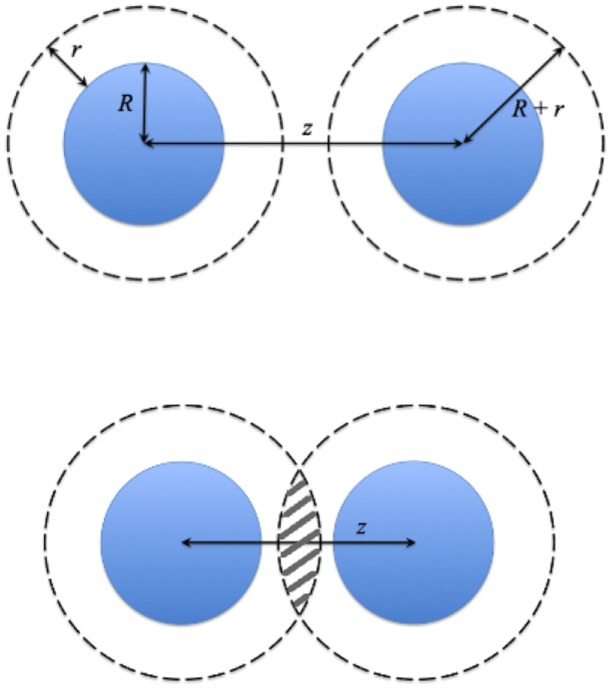
 is depleted of intercalants. The loss of excluded volume as the microtubules approach allows increased translational entropy outside the bundle for the intercalants.
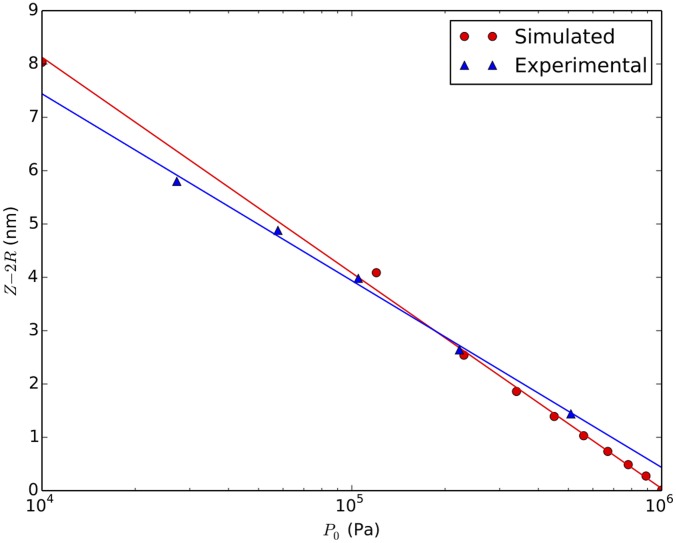
 and (b) scale to the
  limit. In contrast to Ref. , all
  values yield the same results when scaled, because their lattice boundary is fixed while ours relax to equilibrium. In all cases, the transverse rigidity percolation threshold is
  , in good agreement with the
  case of Ref.
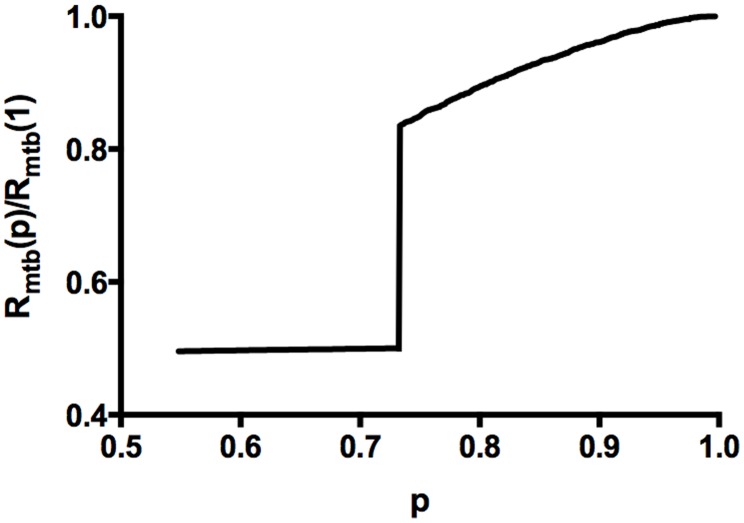
 is reduced from 1, for the dimensionless parameter
  After a gradual reduction of
  for
for  , the depletion force overwhelms the entropic springs at
  = 0.73.
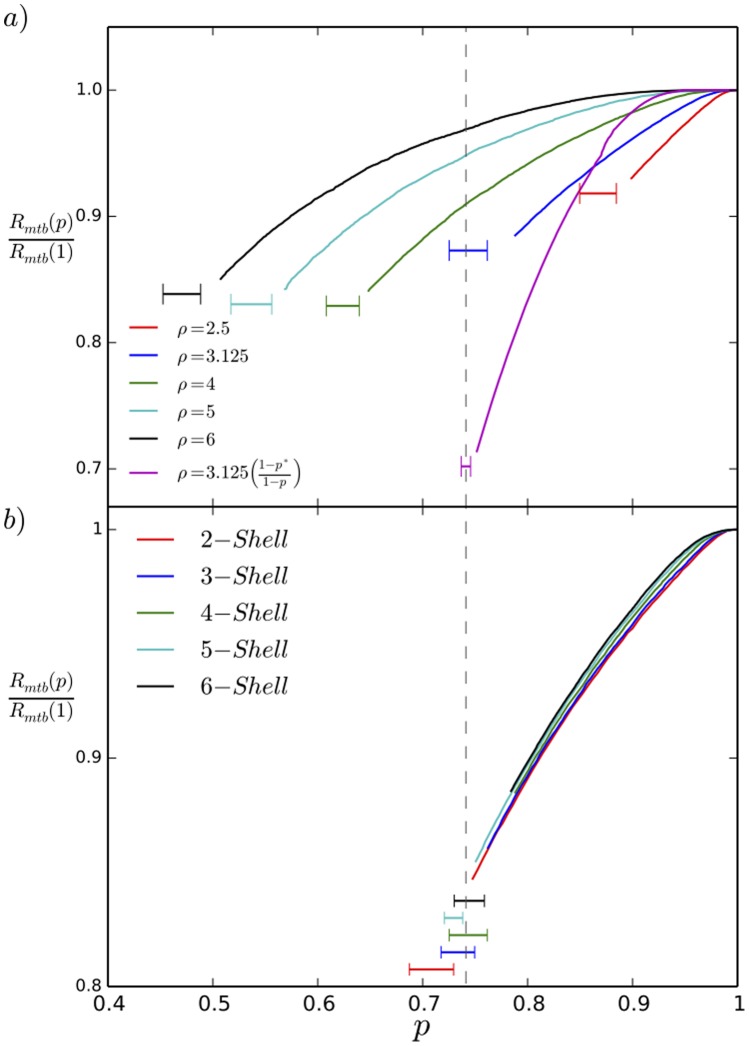
 with the leftmost end at
  . a) The MTBs undergo a first order collapse with reduced
  , with the collapse onset decreasing with
  for fixed spring constant
  = 0.05 pN/nm. The lavender curve is computed with the same
  value at collapse as the blue curve but for an osmotic pressure proportional to
  . For
. For  (not shown) the radius
  is that of hexagaonally close packed microtubules. b) For varying initial bundle radius, measured by the number of hexagonal shells retained about the central MT, the normalized radius displays the collapse at the same location for a fixed value of
  = 3.125, indicating the collapse is not an artifact of finite size.
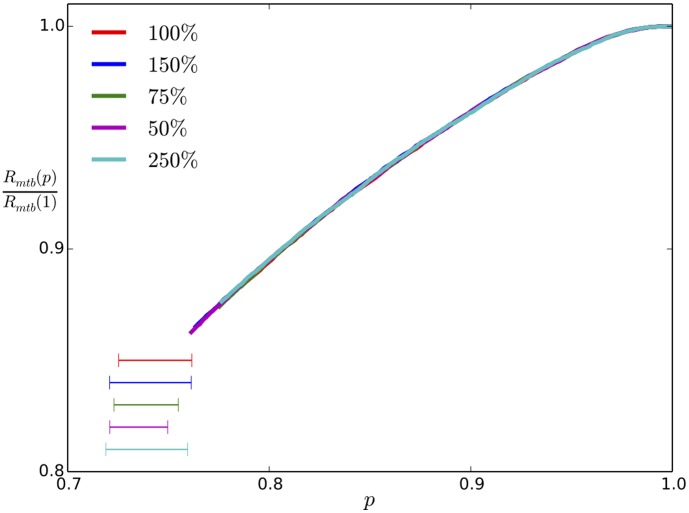
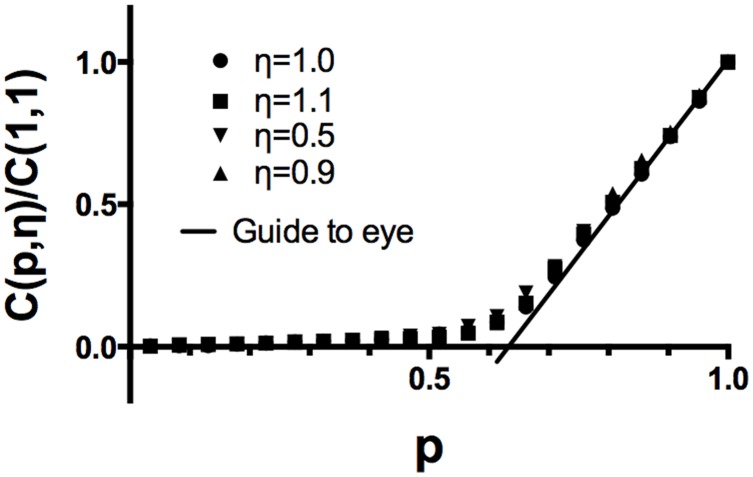
 with the leftmost end at
  . Here we carry out the simulations multiplying
  independently by the percentages shown in the legend to achieve the same
  value. Clearly this gives the same
  for collapse onset.
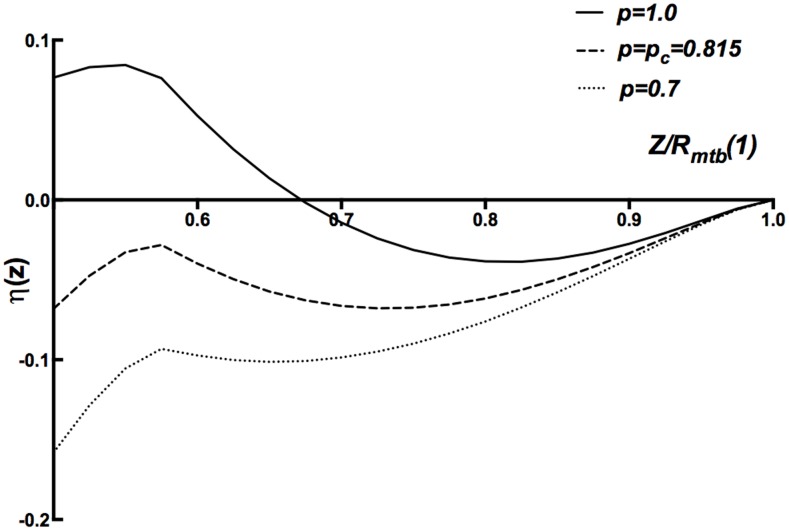
 vs. scaled mean microtubule separation
  for
for  nm and
  = 3.125. As
  is reduced, the potential at
  which is the separation at microtubule contact, reaches a lower value than the minimum which evolves from
  at
at  .
.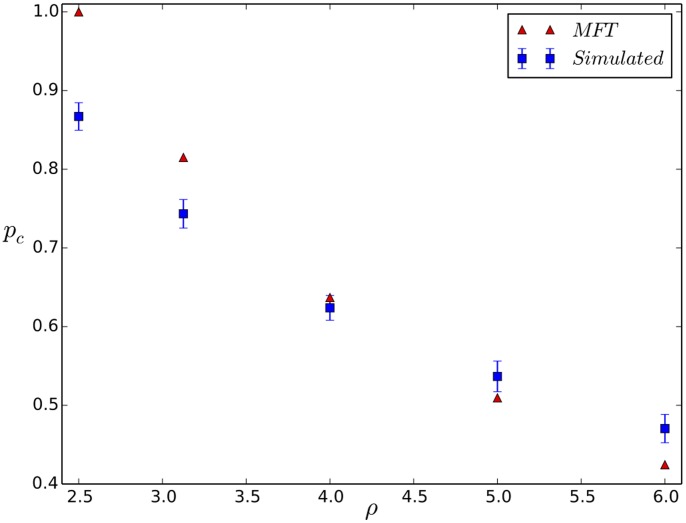
 vs.
vs.  for the MFT and the full simulations. Clearly, the MFT and full simulation trends are very similar.
References
-
- Hardy JA, Higgins GA (1992) The amyloid cascade hypothesis. Science 256: 184–185. - PubMed
-
- Hardy JA, Selkoe DJ (2002) The amyloid hypothesis of alzheimer's disease: progress and problems on the road to therapeutics. Science 297: 353–356. - PubMed
-
- Wang JZ, Liu F (2008) Microtubule-associated protein tau in development, degeneration, and protection of neurons. Progress in Neurobiology 85: 148–175. - PubMed
Publication types
MeSH terms
Substances
Associated data
LinkOut - more resources
Full Text Sources
Other Literature Sources
