

Genomic and transcriptomic analysis of NDM-1 Klebsiella pneumoniae in spaceflight reveal mechanisms underlying environmental adaptability
- PMID: 25163721
- PMCID: PMC4147364
- DOI: 10.1038/srep06216
Genomic and transcriptomic analysis of NDM-1 Klebsiella pneumoniae in spaceflight reveal mechanisms underlying environmental adaptability
Abstract
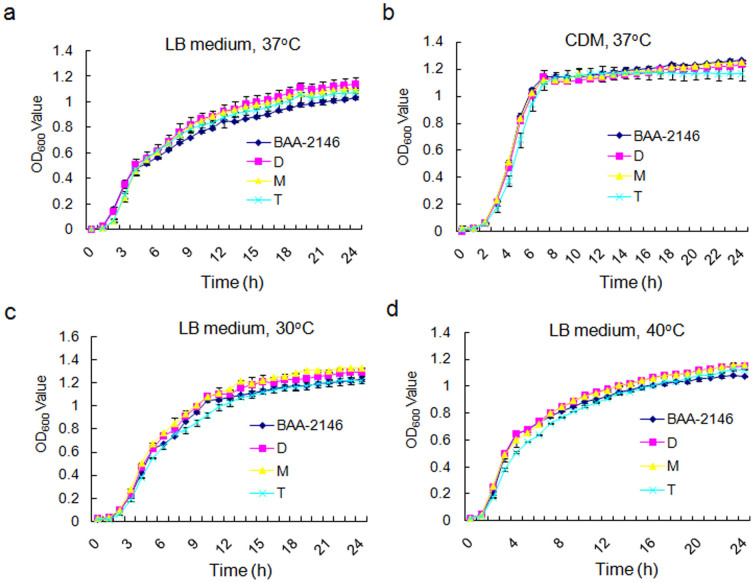
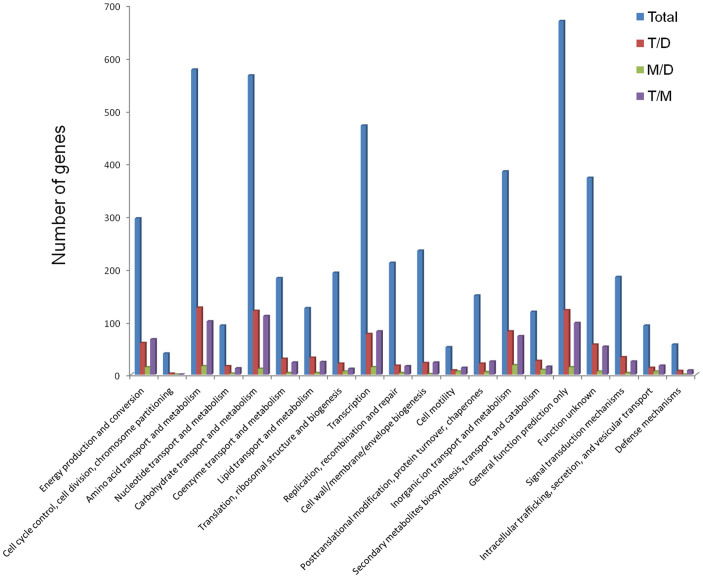
The emergence and rapid spread of New Delhi Metallo-beta-lactamase-1 (NDM-1)-producing Klebsiella pneumoniae strains has caused a great concern worldwide. To better understand the mechanisms underlying environmental adaptation of those highly drug-resistant K. pneumoniae strains, we took advantage of the China's Shenzhou 10 spacecraft mission to conduct comparative genomic and transcriptomic analysis of a NDM-1 K. pneumoniae strain (ATCC BAA-2146) being cultivated under different conditions. The samples were recovered from semisolid medium placed on the ground (D strain), in simulated space condition (M strain), or in Shenzhou 10 spacecraft (T strain) for analysis. Our data revealed multiple variations underlying pathogen adaptation into different environments in terms of changes in morphology, H2O2 tolerance and biofilm formation ability, genomic stability and regulation of metabolic pathways. Additionally, we found a few non-coding RNAs to be differentially regulated. The results are helpful for better understanding the adaptive mechanisms of drug-resistant bacterial pathogens.
Figures


Similar articles
-
Increased biofilm formation ability in Klebsiella pneumoniae after short-term exposure to a simulated microgravity environment.Microbiologyopen. 2016 Oct;5(5):793-801. doi: 10.1002/mbo3.370. Epub 2016 May 16. Microbiologyopen. 2016. PMID: 27185296 Free PMC article.
-
Effects of Space Environment on Genome, Transcriptome, and Proteome of Klebsiella pneumoniae.Arch Med Res. 2015 Nov;46(8):609-18. doi: 10.1016/j.arcmed.2015.11.001. Epub 2015 Nov 10. Arch Med Res. 2015. PMID: 26562174
-
Population Genomic Analysis of 1,777 Extended-Spectrum Beta-Lactamase-Producing Klebsiella pneumoniae Isolates, Houston, Texas: Unexpected Abundance of Clonal Group 307.mBio. 2017 May 16;8(3):e00489-17. doi: 10.1128/mBio.00489-17. mBio. 2017. PMID: 28512093 Free PMC article.
-
Transcriptomic responses of a New Delhi metallo-β-lactamase-producing Klebsiella pneumoniae isolate to the combination of polymyxin B and chloramphenicol.Int J Antimicrob Agents. 2020 Aug;56(2):106061. doi: 10.1016/j.ijantimicag.2020.106061. Epub 2020 Jun 20. Int J Antimicrob Agents. 2020. PMID: 32574791
-
Comparative genomic analysis of Klebsiella pneumonia (LCT-KP214) and a mutant strain (LCT-KP289) obtained after spaceflight.BMC Genomics. 2014 Jul 12;15:589. doi: 10.1186/1471-2164-15-589. BMC Genomics. 2014. PMID: 25015528 Free PMC article.
Cited by
-
Increased biofilm formation ability in Klebsiella pneumoniae after short-term exposure to a simulated microgravity environment.Microbiologyopen. 2016 Oct;5(5):793-801. doi: 10.1002/mbo3.370. Epub 2016 May 16. Microbiologyopen. 2016. PMID: 27185296 Free PMC article.
-
Microbial applications for sustainable space exploration beyond low Earth orbit.NPJ Microgravity. 2023 Jun 21;9(1):47. doi: 10.1038/s41526-023-00285-0. NPJ Microgravity. 2023. PMID: 37344487 Free PMC article. Review.
-
A Rapid Spin Column-Based Method to Enrich Pathogen Transcripts from Eukaryotic Host Cells Prior to Sequencing.PLoS One. 2016 Dec 21;11(12):e0168788. doi: 10.1371/journal.pone.0168788. eCollection 2016. PLoS One. 2016. PMID: 28002481 Free PMC article.
-
Genomic characterization of Escherichia coli LCT-EC001, an extremely multidrug-resistant strain with an amazing number of resistance genes.Gut Pathog. 2019 May 21;11:25. doi: 10.1186/s13099-019-0298-5. eCollection 2019. Gut Pathog. 2019. PMID: 31139265 Free PMC article.
-
Mechanotransduction in Prokaryotes: A Possible Mechanism of Spaceflight Adaptation.Life (Basel). 2021 Jan 7;11(1):33. doi: 10.3390/life11010033. Life (Basel). 2021. PMID: 33430182 Free PMC article.
References
-
- Lippmann N., Lubbert C., Kaiser T., Kaisers U. X. & Rodloff A. C. Clinical epidemiology of Klebsiella pneumoniae carbapenemases. Lancet Infect Dis 14, 271–272, 10.1016/S1473-3099(14)70705-4 (2014). - PubMed
Publication types
MeSH terms
Substances
LinkOut - more resources
Full Text Sources
Other Literature Sources
