Review
. 2015 Oct;227(4):394-408.
doi: 10.1111/joa.12228. Epub 2014 Aug 28.

Single-cell recordings in the human medial temporal lobe

Affiliations
Review

Single-cell recordings in the human medial temporal lobe

Hernan G Rey et al. J Anat. 2015 Oct.

Abstract

Recordings from individual neurons in patients who are implanted with depth electrodes for clinical reasons have opened the possibility to narrow down the gap between neurophysiological studies in animals and non-invasive (e.g. functional magnetic resonance imaging, electroencephalogram, magnetoencephalography) investigations in humans. Here we provide a description of the main procedures for electrode implantation and recordings, the experimental paradigms used and the main steps for processing the data. We also present key characteristics of the so-called 'concept cells', neurons in the human medial temporal lobe with selective and invariant responses that represent the meaning of the stimulus, and discuss their proposed role in declarative memory. Finally, we present novel results dealing with the stability of the representation given by these neurons, by studying the effect of stimulus repetition in the strength of the responses. In particular, we show that, after an initial decay, the response strength reaches an asymptotic value after approximately 15 presentations that remains above baseline for the whole duration of the experiment.

Keywords: declarative memory; medial temporal lobe; repetition suppression; single cell recordings in humans.


Figures

Figure 1
Figure 1
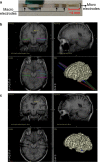
Surgical planning. (A) Before implantation, the microwires are inserted in the lumen of the polyurethane probe so they can be trimmed to the desired length (∼4 mm). (B) Based on a pre-operative MRI scan, computer software provides the stereotactic coordinates of the targets where the electrodes should be implanted. (C) After surgery, a post-operative MRI or CT is co-registered with the preoperative MRI to assess the accuracy of the actual position of the electrodes.
Figure 2
Figure 2
Example of screening and testing sessions. (Top) Each trial started with a fixation cross on the screen for 500 ms, followed by a picture displayed for 1000 ms. Next, the screen went black, and the patient had to press a key to respond whether or not there was a person in the picture. Finally, there was a random inter-trial interval between 600 and 800 ms. (Middle) A screening session is performed by showing a set of ∼100 pictures of animals, celebrities and landmarks, with each picture presented six times. (Bottom) The testing session is performed within a few hours after the screening session. In this case, a set of pictures eliciting responses in the screening session is shown again many more times to study the stability of the responses (see Fig.8).
Figure 3
Figure 3
Single-unit responses. (a) Spike sorting. The top plot shows 60 s of the high-pass filtered recording (300–3000 Hz) from a microwire implanted in the left anterior hippocampus (the red solid line is the detection threshold). The bottom part shows all the detected spikes (left) and five clusters that were identified after sorting the spikes. (b) Raster plots associated to five pictures used during the session (first trial on top; time zero corresponds to stimulus onset). When all the detected spikes are considered (first row), there are no clear responses. However, the response is actually elicited by the single unit associated to cluster 3. Moreover, the raster plots for cluster 5 allow us to unravel a response to the picture of the Taj Mahal (that was not evident from the detected spikes). This cell fired selectively to this particular stimulus, remaining nearly silent to all the other stimuli.
Figure 4
Figure 4
Multi and single unit responses. (a) Same conventions as in Fig.3. In this case, four clusters were identified after sorting the spikes recorded from a microwire implanted in the left anterior hippocampus. (b) Cluster 1 is associated to multi-unit activity showing responses to the pictures of the patient and his daughter (pictures covered for confidentiality issues). In addition, cluster 3 is an example of another silent neuron, in this case one responding selectively to the picture of George Harrison.
Figure 5
Figure 5
Selectivity of single-cell responses. Responses of a single unit in the left hippocampus during a testing session, where 12 pictures were presented 35 times each (19 min recording). The dashed vertical lines in the histogram denote onset and offset of the response based on the automatic response criterion. This ‘silent’ neuron (0.5 Hz on average during the session) shows a very selective response to the picture of Stonehenge (45% of the spikes took place in the trials associated to the Stonehenge picture, with half of them appearing between the onset and offset of the response).
Figure 6
Figure 6
Stimulus relevance. (a) This unit in the left anterior hippocampus responded selectively to the pictures of Prince William, the Duchess of Cambridge (Kate Middleton) and both of them together, in a recording that took place 4 weeks before the ‘Royal Wedding’. (b) This unit in the left posterior hippocampus shows a selective response to the picture of Alastair Cook, a cricket player who was the ‘Player of the Ashes Series’ between England and Australia, which finished 2 months before the date of the recording.
Figure 7
Figure 7
Response criterion. Example of a unit in the left hippocampus responsive to the picture of the Taj Mahal. The top panel shows the results from the first screening session. On the left, the waveforms of the 3520 spikes are superimposed. On the right, the raster plot associated to the picture of the Taj Mahal is shown (in blue). The red curve corresponds to the time profile of the mean firing rate (obtained by convolving the spike train with a Gaussian kernel with a value of σ = 10 ms), whereas the vertical dashed lines mark the crossing of a threshold (magenta line), and mark the onset and offset of the response. The bottom panel shows the equivalent results from (putatively) the same neuron (2112 spikes), but during the testing session (5 h after the first one).
Figure 8
Figure 8
Response dynamics with stimulus repetition. (a) The figure shows the difference of the normalized spike count between the post-stimulus and baseline windows as a function of the trial number (number of times a particular stimulus was presented). The mean (dots) and SEM (error bars) were computed across the 72 responses found in the data set. The mean values were also fitted with an exponential model (solid line). (b) Time course of the mean normalized firing rate (across the 72 responses) for a group of selected trials. In the left panel, the time courses of each response for trial i are aligned to the stimulus onset before averaging, whereas in the right panel they are aligned to the response onset. For the computation of the instantaneous firing rate we used the Gaussian kernel with a value of σ = 50 ms.

References

    1. Babb TL, Carr E, Crandall PH. Analysis of extracellular firing patterns of deep temporal lobe structures in man. Electroencephalogr Clin Neurophysiol. 1973;34:247–257. - PubMed
    1. Burwell RD, Agster KL. Anatomy of the hippocampus and the declarative memory system. In: John HB, editor. Learning and Memory: A Comprehensive Reference. Oxford: Academic Press; 2008. pp. 47–66.
    1. Cerf M, Thiruvengadam N, Mormann F, et al. On-line, voluntary control of human temporal lobe neurons. Nature. 2010;467:1104–1108. - PMC - PubMed
    1. Eichenbaum H. The hippocampus and declarative memory: cognitive mechanisms and neural codes. Behav Brain Res. 2001;127:199–207. - PubMed
    1. Eichenbaum H. Hippocampus: cognitive processes and neural representations that underlie declarative memory. Neuron. 2004;44:109–120. - PubMed

Publication types