

Determination of phosphate-activated glutaminase activity and its kinetics in mouse tissues using metabolic mapping (quantitative enzyme histochemistry)
- PMID: 25163927
- PMCID: PMC4230542
- DOI: 10.1369/0022155414551177
Determination of phosphate-activated glutaminase activity and its kinetics in mouse tissues using metabolic mapping (quantitative enzyme histochemistry)
Abstract
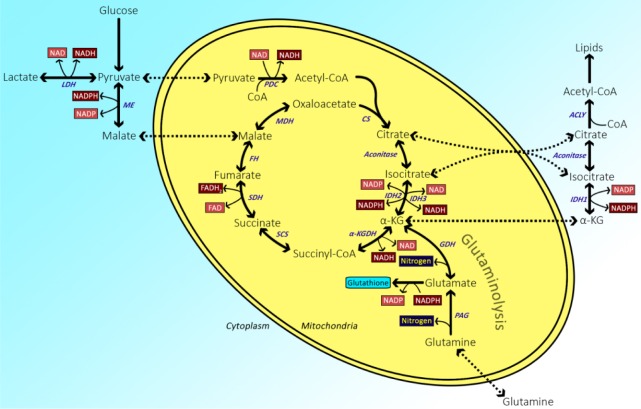
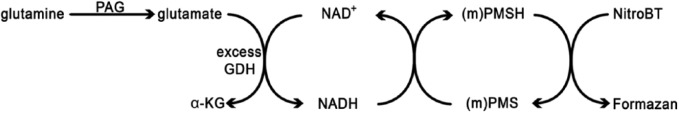
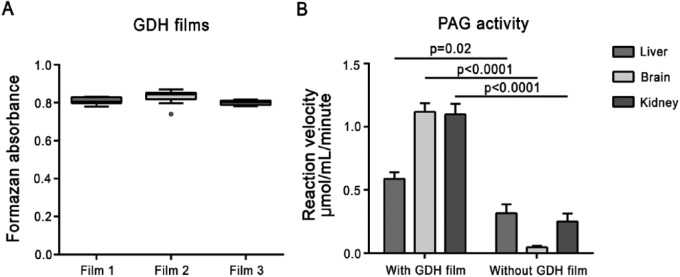
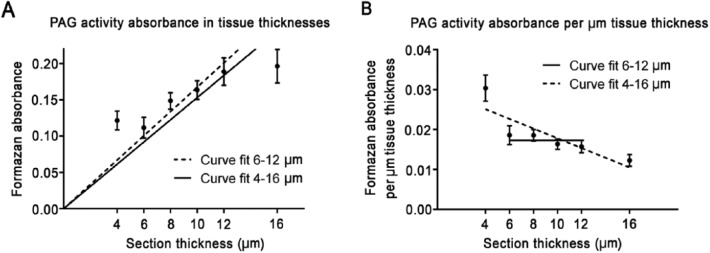
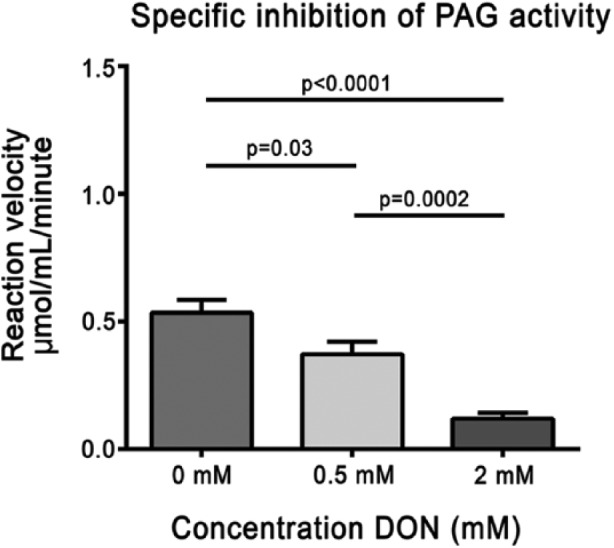
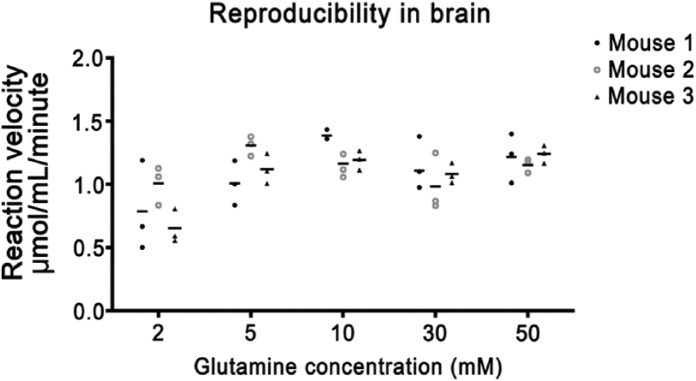
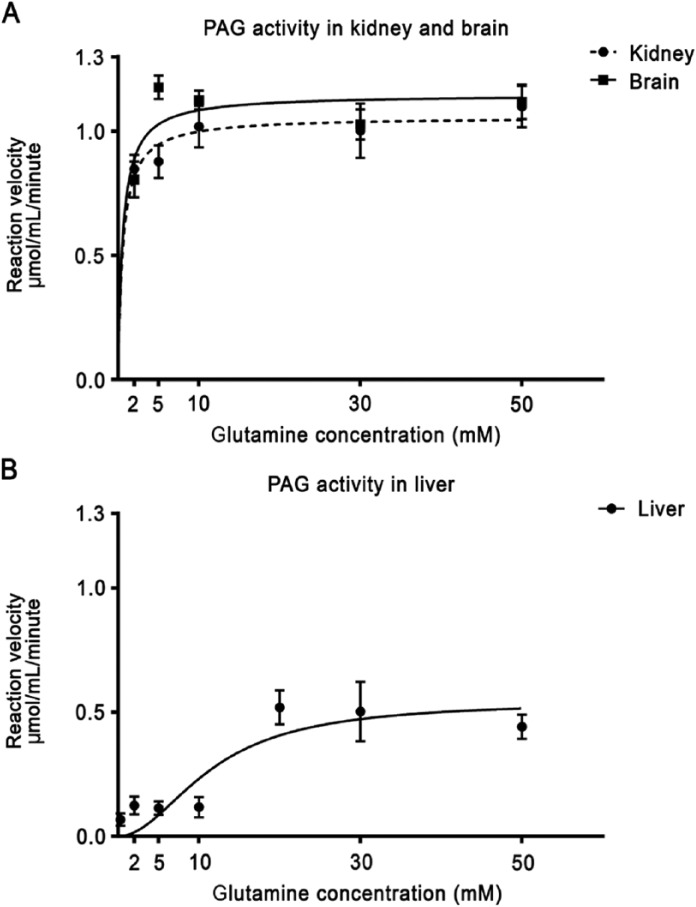
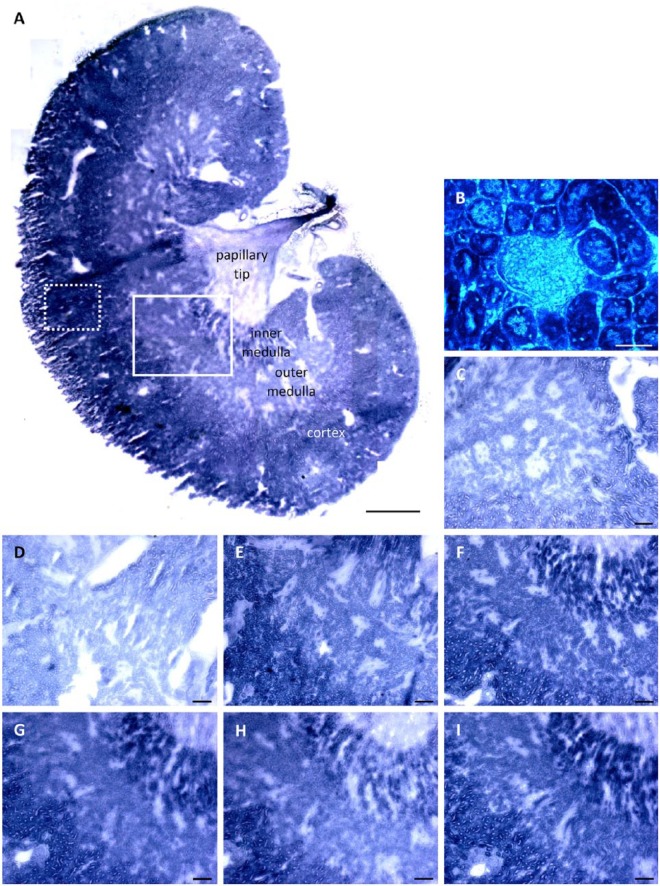
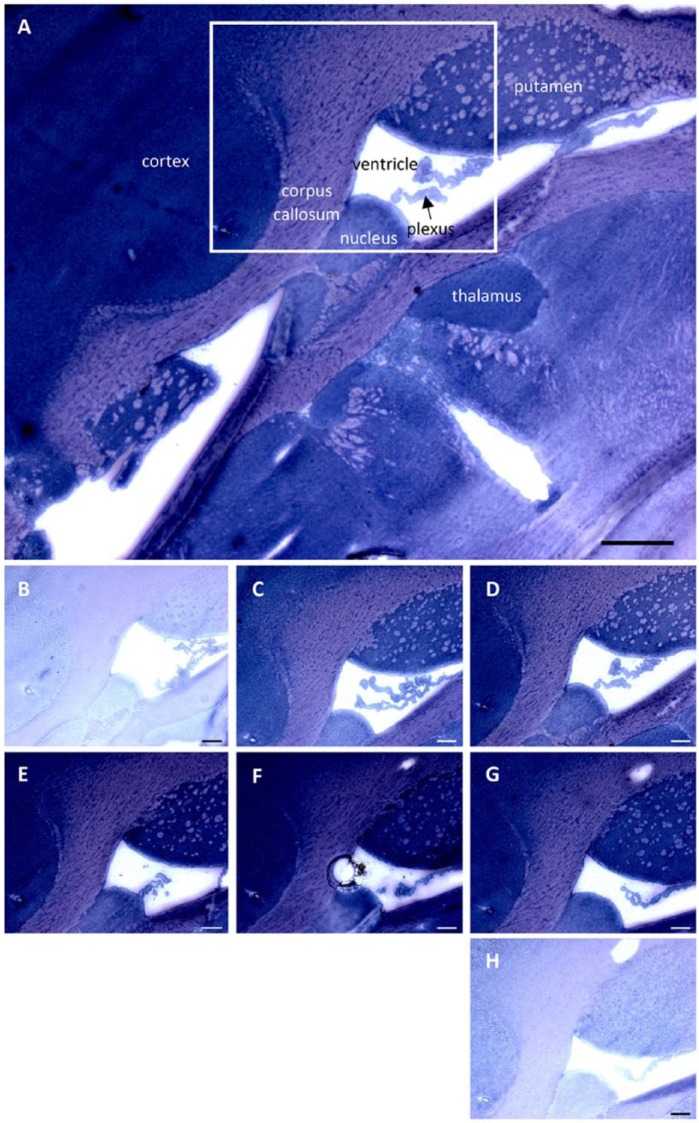
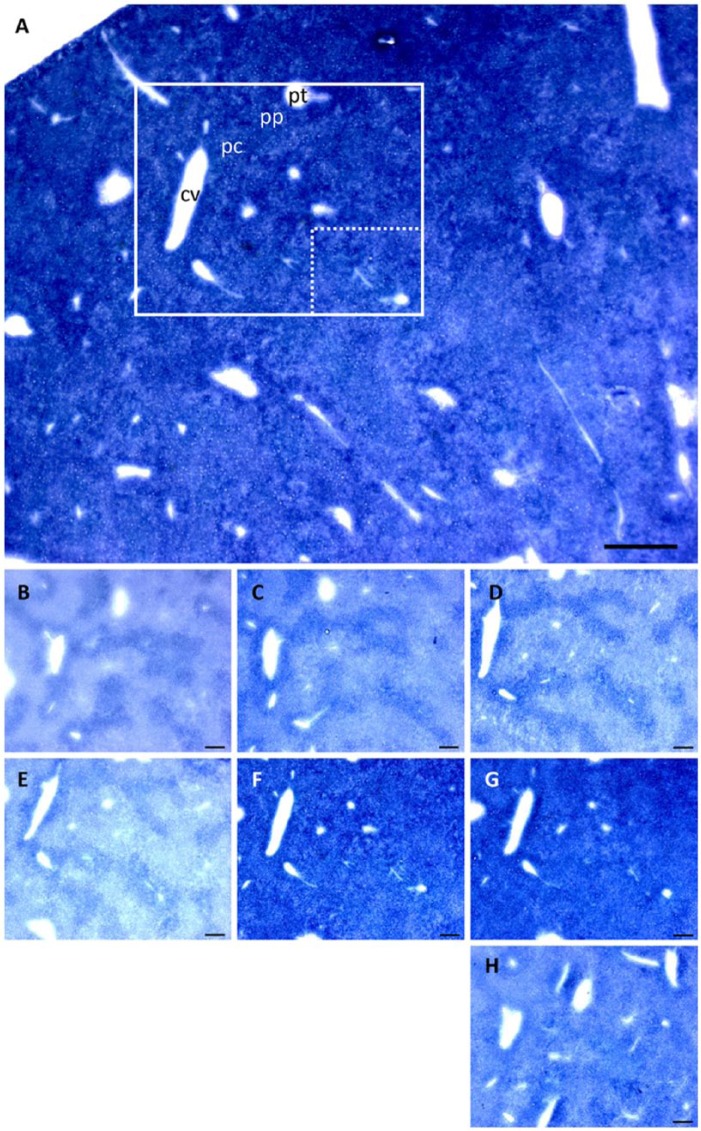
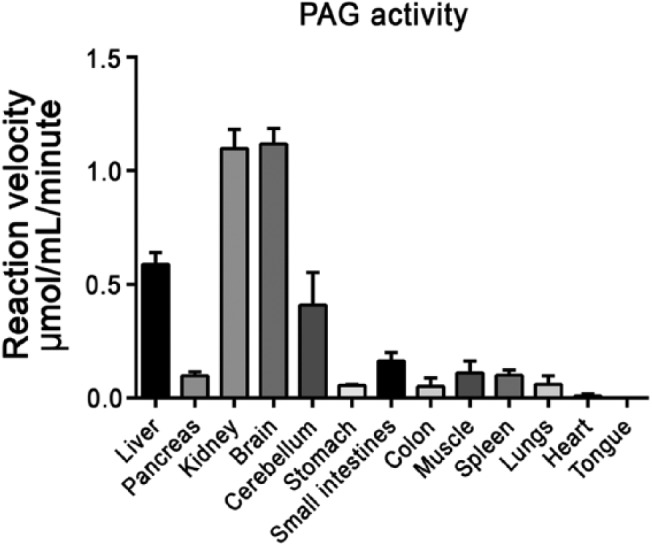
Phosphate-activated glutaminase (PAG) converts glutamine to glutamate as part of the glutaminolysis pathway in mitochondria. Two genes, GLS1 and GLS2, which encode for kidney-type PAG and liver-type PAG, respectively, differ in their tissue-specific activities and kinetics. Tissue-specific PAG activity and its kinetics were determined by metabolic mapping using a tetrazolium salt and glutamate dehydrogenase as an auxiliary enzyme in the presence of various glutamine concentrations. In kidney and brain, PAG showed Michaelis-Menten kinetics with a K(m) of 0.6 mM glutamine and a V(max) of 1.1 µmol/mL/min when using 5 mM glutamine. PAG activity was high in the kidney cortex and inner medulla but low in the outer medulla, papillary tip, glomeruli and the lis of Henle. In brain tissue sections, PAG was active in the grey matter and inactive in myelin-rich regions. Liver PAG showed allosteric regulation with a K(m) of 11.6 mM glutamine and a V(max) of 0.5 µmol/mL/min when using 20 mM glutamine. The specificity of the method was shown after incubation of brain tissue sections with the PAG inhibitor 6-diazo-5-oxo-L-norleucine. PAG activity was decreased to 22% in the presence of 2 mM 6-diazo-5-oxo-L-norleucine. At low glutamine concentrations, PAG activity was higher in periportal regions, indicating a lower K(m) for periportal PAG. When compared with liver, kidney and brain, other tissues showed 3-fold to 6-fold less PAG activity. In conclusion, PAG is mainly active in mouse kidney, brain and liver, and shows different kinetics depending on which type of PAG is expressed.
Keywords: enzyme histochemistry; enzyme inhibition; glutamate; glutamine; glutaminolysis; quantitation.
© The Author(s) 2014.
Conflict of interest statement
Figures
Similar articles
-
Inactivation of rat renal phosphate-dependent glutaminase with 6-diazo-5-oxo-L-norleucine. Evidence for interaction at the glutamine binding site.J Biol Chem. 1979 Apr 25;254(8):2835-8. J Biol Chem. 1979. PMID: 429321
-
Phosphate-activated glutaminase and mitochondrial glutamine transport in the brain.Neurochem Res. 2000 Oct;25(9-10):1407-19. doi: 10.1023/a:1007668801570. Neurochem Res. 2000. PMID: 11059811 Review.
-
Determination of glutamate dehydrogenase activity and its kinetics in mouse tissues using metabolic mapping (quantitative enzyme histochemistry).J Histochem Cytochem. 2014 Nov;62(11):802-12. doi: 10.1369/0022155414549071. Epub 2014 Aug 13. J Histochem Cytochem. 2014. PMID: 25124006 Free PMC article.
-
In vivo activity of glutaminase in the brain of hyperammonaemic rats measured by 15N nuclear magnetic resonance.Biochem J. 1995 Jan 1;305 ( Pt 1)(Pt 1):329-36. doi: 10.1042/bj3050329. Biochem J. 1995. PMID: 7826349 Free PMC article.
-
Kinetics and localization of brain phosphate activated glutaminase.J Neurosci Res. 2001 Dec 1;66(5):951-8. doi: 10.1002/jnr.10041. J Neurosci Res. 2001. PMID: 11746423 Review.
Cited by
-
Exploring the relationship between anastasis and mitochondrial ROS-mediated ferroptosis in metastatic chemoresistant cancers: a call for investigation.Front Immunol. 2024 Jul 2;15:1428920. doi: 10.3389/fimmu.2024.1428920. eCollection 2024. Front Immunol. 2024. PMID: 39015566 Free PMC article. Review.
-
High Levels of Glutaminase II Pathway Enzymes in Normal and Cancerous Prostate Suggest a Role in 'Glutamine Addiction'.Biomolecules. 2019 Dec 18;10(1):2. doi: 10.3390/biom10010002. Biomolecules. 2019. PMID: 31861280 Free PMC article.
-
A systematic flux analysis approach to identify metabolic vulnerabilities in human breast cancer cell lines.Cancer Metab. 2019 Dec 27;7:12. doi: 10.1186/s40170-019-0207-x. eCollection 2019. Cancer Metab. 2019. PMID: 31890204 Free PMC article.
-
Glutaminase 1 Regulates Neuroinflammation After Cerebral Ischemia Through Enhancing Microglial Activation and Pro-Inflammatory Exosome Release.Front Immunol. 2020 Feb 7;11:161. doi: 10.3389/fimmu.2020.00161. eCollection 2020. Front Immunol. 2020. PMID: 32117296 Free PMC article.
-
Glutaminase C Regulates Microglial Activation and Pro-inflammatory Exosome Release: Relevance to the Pathogenesis of Alzheimer's Disease.Front Cell Neurosci. 2019 Jun 28;13:264. doi: 10.3389/fncel.2019.00264. eCollection 2019. Front Cell Neurosci. 2019. PMID: 31316350 Free PMC article.
References
-
- Abràmoff MD, Hospitals I, Magalhães PJ, Abràmoff M. (2004). Image processing with ImageJ. Biophotonics Int 11:36-42.
-
- Aledo JC, Gómez-Fabre PM, Olalla L, Márquez J. (2000). Identification of two human glutaminase loci and tissue-specific expression of the two related genes. Mamm Genome 11:1107-1110. - PubMed
-
- Amores-Sánchez MI, Medina MA. (1999). Glutamine, as a precursor of glutathione, and oxidative stress. Mol Genet Metab 67:100-105. - PubMed
-
- Balss J, Meyer J, Mueller W, Korshunov A, Hartmann C, von Deimling A. (2008). Analysis of the IDH1 codon 132 mutation in brain tumors. Acta Neuropathol 116:597-602. - PubMed
MeSH terms
Substances
LinkOut - more resources
Full Text Sources
Other Literature Sources
Miscellaneous
