. 2014 Nov;18(11):2213-24.
doi: 10.1111/jcmm.12353. Epub 2014 Aug 28.

Decreased expression of microRNA-21 correlates with the imbalance of Th17 and Treg cells in patients with rheumatoid arthritis

Affiliations

Decreased expression of microRNA-21 correlates with the imbalance of Th17 and Treg cells in patients with rheumatoid arthritis

Liyang Dong et al. J Cell Mol Med. 2014 Nov.

Abstract

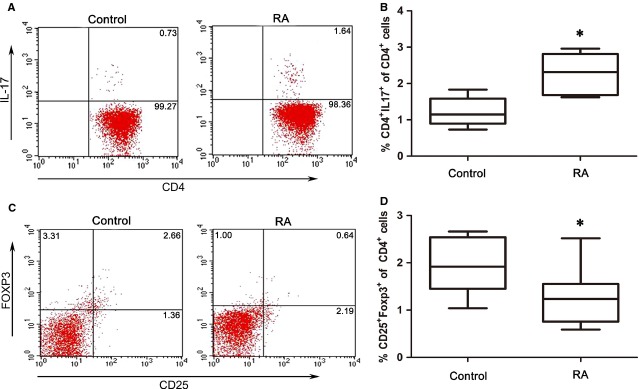
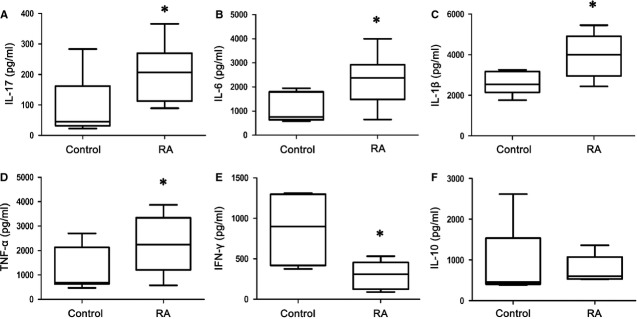
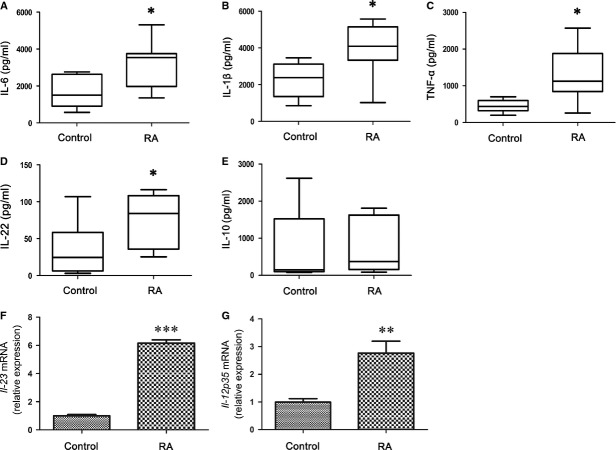
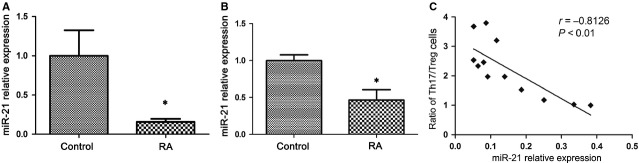
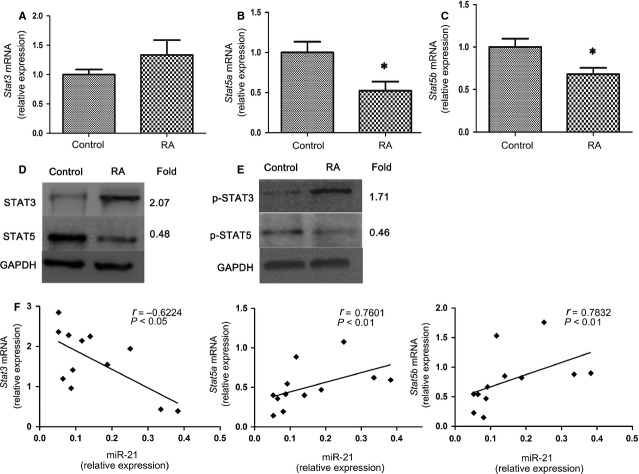
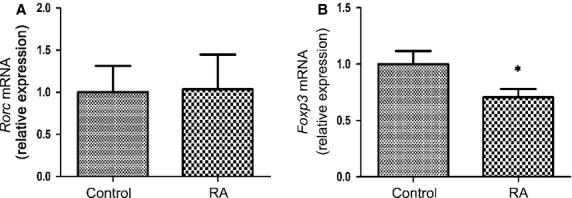
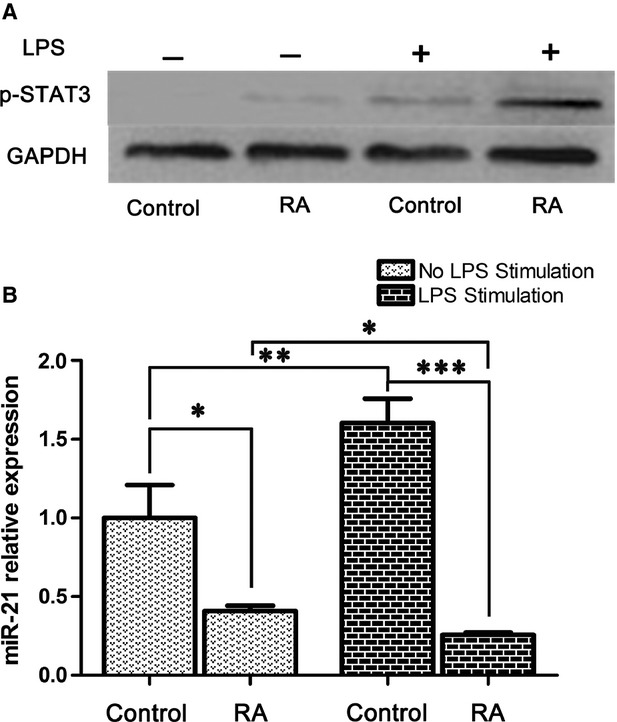
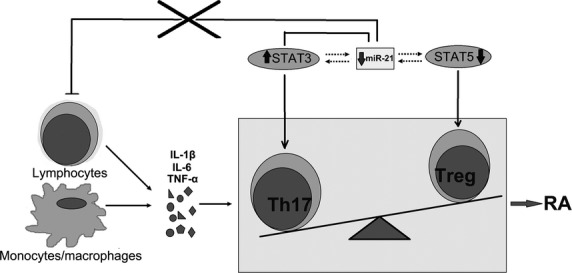
The imbalance of Th17/Treg cell populations has been suggested to be involved in the regulation of rheumatoid arthritis (RA) pathogenesis; however, the mechanism behind this phenomenon remains unclear. Recent studies have shown how microRNAs (miRNAs) are important regulators of immune responses and are involved in the development of a variety of inflammatory diseases, including RA. In this study, we demonstrated that the frequencies of CD3(+) CD4(+) IL-17(+) Th17 cells were significantly higher, and CD4(+) CD25(+) FOXP3(+) Treg cells significantly lower in peripheral blood mononuclear cells from RA patients. Detection of cytokines from RA patients revealed an elevated panel of pro-inflammatory cytokines, including IL-17, IL-6, IL-1β, TNF-α and IL-22, which carry the inflammatory signature of RA and are crucial in the differentiation and maintenance of pathogenic Th17 cells and dysfunction of Treg cells. However, the level of miR-21 was significantly lower in RA patients, accompanied by the increase in STAT3 expression and activation, and decrease in STAT5/pSTAT5 protein and Foxp3 mRNA levels. Furthermore, lipopolysaccharide stimulation up-regulated miR-21 expression from healthy controls, but down-regulated miR-21 expression from RA patients. Therefore, we speculate that miR-21 may be part of a negative feedback loop in the normal setting. However, miR-21 levels decrease significantly in RA patients, suggesting that this feedback loop is dysregulated and may contribute to the imbalance of Th17 and Treg cells. MiR-21 may thus serve as a novel regulator in T-cell differentiation and homoeostasis, and provides a new therapeutic target for the treatment of RA.

Keywords: Th17; Treg; miRNA; pro-inflammatory cytokine; rheumatoid arthritis.


Figures

Figure 1
Figure 1
Increased circulating CD3+CD4+IL-17+ Th17 cells and decreased CD4+CD25+Foxp3+ Treg cells in rheumatoid arthritis (RA) patients. (A) Peripheral blood mononuclear cells (PBMC) from RA patients (n = 25) and healthy controls (n = 20) were stimulated with PMA, ionomycin and BFA for 5 hrs, and then stained with fluorescently labelled anti-human antibodies. FCM analysis for CD3, CD4 and IL-17 was performed. The representative flow cytometric results are shown, and values indicate the percentage of events in the indicated quadrant. (B) Collective analysis of Th17 cells from RA patients and healthy controls; data are expressed as box plots. Each box represents the interquartile range (IQR). Lines inside the boxed represent the median. Whiskers represent the highest and lowest values. *P < 0.05, versus control (Mann–Whitney U-test). (C) PBMC from RA patients and healthy controls were stained with labelled anti-human antibodies. FCM analysis for CD4, CD25 and Foxp3 was performed. The representative flow cytometric results are shown, and values indicate the percentage of events in the indicated quadrant. (D) Collective analysis of Treg cells from RA patients and healthy controls, and the data are expressed as box plots. Each box represents the IQR. Lines inside the boxed represent the median. Whiskers represent the highest and lowest values. *P < 0.05, versus control (Mann–Whitney U-test).
Figure 2
Figure 2
Increase in the production of pro-inflammatory cytokines from peripheral blood mononuclear cells (PBMC) with rheumatoid arthritis (RA) patients by PHA stimulation. PBMC (2 × 10⁵/well) from RA patients (n = 25) and healthy controls (n = 20) were stimulated with PHA (5 μg/ml) in 200 μl culture media in 96-well plates. Supernatants were collected after 24 hrs and tested for IL-17 (A), IL-6 (B), IL-1β (C), TNF-α (D), IFN-γ (E), or IL-10 (F). The data are expressed as box plots. Each box represents the IQR. Lines inside the boxed represent the median. Whiskers represent the highest and lowest values. *P < 0.05, versus control (Mann–Whitney U-test).
Figure 3
Figure 3
Increase in the production of pro-inflammatory cytokines from lipopolysaccharide (LPS)-stimulated peripheral blood mononuclear cells (PBMC) with rheumatoid arthritis (RA) patients. PBMC (2 × 10⁵/well) from RA patients (n = 25) and healthy control (n = 20) were stimulated with LPS (1 μg/ml) in 200 μl culture media in 96-well plates. Supernatants were collected after 24 hrs and tested for IL-6 (A), IL-1β (B), TNF-α (C), IL-22 (D), or IL-10 (E). The data are expressed as box plots. Each box represents the IQR. Lines inside the boxed represent the median. Whiskers represent the highest and lowest values. *P < 0.05, versus control (Mann–Whitney U-test). Cell pellets were collected after 24 hrs and mRNA expression of Il-23 (F) or Il-12p35 were detected (G). The expression of Il-23 or Il-12p35 mRNA in RA patients (n = 6) is shown as relative levels compared with healthy controls (n = 6). Data are expressed as the mean ± SEM. **P < 0.01 and ***P < 0.001, versus control (Student’s t-test).
Figure 4
Figure 4
MiR-21 is decreased in peripheral blood mononuclear cells (PBMCs) and CD4+ T cells from rheumatoid arthritis (RA) patients. (A) PBMCs (3 × 10⁶) were isolated from RA patients (n = 25) and healthy control (n = 20), and miR-21 was quantified by real-time PCR. (B) Expression of miR-21 in sorted CD4+ T cells from RA patients (n = 5) and healthy control (n = 5) by real-time PCR. The expression of miR-21 in patients with RA is shown as relative levels compared with healthy controls. Data are expressed as the mean ± SEM. *P < 0.05, versus control (Student’s t-test). (C) The correlation between miR-21 expression level and the ratio of Th17/Treg cells in PBMC of RA patients (n = 12). The correlation was calculated by Spearman correlation analysis (Spearman r = −0.8126, P < 0.01).
Figure 5
Figure 5
Increased expression and activation of STAT3, and decreased expression and activation of STAT5 in rheumatoid arthritis (RA) patients. (A) Total RNA from peripheral blood mononuclear cells (PBMC; 3 × 10⁶) in RA patients (n = 25) and healthy control (n = 20) were extracted. Real-time PCR analysis of the expression of Stat3 (A), Stat5a (B), Stat5b (C) in patients with RA and healthy controls. The expression of these genes in patients with RA is shown as relative levels compared with healthy controls. Data are expressed as the mean ± SEM. *P < 0.05, versus control (Student’s t-test). (D) Total protein from PBMC (3 × 10⁶) in RA patients (n = 3) and healthy control (n = 3) was extracted. STAT3 and STAT5 protein expression was measured by Western blotting. (E) PBMC (3 × 10⁶) from RA patients (n = 3) and healthy control (n = 3) were stimulated with lipopolysaccharide (LPS) (200 ng/ml) for 24 hrs then extracted for total protein. p-STAT3 (Tyr705) and p-STAT5 (Tyr694) were measured by Western blotting. GAPDH was used as a loading control. The intensity of each band was analyzed using LANE-1D software (Beijing Sage Creation Science, China), and the ratio of the RA group to the control group for each item is presented as fold difference. Data are representative of three independent experiments. (F) Correlation of miR-21 expression with that of Stat3, Stat5a and Stat5b mRNA in PBMC of RA patients (n = 12). Statistical analysis was performed with Spearman correlation and P < 0.05 was considered to be significant.
Figure 6
Figure 6
Foxp3 mRNA is decreased in peripheral blood mononuclear cells (PBMC) from rheumatoid arthritis (RA) patients. PBMC (3 × 10⁶) was isolated from RA patients (n = 25) and healthy control (n = 20). Rorc (A) and Foxp3 (B) gene expression was measured by qRT-PCR. The expression of Rorc and Foxp3 in patients with RA is shown as relative levels compared with healthy controls. Data are expressed as the mean ± SEM. *P < 0.05, versus control (Student’s t-test).
Figure 7
Figure 7
Lipopolysaccharide (LPS) stimulation up-regulated miR-21 expression in peripheral blood mononuclear cells (PBMC) from healthy controls, and down-regulated miR-21 expression from rheumatoid arthritis (RA) patients. PBMC (3 × 10⁶) from RA patients (n = 6) and healthy control (n = 6) with or without LPS (200 ng/ml) stimulation for 24 hrs were isolated for total protein or RNA. (A) p-STAT3 (Tyr705) activation level was measured by Western blotting. The results show a representative blot from three experiments. (B) MiR-21 was quantified by real-time PCR. The expression of miR-21 is shown as relative levels compared with the group without LPS stimulation from healthy controls. Data are expressed as the mean ± SEM. *P < 0.05; **P < 0.01; ***P < 0.001 (Student’s t-test).
Figure 8
Figure 8
Schematic diagram showing the hypothetical role of miR-21 in rheumatoid arthritis (RA) patients. In the normal setting, miR-21 can inhibit inflammation by positively regulating Treg cell development or negatively regulating STAT3. However, decreased levels of miR-21 may increase the expression and activation of STAT3, and simultaneously reduce the expression and activation of STAT5, promoting the Th17 cell differentiation while suppressing Treg cell development during chronic inflammation in RA.

References

    1. McInnes IB, Schett G. The pathogenesis of rheumatoid arthritis. N Engl J Med. 2011;365:2205–19. - PubMed
    1. Andersson AK, Li C, Brennan FM. Recent developments in the immunobiology of rheumatoid arthritis. Arthritis Res Ther. 2008;10:204. - PMC - PubMed
    1. Toh ML, Miossec P. The role of T cells in rheumatoid arthritis: new subsets and new targets. Curr Opin Rheumatol. 2007;19:284–8. - PubMed
    1. Nistala K, Wedderburn LR. Th17 and regulatory T cells: rebalancing pro- and anti-inflammatory forces in autoimmune arthritis. Rheumatology (Oxford) 2009;48:602–6. - PubMed
    1. Wang W, Shao S, Jiao Z, et al. The Th17/Treg imbalance and cytokine environment in peripheral blood of patients with rheumatoid arthritis. Rheumatol Int. 2012;32:887–93. - PubMed

Publication types