. 2014 Aug 27;34(35):11673-83.
doi: 10.1523/JNEUROSCI.0383-14.2014.

Molecular mechanisms contributing to TARP regulation of channel conductance and polyamine block of calcium-permeable AMPA receptors

Affiliations

Molecular mechanisms contributing to TARP regulation of channel conductance and polyamine block of calcium-permeable AMPA receptors

David Soto et al. J Neurosci. .

Abstract

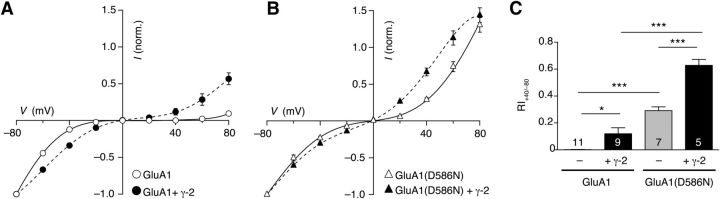
Many properties of fast synaptic transmission in the brain are influenced by transmembrane AMPAR regulatory proteins (TARPs) that modulate the pharmacology and gating of AMPA-type glutamate receptors (AMPARs). Although much is known about TARP influence on AMPAR pharmacology and kinetics through their modulation of the extracellular ligand-binding domain (LBD), less is known about their regulation of the ion channel region. TARP-induced modifications in AMPAR channel behavior include increased single-channel conductance and weakened block of calcium-permeable AMPARs (CP-AMPARs) by endogenous intracellular polyamines. To investigate how TARPs modify ion flux and channel block, we examined the action of γ-2 (stargazin) on GluA1 and GluA4 CP-AMPARs. First, we compared the permeation of organic cations of different sizes. We found that γ-2 increased the permeability of several cations but not the estimated AMPAR pore size, suggesting that TARP-induced relief of polyamine block does not reflect altered pore diameter. Second, to determine whether residues in the TARP intracellular C-tail regulate polyamine block and channel conductance, we examined various γ-2 C-tail mutants. We identified the membrane proximal region of the C terminus as crucial for full TARP-attenuation of polyamine block, whereas complete deletion of the C-tail markedly enhanced the TARP-induced increase in channel conductance; thus, the TARP C-tail influences ion permeation. Third, we identified a site in the pore-lining region of the AMPAR, close to its Q/R site, that is crucial in determining the TARP-induced changes in single-channel conductance. This conserved residue represents a site of TARP action, independent of the AMPAR LBD.

Keywords: AMPA receptors; TARP action; TARPs; calcium-permeable AMPARs; channel conductance; polyamine block.


Figures

Figure 1.
Figure 1.
Estimates of the diameter of the narrowest pore constriction of GluA1 and GluA1 + γ-2. A, Glutamate-evoked currents from homomeric GluA1 at different holding potentials between −40 and +40 mV (Δ10 mV) ([CsCl]int and [CsCl]ext both at 140 mm). Individual currents were activated by 100 ms applications of 1 mm glutamate plus 5 μm CTZ to an outside-out patch from a transfected tsA201 cell. Note that, even in the absence of added intracellular polyamines, some inward rectification remained. B, Glutamate-evoked currents recorded in the same conditions as in A in a patch from a cell expressing GluA1 + γ-2. C, I–V relationships constructed for the peak current responses shown in A and B. D, I–V relationships (−80 to −20 mV) for glutamate-evoked peak currents from cells expressing homomeric GluA1 and GluA1 + γ-2 in TEAext/CsClint conditions. E, Normalized permeability ratios of different organic cations relative to Cs+ for GluA1 and GluA1 + γ-2 channels. Mean values and SEM are shown; numbers in columns denote the number of patches. No differences between GluA1 and GluA1 + γ-2 were found with MA and DMA, but differences were seen with TMA, TEA, and NMDG. *p < 0.05, ***p < 0.001, unpaired two-tailed Welch t test. F, Relationship between the permeability of organic cations relative to Cs+ and their mean ionic diameter for GluA1 and GluA1 + γ-2. Symbols indicate mean values, and error bars denote ±SEM. The continuous and dashed lines are weighted fits to Equation 5 (see Materials and Methods), which gave the estimated pore diameters (and 95% CIs) shown in the inset.
Figure 2.
Figure 2.
Mutations in the γ-2 C-tail do not affect polyamine block or channel conductance. A, I–V relationships for peak glutamate-evoked (10 mm) responses recorded between −80 and +80 mV in outside-out patches from cells expressing GluA1 + wild-type γ-2 (n = 4) or GluA1 + γ-2(R204S) (n = 4). Error bars denote SEM. B, Pooled data showing the RI (measured as the peak current at +40 mV/peak current at −80 mV) for GluA1 + γ-2 and mutated versions of γ-2. Mean values and SEM are shown; numbers in columns denote the number of patches. The RI differed across the six groups (one-way ANOVA, F(8,14.5) = 6.74, p < 0.001). Differences between GluA1 alone and wild-type or mutant γ-2 are indicated (*p < 0.05, **p < 0.01, ***p < 0.001; unpaired Welch two-sample t tests with Holm's sequential Bonferroni correction). All mutants p > 0.05 compared with wild-type γ-2. C, Representative normalized G–V relationships for peak glutamate-evoked (10 mm) responses recorded between −110 and −10 mV in three outside-out patches from cells expressing GluA1, GluA1 + wild-type γ-2, or GluA1 + γ-2(204, -5, -6). Lines are fits to a Boltzmann equation (Eq. 3; see Materials and Methods). For the examples shown, V½ was shifted from −73.4 mV for GluA1 to −35.7 mV for GluA1 + wild-type γ-2 and to −34.4 mV for GluA1 + γ-2(204, -5, -6). D, Pooled data showing V½ values for GluA1 and GluA4 either alone or coexpressed with γ-2 or γ-2(204, -5, -6). Columns and error bars indicate mean values and SEM; numbers in columns denote the number of patches. Two-way ANOVA showed a significant main effect for the AMPAR (F(1,26) = 9.17, p < 0.01), a significant main effect for TARP (F(2,26) = 90.37, p < 0.001), and no significant interaction (F(2,26) = 0.14, p = 0.87). ***p < 0.001, differences between GluA1 alone and wild-type and mutant γ-2 (unpaired Welch two-sample t tests with Holm's sequential Bonferroni correction). E, Currents elicited by rapid application of 10 mm glutamate (200 ms) to an outside-out patch from a tsA201 cell (−60 mV) transfected with GluA1 + γ-2. A single raw trace (gray) is shown overlaid with the mean response (black). The inset shows the current–variance plot for the same recording. The fitted parabola (see Materials and Methods) gave a weighted single-channel conductance of 33.2 pS. Dashed line denotes background variance, and error bars denote SEM. F, Same as in E but for a patch from a cell expressing GluA1 + γ-2(R204S); the fitted parabola gave a weighted mean single-channel conductance of 28.7 pS. G, Pooled weighted mean single-channel conductance data from NSFA of GluA1 + wild-type and mutated versions of γ-2. Mean values and SEM are shown; numbers in bars denote the number of patches. Weighted mean conductance differed significantly across the six groups (one-way ANOVA, F(8,26.7) = 5.96, p < 0.001). Multiple pairwise comparisons (unpaired Welch two-sample t tests with Holm's sequential Bonferroni correction) revealed differences between GluA1 alone and GluA1 expressed with wild-type or mutant γ-2 (*p < 0.05, **p < 0.01, ***p < 0.001). All mutants p > 0.05 compared with wild-type γ-2.
Figure 3.
Figure 3.
C-tail deletion of γ-2 modifies TARP effects on polyamine block and single-channel conductance. A, I–V relationships for glutamate-evoked peak responses (10 mm) between −80 and +80 mV from outside-out patches expressing GluA4 homomers (n = 10), GluA4 + γ-2 (n = 7), and GluA4 + γ-2ΔC (n = 12). B, Plot of normalized conductance against voltage (Vm) for GluA4 homomeric receptors alone or with γ-2 or γ-2ΔC. Data were obtained from records in A. Lines are fits (at negative voltages) to a Boltzmann equation (see Materials and Methods). V½ is shifted from −57.6 mV for GluA4 to −26.2 mV for GluA4 + γ-2 and to −40.8 mV for GluA4 + γ-2ΔC. C, Pooled RI+40/−80 values for GluA4 homomers alone or with γ-2 or γ-2ΔC. Mean values and SEM are shown; numbers in columns denote the number of patches. The RI differed across the three groups (one-way ANOVA, F(2,12.06) = 23.5, p < 0.001). Multiple pairwise comparisons (unpaired Welch two-sample t tests with Holm's sequential Bonferroni correction) revealed significant differences between GluA1 alone and GluA1 expressed with wild-type or mutant γ-2 (**p < 0.01) and a significant difference between γ-2 and γ-2ΔC (##p < 0.01). D, Pooled values of desensitization kinetics (τw,des; details as for C). Desensitization differed across the three groups (F(2,18.22) = 7.89, p < 0.01). Multiple pairwise comparisons revealed differences between wild-type and mutant γ-2 compared with GluA1 alone (*p < 0.05, **p < 0.01) but no difference between γ-2 and γ-2ΔC. E, Pooled values of weighted mean single-channel conductance (details as for C). Channel conductance differed across the three groups (F(2,17.42) = 26.52, p < 0.001). Multiple pairwise comparisons revealed differences between GluA1 alone and GluA1 expressed with wild-type or mutant γ-2 (**p < 0.01, ***p < 0.001) and a difference between γ-2 and γ-2ΔC (#p < 0.05).
Figure 4.
Figure 4.
The proximal C-tail of γ-2 is necessary for maximal relief of polyamine block. A, Diagram of the TARP constructs used. Numbered regions 1–4 represent the transmembrane domains. γ-2 is shown as white and γ-6 as light gray. γ-2(1–228) has an equivalent length of C terminus as γ-6. B, Pooled data showing the voltage of half polyamine block (V½) as derived from Boltzmann fits of G–V relationships recorded from GluA1 coexpressed with the constructs shown in A. Mean values ± SEM are illustrated. The numbers in the columns denote the number of patches. V½ differed across the six groups (one-way ANOVA, F(5,8.72) = 57.4, p < 0.001). **p < 0.01, ***p < 0.001, differences from GluA1 alone (unpaired Welch two-sample t tests with Holm's sequential Bonferroni correction). V½ values with γ-2ΔC, γ-6, and γ-2/6 were different from those with wild-type γ-2 (#p < 0.05). V½ values were not different between γ-2(1–228) and wild-type γ-2 or between γ-2ΔC and γ-2/6.
Figure 5.
Figure 5.
Neutralizing charge at the Q/R +4 position of GluA1(D586N) reduces polyamine block of CP-AMPARs but does not affect TARP-induced attenuation of block. A, I–V relationships for glutamate-evoked peak responses (10 mm) between −80 and +80 mV in outside-out patches from cells expressing GluA1 homomers (n = 11) and GluA1 + γ-2 (n = 9). Symbols indicate the mean and error bars (when visible) ± SEM. B, As for A but with GluA1(D586N) homomers (n = 7) and GluA1(D586N) + γ-2 (n = 5). C, Pooled RI+40/−80 values for GluA1 and GluA1(D586N) homomers alone and with γ-2. Mean values and SEM are shown; numbers in bars denote the number of patches. Two-way ANOVA revealed a significant main effect of AMPAR mutation (F(1,28) = 135.67, p < 0.001), a significant main effect of TARP (F(1,28) = 32.68, p < 0.001), and a significant interaction between AMPAR and TARP (F(1,28) = 8.88, p < 0.01). *p < 0.05, ***p < 0.001, results of pairwise comparisons (unpaired Welch two-sample t tests with Holm's sequential Bonferroni correction).
Figure 6.
Figure 6.
Mutations of GluA1 D586 alter both single-channel conductance and TARP modulation of conductance. A, Currents elicited by rapid application of 10 mm glutamate (200 ms) to an outside-out patch from a tsA201 cell (−60 mV) transfected with GluA1(D586N). A single raw trace (gray) is shown overlaid with the mean response (black). The inset shows the current–variance plot for the same recording. The fitted parabola (see Materials and Methods) gave a weighted single-channel conductance of 6.9 pS. Dashed line denotes background variance, and error bars denote SEM. B, Same as A but for a patch from a cell expressing GluA1(D586N) + γ-3, giving a weighted mean single-channel conductance of 7.6 pS. Note the slowed desensitization and increased steady-state current when compared with GluA1(D586N) alone. C, Same as in A but a 100 ms application to a patch from a cell expressing GluA1(D586K), giving a weighted mean single-channel conductance of 4.8 pS. D, Same as for C but for a patch from a cell expressing GluA1(D586K) + γ-3, giving a weighted mean single-channel conductance of 1.0 pS. Note the slowed desensitization and increased steady-state current compared with GluA1(D586K) alone. E, Pooled data showing the effect of mutations D586N and D586K on the conductance of GluA1 and on the actions of TARPs γ-2 and γ-3. Mean values and SEM are shown; numbers in columns denote the number of patches. Two-way ANOVA revealed a significant main effect of AMPAR mutation (F(2,62) = 254.44, p < 0.001), a significant main effect of TARPs (F(2,62) = 8.70, p < 0.001), and a significant interaction between AMPAR and TARP (F(4,62) = 9.03, p < 0.001). Pairwise comparisons for each of the GluA1 forms (unpaired Welch two-sample t tests with Holm's sequential Bonferroni correction) showed that TARPs γ-2 and γ-3 increased the conductance of GluA1, had no effect on the conductance of GluA1(D586N), but decreased the conductance of GluA1(D586K) (*p < 0.05, **p < 0.01). The conductance of both GluA1(D586N) and GluA1(D586K) was less than that of wild-type GluA1 (###p < 0.001). F, Pooled data showing the effect of mutations D586N and D586K on the actions of TARPs γ-2 and γ-3 on desensitization kinetics (presentation and tests as in E). Two-way ANOVA revealed a significant main effect of AMPAR mutation (F(2,65) = 13.59, p < 0.001), a significant main effect of TARPs (F(2,65) = 43.52, p < 0.001), and no significant interaction between AMPAR and TARP (F(4,65) = 9.03, p = 0.38). Pairwise comparisons for each of the GluA1 forms showed that TARPs γ-2 and γ-3 increased τw,des in all cases (*p < 0.05, **p < 0.01, ***p < 0.001).

References

    1. Bats C, Soto D, Studniarczyk D, Farrant M, Cull-Candy SG. Channel properties reveal differential expression of TARPed and TARPless AMPARs in stargazer neurons. Nat Neurosci. 2012;15:853–861. doi: 10.1038/nn.3107. - DOI - PMC - PubMed
    1. Bowie D. Redefining the classification of AMPA-selective ionotropic glutamate receptors. J Physiol. 2012;590:49–61. - PMC - PubMed
    1. Burnashev N, Monyer H, Seeburg PH, Sakmann B. Divalent ion permeability of AMPA receptor channels is dominated by the edited form of a single subunit. Neuron. 1992;8:189–198. doi: 10.1016/0896-6273(92)90120-3. - DOI - PubMed
    1. Burnashev N, Villarroel A, Sakmann B. Dimensions and ion selectivity of recombinant AMPA and kainate receptor channels and their dependence on Q/R site residues. J Physiol. 1996;496:165–173. - PMC - PubMed
    1. Chu PJ, Robertson HM, Best PM. Calcium channel gamma subunits provide insights into the evolution of this gene family. Gene. 2001;280:37–48. doi: 10.1016/S0378-1119(01)00738-7. - DOI - PubMed

Publication types