. 2014 Oct;114(6):1385-97.
doi: 10.1093/aob/mcu172. Epub 2014 Aug 27.

Structures formed by a cell membrane-associated arabinogalactan-protein on graphite or mica alone and with Yariv phenylglycosides

Affiliations

Structures formed by a cell membrane-associated arabinogalactan-protein on graphite or mica alone and with Yariv phenylglycosides

Li Hong Zhou et al. Ann Bot. 2014 Oct.

Abstract

Background: Certain membrane-associated arabinogalactan-proteins (AGPs) with lysine-rich sub-domains participate in plant growth, development and resistance to stress. To complement fluorescence imaging of such molecules when tagged and introduced transgenically to the cell periphery and to extend the groundwork for assessing molecular structure, some behaviours of surface-spread AGPs were visualized at the nanometre scale in a simplified electrostatic environment.

Methods: Enhanced green fluorescent protein (EGFP)-labelled LeAGP1 was isolated from Arabidopsis thaliana leaves using antibody-coated magnetic beads, deposited on graphite or mica, and examined with atomic force microscopy (AFM).

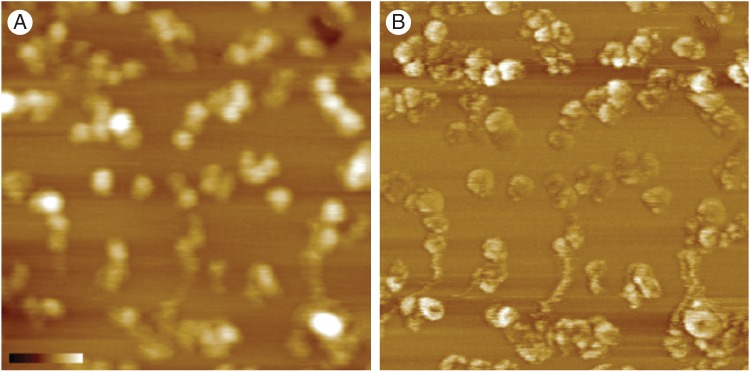
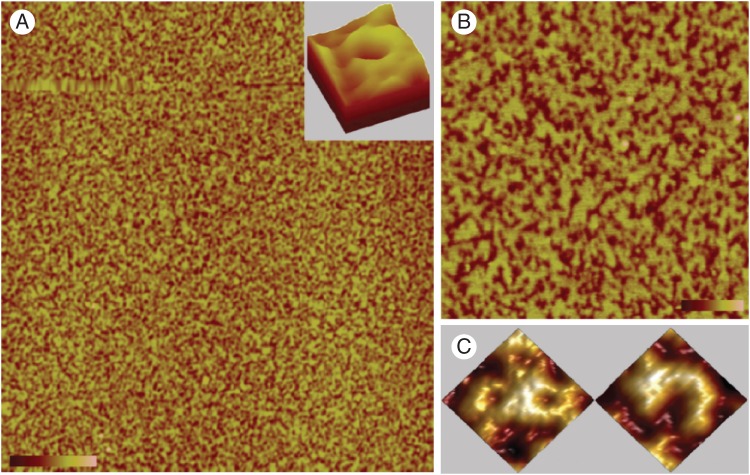
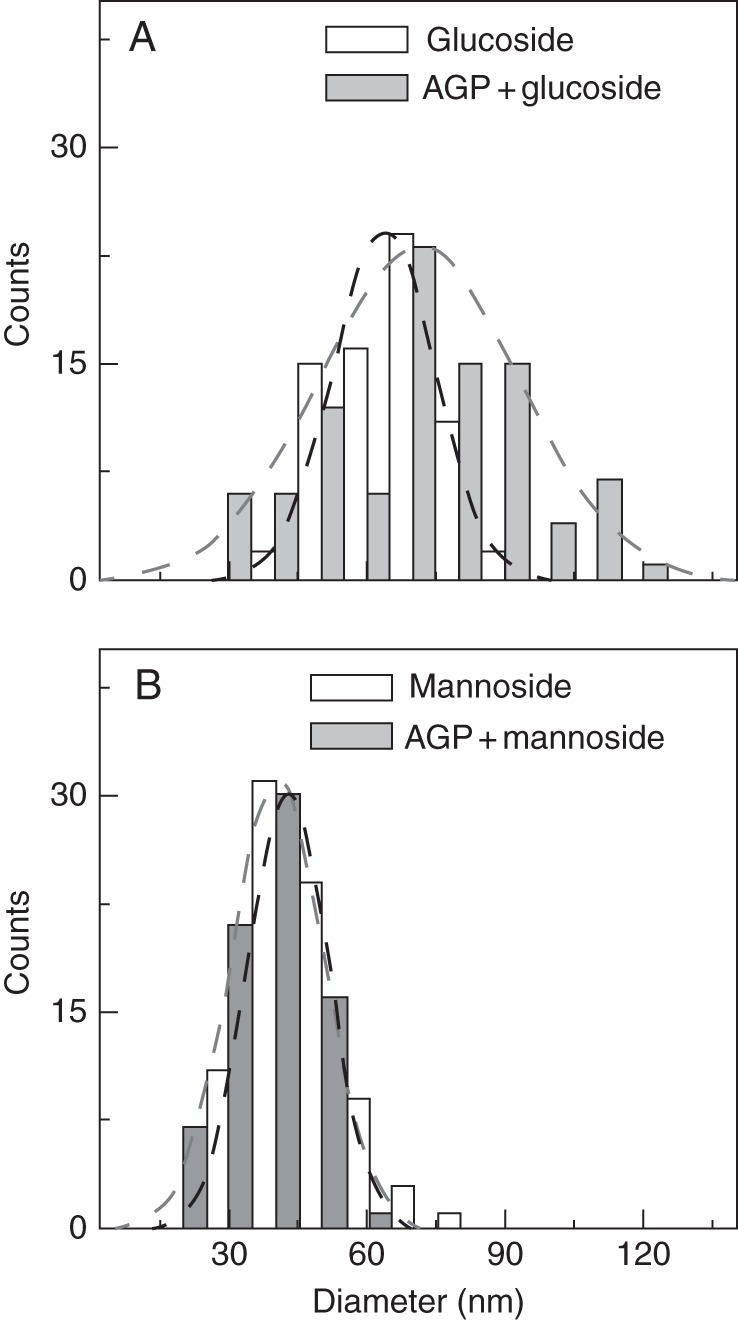
Key results: When deposited at low concentration on graphite, LeAGP can form independent clusters and rings a few nanometres in diameter, often defining deep pits; the aperture of the rings depends on plating parameters. On mica, intermediate and high concentrations, respectively, yielded lacy meshes and solid sheets that could dynamically evolve arcs, rings, 'pores' and 'co-pores', and pits. Glucosyl Yariv reagent combined with the AGP to make very large and distinctive rings.

Conclusions: Diverse cell-specific nano-patterns of native lysine-rich AGPs are expected at the wall-membrane interface and, while there will not be an identical patterning in different environmental settings, AFM imaging suggests protein tendencies for surficial organization and thus opens new avenues for experimentation. Nanopore formation with Yariv reagents suggests how the reagent might bind with AGP to admit Ca(2+) to cells and hints at ways in which AGP might be structured at some cell surfaces.

Keywords: Arabidopsis thaliana; EGFP; LeAGP1; Plant cell walls; Yariv phenylglycoside; atomic force microscopy; glycoprotein cluster; glycoprotein mesh; lysine-rich arabinogalactan-protein; nanopore; periplasm.


Figures

Fig. 1.
Fig. 1.
KRR-AGP is arrayed in distinctive patterns at the exterior side of the cell membrane. The image is a confocal micrograph of cells near the tip of a light-grown hypocotyl of arabidopsis expressing a tomato gene linked to a promoter from Cauliflower mosaic virus. The tomato protein is homologous to three arabidopsis AGPs. This figure is introduced to suggest that resolution of form by AFM and confocal microscopy will be complementary for analysis of biological deployment despite large differences in limit of resolution. Perhaps because the expression level in this transgenic line is low, at least after carrying through several generations, no evidence was found for retention of the AGP inside the cytoplasm. Scale bar = 20 μm.
Fig. 2.
Fig. 2.
Clusters form on graphite. (A) This excerpt from a 2 × 2 μm scan of a relatively large area emphasizes that the AGP forms clusters well distributed across a graphite surface. Preparation details: 20 μL of LeAGP1–EGFP drawn from a solution of 10 pm glycoprotein dissolved in 2 m NaCl were deposited on graphite. Adherence of AGP to the graphite surface and development of structure were allowed for 15 min. The graphite chip was then washed with 300 μL of water and dried for 2 min with flowing N2 before scanning. The colour scale bar indicates a height of 0–6 nm from the lowest part of the graphite surface and is 400 nm long. (B) The 3-D displays of selected clusters from the left image help to visualize the organization of individual clusters. Each display is 200 nm per side.
Fig. 3.
Fig. 3.
The height of ‘nanopores’ on graphite can depend on incubation time. AGP was dissolved in 0·4 m CaCl2 at 10 pm, and 20 μL was deposited on graphite for 15 min (left) or 30 min (right); note differences in scale reported below. ‘Nanopores’ were typically taller following the 30 min deposition. Below the scans are selected displays of single clusters within the scans, with dotted lines to indicate where the illustrated transections were taken. The left inset display is 70 nm per side, whereas the right is 106 nm. Extremely limited early deposition was observed in three of five replicates of the left scan, and two showed the relatively low structures illustrated. Large deposits of taller structures were seen in all three replicates of the right scan. It is important to appreciate that the scanning procedure tends to yield sharper images for taller topographies. The large streaks on the right scan are probabely a result of protein drag by the AFM scanning tip. The colour bar in the left scan indicates 50 nm length and 0–3 nm height from the graphite surface, and in the right scan 100 nm length and 0–6 nm height. The left scan size is 500 × 500 nm, and the right is 1000 × 1000 nm.
Fig. 4.
Fig. 4.
Phase images confirm radial inhomogeneity of clusters on graphite. The phase image (B) indicates radial inhomogeneity of cluster structure that cannot be resolved in the corresponding topographic image (A) of these relatively short structures. The colour bar indicates a height range of 0–5 nm from the graphite surface in the topographic image on the left and is 100 nm long, whereas for the right image of the identical area, the colour bar represents a range of 0–10° phase shift. The graphite chip was prepared by depositing 2 μL of a 100 pm solution of AGP in 2 m NaCl, waiting 15 min, and then rinsing and drying as in Fig. 1. Streaks may be artefacts due to dragging of protein by the scanning tip. Scan size 500 × 500 nm.
Fig. 5.
Fig. 5.
Lacy sheets on mica are comprised of ‘nanoarcs’ and ‘nanopores’. A deposit of 10 μL of 1 nm AGP in 2 m CaCl2 solution was incubated on mica for 10 min, washed and dried, and maintained in air of 40–50 % relative humidity for 12 h. Initially the sheet was quite smooth in appearance. When re-inspected after 12 h, the molecules formed the pattern seen here. (A) A 5 × 5 μm scan. The colour scale bar represents 2 nm of topological variation and is 300 nm long. The 3-D inset, an enlargement from this scan, is 180 nm per side and indicates that the rim of the pore rests atop a significant layer of AGP. (B) A subsequent 1 × 1 μm scan of a portion of a region within the region plotted in the left panel. The colour scale bar represents 2 nm of topological variation and is 200 nm long. Enlargements (C) are 75 nm on a side.
Fig. 6.
Fig. 6.
‘Pseudocrystals’ form when LeAGP1 reacts with β-d-glucosyl Yariv reagent in solution. (A) After a 20 μL deposit of 10 pm AGP dissolved in 2 m NaCl on graphite was incubated for 15 min, a 20 μL aliquot of 1 μm glucosyl Yariv reagent was added and another 15 min incubation was allowed. The chip was rinsed with 300 μL of water and dried with N2 for 2 min. Large discrete ‘towers’ of ‘pseudocrystals’ formed. One of the three replicates was rescanned after 2 and 3 d, and the towers did not change form over this period. The colour bar represents 0–100 nm height from the graphite surface and 1 mm length. Scan area 5 × 5 μm. The inserted 3-D figure of a typical tower is 300 nm on each side of its base. (B) Pseudocrystal tower heights were not haphazard. A distribution of tower heights is shown as a bar graph and as a line distribution. A transection of the tower from the inset of the left panel is shown as a graphical insert on the right.
Fig. 7.
Fig. 7.
‘Nanopores’ form when the AGP reacts with β-d-glucosyl or β-d-mannosyl Yariv reagent dried on graphite. Upper scans: AGP was plated and incubated as for Figs 2 and 6 and then dried as for Fig. 2. Next, as in Fig. 6, either glucoside (left) or mannoside (right) was added and incubation was permitted for 15 min before rinsing with 300 μL of water and drying. Lower scans: as controls, glucoside and mannoside were added to graphite, without AGP, followed by incubation, rinsing and drying. Combination of the AGP with the glucoside (upper left) yields many relatively large ‘nanopores’. Smaller ‘nanopores’ also occur after combination of AGP and mannoside (upper right). Controls present ‘nanopores’ in the smaller size range (lower left and lower right). The colour bar indicates a range of 0–6 nm of height from the graphite surface in each control image. The length of the colour bar corresponds to 400 nm; each scan was 2 × 2 μm. Enlarged 3-D images shown beneath each 2 × 2 μm scan are of ‘nanopores’ formed under each of the four experimental conditions. Each 3-D enlargement is 200 nm per side, and is presented in an orientation chosen to highlight detail. Note: cleavage planes of the graphite are evident, and in the top right and bottom left scans some scratches on the graphite surface are evident.
Fig. 8.
Fig. 8.
β-d-Glucosyl but not β-d-mannosyl Yariv reacts with AGP to form enlarged rings. Diameters for the populations of rings in the four scans of Fig. 7 and replicates were measured from the middle of the rim. Although diameter is plotted because it was the measured parameter, the area (which rises as the square of the diameter) may be the more biologically interesting value. Diameters are at 10 nm wide intervals but columns are at half that size to allow the two treatments to be shown together. (A) Glucoside; (B) mannoside. Gaussian trend-lines were fitted to the histograms using a least-squares algorithm.

References

    1. Cannon MC, Terneus K, Hall Q, et al. Self-assembly of the plant cell wall requires an extensin scaffold. Proceedings of the National Academy of Sciences of the United States of America. 2008;105:2226–2231. - PMC - PubMed
    1. Delcour AH. Function and modulation of bacterial porins: insights from electrophysiology. FEMS Microbiology Letters. 1997;151:115–123. - PubMed
    1. Demuro A, Smith M, Parker I. Single-channel Ca2+ imaging implicates Aβ1–42 amyloid pores in Alzheimer's disease pathology. Journal of Cell Biology. 2011;195:515–524. - PMC - PubMed
    1. Ding JP, Pickard BG. Mechanosensory calcium-selective cation channels in epidermal cells. The Plant Journal. 1993a;3:83–110. - PubMed
    1. Ding JP, Pickard BG. Modulation of mechanosensitive calcium-selective cation channels by temperature. The Plant Journal. 1993b;3:713–720. - PubMed

Publication types

MeSH terms