Comparative Study
. 2014 Aug 28;512(7515):445-8.
doi: 10.1038/nature13424.

Comparative analysis of the transcriptome across distant species

Mark B Gerstein  1 Joel Rozowsky  2 Koon-Kiu Yan  2 Daifeng Wang  2 Chao Cheng  3 James B Brown  4 Carrie A Davis  5 LaDeana Hillier  6 Cristina Sisu  2 Jingyi Jessica Li  7 Baikang Pei  2 Arif O Harmanci  2 Michael O Duff  8 Sarah Djebali  9 Roger P Alexander  10 Burak H Alver  11 Raymond Auerbach  10 Kimberly Bell  12 Peter J Bickel  13 Max E Boeck  14 Nathan P Boley  15 Benjamin W Booth  16 Lucy Cherbas  17 Peter Cherbas  17 Chao Di  18 Alex Dobin  12 Jorg Drenkow  12 Brent Ewing  14 Gang Fang  10 Megan Fastuca  12 Elise A Feingold  19 Adam Frankish  20 Guanjun Gao  18 Peter J Good  19 Roderic Guigó  21 Ann Hammonds  16 Jen Harrow  20 Roger A Hoskins  16 Cédric Howald  22 Long Hu  18 Haiyan Huang  13 Tim J P Hubbard  23 Chau Huynh  14 Sonali Jha  12 Dionna Kasper  24 Masaomi Kato  25 Thomas C Kaufman  26 Robert R Kitchen  10 Erik Ladewig  27 Julien Lagarde  21 Eric Lai  27 Jing Leng  10 Zhi Lu  18 Michael MacCoss  14 Gemma May  28 Rebecca McWhirter  29 Gennifer Merrihew  14 David M Miller  29 Ali Mortazavi  30 Rabi Murad  30 Brian Oliver  31 Sara Olson  32 Peter J Park  11 Michael J Pazin  19 Norbert Perrimon  33 Dmitri Pervouchine  21 Valerie Reinke  24 Alexandre Reymond  34 Garrett Robinson  13 Anastasia Samsonova  33 Gary I Saunders  35 Felix Schlesinger  12 Anurag Sethi  10 Frank J Slack  25 William C Spencer  29 Marcus H Stoiber  15 Pnina Strasbourger  14 Andrea Tanzer  36 Owen A Thompson  14 Kenneth H Wan  16 Guilin Wang  24 Huaien Wang  12 Kathie L Watkins  29 Jiayu Wen  27 Kejia Wen  18 Chenghai Xue  12 Li Yang  37 Kevin Yip  38 Chris Zaleski  12 Yan Zhang  10 Henry Zheng  10 Steven E Brenner  39 Brenton R Graveley  8 Susan E Celniker  40 Thomas R Gingeras  5 Robert Waterston  6
Affiliations
Comparative Study

Comparative analysis of the transcriptome across distant species

Mark B Gerstein et al. Nature. .

Abstract

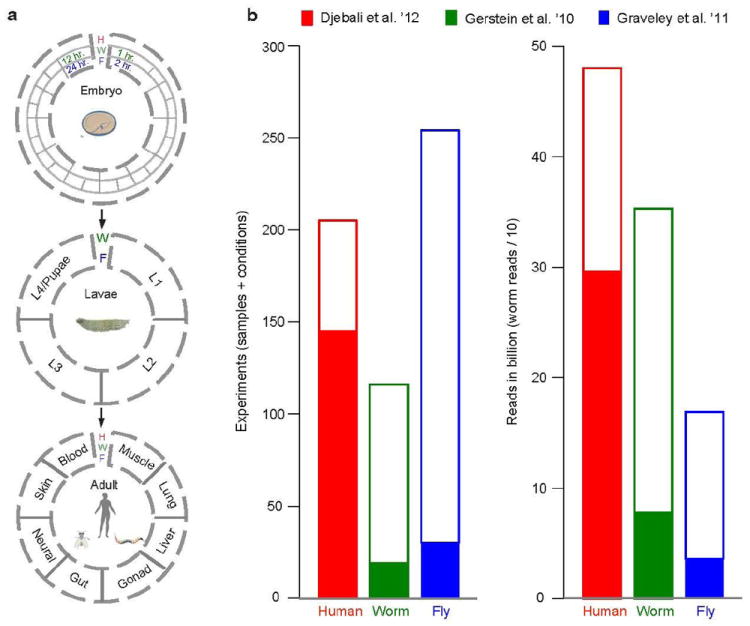
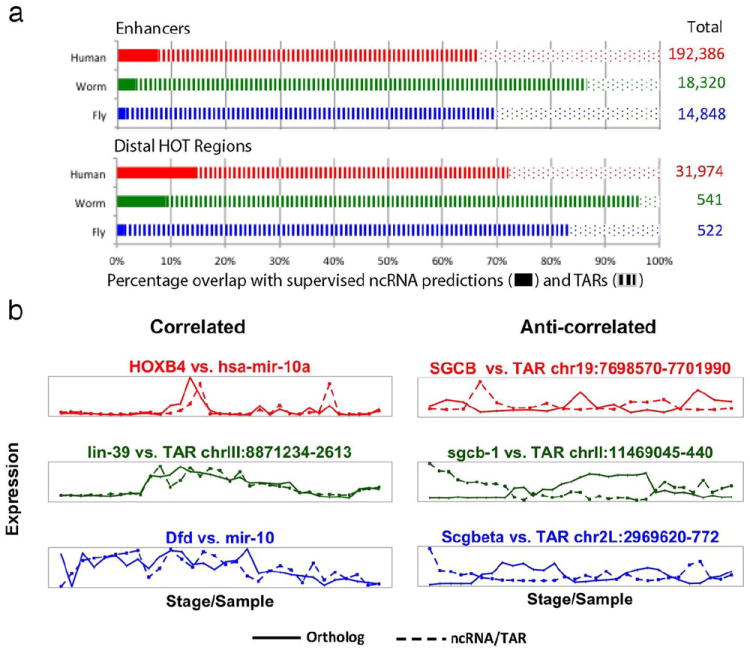
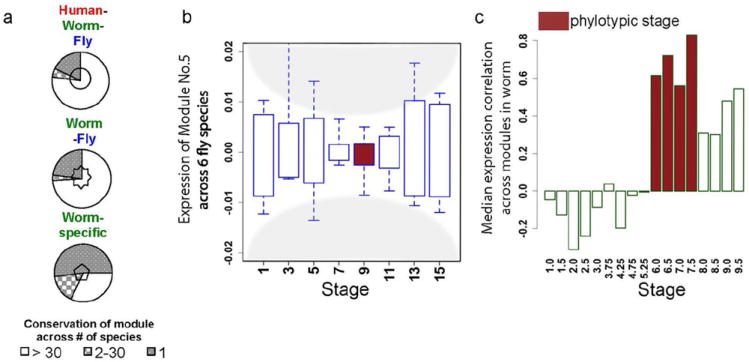
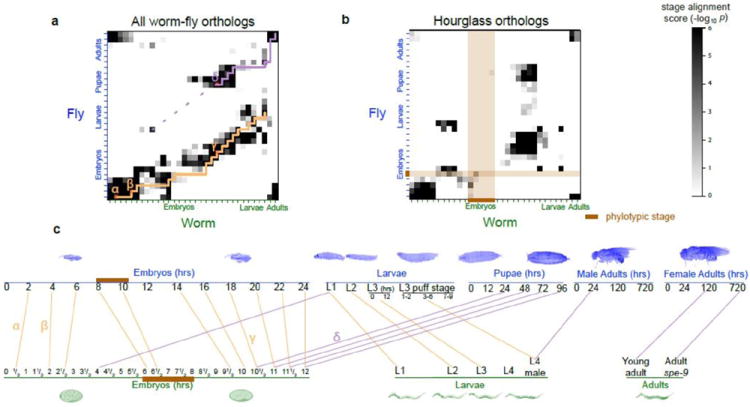
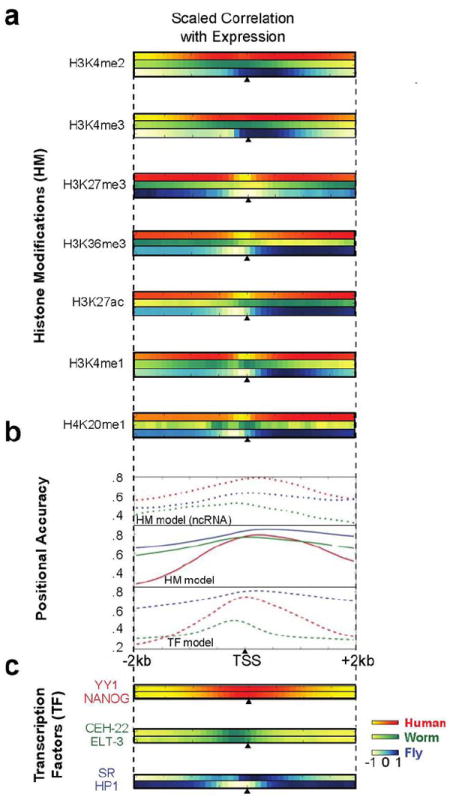
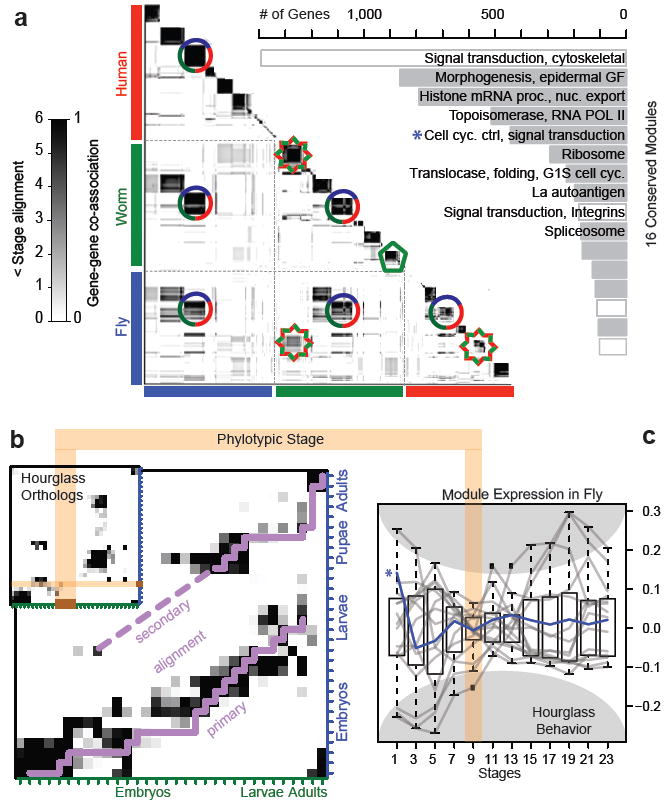
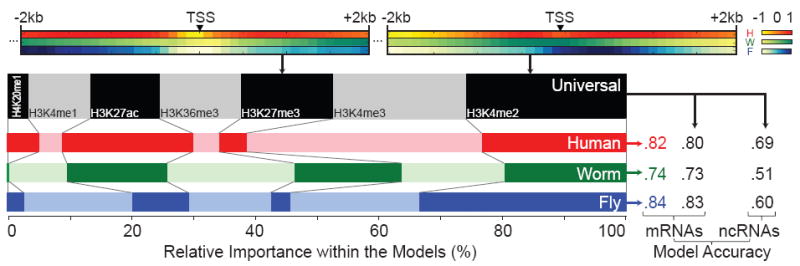
The transcriptome is the readout of the genome. Identifying common features in it across distant species can reveal fundamental principles. To this end, the ENCODE and modENCODE consortia have generated large amounts of matched RNA-sequencing data for human, worm and fly. Uniform processing and comprehensive annotation of these data allow comparison across metazoan phyla, extending beyond earlier within-phylum transcriptome comparisons and revealing ancient, conserved features. Specifically, we discover co-expression modules shared across animals, many of which are enriched in developmental genes. Moreover, we use expression patterns to align the stages in worm and fly development and find a novel pairing between worm embryo and fly pupae, in addition to the embryo-to-embryo and larvae-to-larvae pairings. Furthermore, we find that the extent of non-canonical, non-coding transcription is similar in each organism, per base pair. Finally, we find in all three organisms that the gene-expression levels, both coding and non-coding, can be quantitatively predicted from chromatin features at the promoter using a 'universal model' based on a single set of organism-independent parameters.


Conflict of interest statement

The authors declare no competing financial interests.

Figures

Fig ED1
Fig ED1. Overview of the data
(A) Schematic of the RNA-seq data generated for human (red), worm (green), and fly (blue), showing how it samples developmental stages and various tissues and cell lines. (B) The number and size of data sets generated. The amount of new data beyond that in the previous ENCODE publications[8, 11, 20] is indicated by white bars, with previous ENCODE data indicated by solid bars. (See Supplement section B.2 for a detailed description of these data.)
Fig ED2
Fig ED2. Summary plots for the protein-coding gene annotations
(A) Distributions of key summary statistics - gene span, longest ORF per gene, CDS exon length, and CDS exons per gene; note that the x axes are in log scale. Both fly and worm genes span similar genomic lengths while human genes span larger regions (mostly due to the size of human introns). (B) Left: Venn diagram of protein domains (from the Pfam database version 26.0) present in annotated protein-coding genes in each species. Right: Shared domain combinations. (For more information on domain combinations, see Fig S1h and Supplement section B.4.1.)
Fig ED3
Fig ED3. Summary of annotated ncRNAs, TARs, and ncRNA predictions in each species
The number of elements, the base pairs covered and the fraction of the genome for each class (see also Supplement section C). There are comparable numbers of tRNAs in humans and worms but about half as many in fly. While the number of lncRNAs in human is more than an order of magnitude greater than in either worms or flies, the fractional genomic coverage in all three species is similar. Finally, humans have at least 5-fold more miRNAs, snoRNAs and snRNAs compared to worm or fly. The fraction of the genome covered by TARs (highlighted squares) for each species is similar. A large amount of non-canonical transcription occurs in the introns of annotated genes, presumably representing a mixture of unprocessed mRNAs and internally initiated transcripts. The remaining non-canonical transcription (249Mb, 16Mb, and 14Mb in human, worm, and fly) is intergenic and occurs at low levels, comparable to that observed for introns (Table S2). Overall, the fraction of the genome transcribed -- including intronic, exonic, and non-canonical transcription -- is consistent with that previously reported for human despite the methodological differences in the analysis (Fig. S2, Supplement section C).
Fig ED4
Fig ED4. Analysis of Alternative Splicing
(A) Representative orthologous genes do not share the same exon/intron structure or alternative splicing across species. (B) Distribution of the number of isoforms per gene. (C) Comparison of the fraction of various alternative splicing event classes in human, worm, and fly -- skipped exons “SE”, retained introns “RI”, alternative 3' splice sites “A3SS”, alternative 5' splice sites “A5SS”, alternative first exons “AFE”, alternative last exons “ALE”, tandem 3' UTRs “TandemUTR”, coordinately skipped exons “CSE”, and mutually exclusive exons “MXE”. (See Supplement section B.5 for a further discussion of splicing.)
Fig ED5
Fig ED5. Characterizing Non-canonical Transcription
(A) The overlap of enhancers and distal HOT regions with supervised ncRNA predictions and TARs in human, worm, and fly. The overlap of enhancers and distal HOT regions with respect to both supervised ncRNA predictions as well as TARs are significantly enriched compared to a randomized expectation. (B) The left side highlights ncRNA/TARs that are highly correlated with corresponding HOX orthologues in human (HOXB4), worm (lin-39), and fly (Dfd). The expression of mir-10 correlates strongly with Dfd in fly (r=0.66, p<6e-4 in fly), as does mir-10a in human, which correlates strongly with HOXB4 (r=0.88, p<2e-9). A TAR (chrIII:8871234-2613) strongly correlates with lin-39 (r=0.91, p<4e-13) in worm. The right side shows TARs in human (chr19:7698570-7701990), worm (chrII:11469045-440), and fly (chr2L:2969620-772) that are negatively correlated with the expression of three orthologous genes: SGCB (r=-0.91, p<3e-16), sgcb-1 (r=-0.86, p<2e-7), and Scgb (r=-0.82, p<4e-8), respectively. (More details on all parts of this figure are in Supplement section C and Table S2.)
Fig ED6
Fig ED6. Details on Expression Clustering
(A) Pie charts showing gene conservation across 56 Ensembl species for the blocks in the Fig. 1 heatmap enclosed with the same symbol (i.e. pentagon here matches pentagon in Fig.1a). Overall, species-specific modules tend to have fewer orthologs across 56 Ensembl species. (B) The expression levels of a conserved module (Module No. 5) in D. melanogaster and its orthologous counterparts in other 5 Drosophila species are plotted against time. The x-axis represents the middle time points of two-hour periods at fly embryo stages. The boxes represent the log10 modular expression levels from microarray data of 6 Drosophila species centered by their medians. The modular expression divergence (inter-quartile region) becomes minimal during the fly phylotypic stage (brown, 8-10 hours). (C) The modular expression correlations over a sliding 2-hour window (Pearson correlation per 5 stages, middle time of two-hour period in x-axis) among 16 modules in worm are plotted. The modular correlations (median shown as bar height in y-axis) are highest during the worm phylotypic stages (brown), 6-8 hours. One can, in fact, directly see this coordination as a local maximum in the between-module correlation for the worm, which has a more densely sampled developmental time course. (This figure provides more detail on Fig. 1a and 1c. More details on all parts of this figure are in Supplement section D and Figure S3.)
Fig ED7
Fig ED7. Details on Stage Alignment
This figure provides further detail beyond Fig. 1b. (A) An alignment of worm and fly developmental stages based on all worm-fly orthologs (11,403 pairs, including one-to-one, one-to-many, many-to-many pairs). (B) Alignment of worm and fly developmental stages based on just worm-fly hourglass orthologs. Note the prominent gap in the aligned stages coincides with the worm and fly phylotypic stages (brown band). This make sense: since the expression values of genes in all hourglass modules converge at the phylotypic stage, no hourglass genes can be phylotypic-stage specific, and hence, the gap. (C) Key aligned stages from part (A). The correspondence between parts (A) and (C) is indicated by the small Greek letters. Worm “early embryo” and “late embryo” stages are matched with fly “early embryo” and “late embryo” respectively in the “lower diagonal” set of matches, and they are also matched with fly “L1” and “prepupa-pupa” stages respectively in the “upper diagonal” set of matches. (More details on all parts of this figure are in Supplement section D.4 and Table S3.)
Fig ED8
Fig ED8. Further Detail on Statistical Models for Predicting Gene Expression
This figure provides further information beyond that in Fig. 2. Binding/expression correlations of (A) various histone marks and (C) TFs. For instance, H3K36me3 shows positive correlation in worm and fly, but weak negative correlation in human at the promoter, with positive correlation over the gene body. (B) The positional accuracy from the TF and histone-mark models for predicting mRNA and ncRNA expression about the TSS. (More details on all parts of this figure are in Supplement section E and Fig. S4.)
Fig ED9
Fig ED9. Average predictive accuracy of models with different number of randomly selected TFs
We randomly selected n TFs as predictors and examined the predictive accuracy by cross-validation, where n varied from 2 to 28. The curve shows the average predictive accuracy (Fig. S4 indicates the standard deviation of all models with the same number of predictors). Surprisingly, models with as few as 5 TFs have predictive accuracy. This may reflect an intricate, correlated structure to regulation. However, it could also be that open chromatin is characteristic of gene expression and TFs bind somewhat indiscriminately. (More details on all parts of this figure are in Supplement section E.)
Fig 1
Fig 1. Expression Clustering
(A) Left: Human, worm, and fly gene-gene co-association matrix; darker coloring reflects the increased likelihood that a pair of genes are assigned to the same module. A dark block along the diagonal represents a group of genes within a species. If this is associated with an off-diagonal block then it is a cross-species module (e.g. a three-species conserved module is shown with a circle and a worm-fly module, with a star). However, if a diagonal block has no off-diagonal associations, then it forms a species-specific module (e.g. green pentagon). Right: The GO functional enrichment of genes within the 16 conserved modules is shown. (B) Alignment of worm-and-fly developmental stages based on all worm-fly orthologs. Inset shows worm-fly stage alignment using only hourglass orthologs is more significant and exhibits a gap (brown) matching the phylotypic stage. (C) Normalized expression of the conserved modules in fly shows the smallest intra-organism divergence during the phylotypic stage (brown). (See Figs. ED 6 and 7 for further details.)
Fig 2
Fig 2. Histone Models for Gene Expression
Top: Normalized correlations of two representative histone marks with expression. Left: Relative importance of the histone marks in organism-specific models and the universal model. Right: Prediction accuracies (Pearson correlations all significant, p<1e-100) of the organism-specific and universal models. (See Figs. ED 8 and 9 for further details.)

Comment in

  • Genomics: Hiding in plain sight.
    Muerdter F, Stark A. Muerdter F, et al. Nature. 2014 Aug 28;512(7515):374-5. doi: 10.1038/512374a. Nature. 2014. PMID: 25164742 No abstract available.

References

    1. Brawand D, et al. The evolution of gene expression levels in mammalian organs. Nature. 2011;478:343–8. - PubMed
    1. Merkin J, Russell C, Chen P, Burge CB. Evolutionary dynamics of gene and isoform regulation in Mammalian tissues. Science. 2012;338:1593–9. - PMC - PubMed
    1. Barbosa-Morais NL, et al. The evolutionary landscape of alternative splicing in vertebrate species. Science. 2012;338:1587–93. - PubMed
    1. Levin M, Hashimshony T, Wagner F, Yanai I. Developmental milestones punctuate gene expression in the Caenorhabditis embryo. Dev Cell. 2012;22:1101–8. - PubMed
    1. Kalinka AT, et al. Gene expression divergence recapitulates the developmental hourglass model. Nature. 2010;468:811–4. - PubMed

Publication types

MeSH terms

Grants and funding

LinkOut - more resources