Comparative Study
. 2014 Aug 28;512(7515):453-6.
doi: 10.1038/nature13668.

Comparative analysis of regulatory information and circuits across distant species

Affiliations
Comparative Study

Comparative analysis of regulatory information and circuits across distant species

Alan P Boyle et al. Nature. .

Abstract

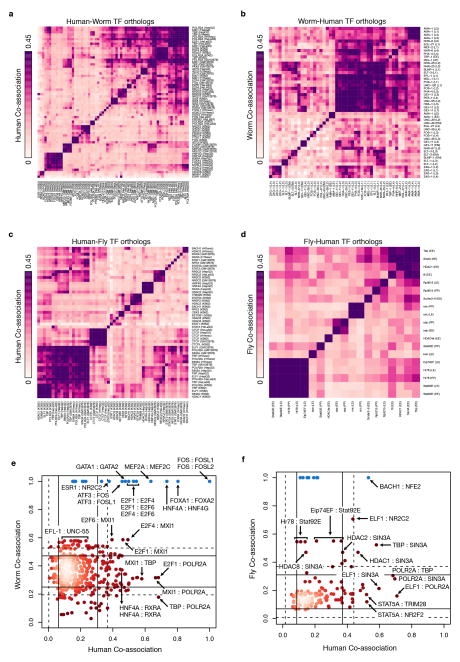
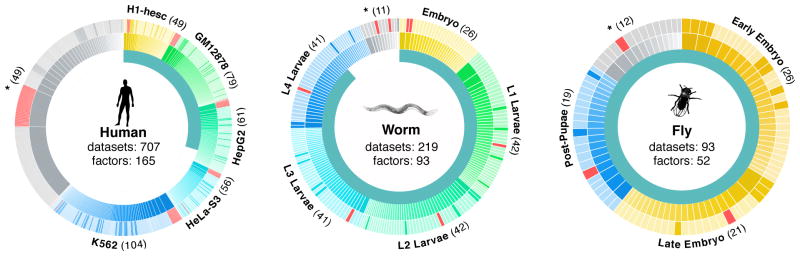
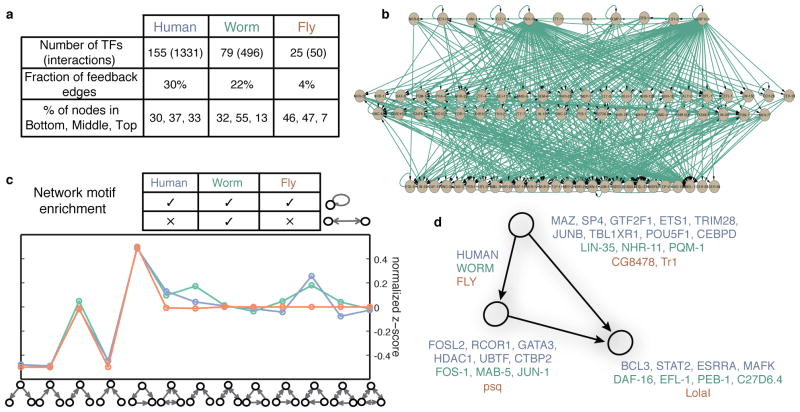
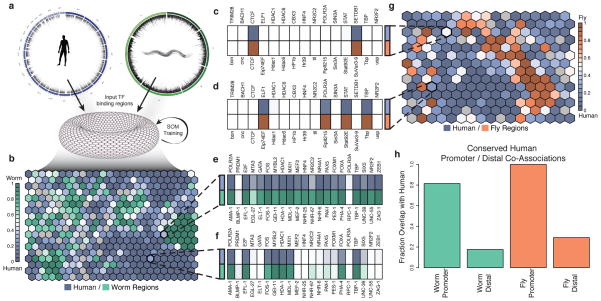
Despite the large evolutionary distances between metazoan species, they can show remarkable commonalities in their biology, and this has helped to establish fly and worm as model organisms for human biology. Although studies of individual elements and factors have explored similarities in gene regulation, a large-scale comparative analysis of basic principles of transcriptional regulatory features is lacking. Here we map the genome-wide binding locations of 165 human, 93 worm and 52 fly transcription regulatory factors, generating a total of 1,019 data sets from diverse cell types, developmental stages, or conditions in the three species, of which 498 (48.9%) are presented here for the first time. We find that structural properties of regulatory networks are remarkably conserved and that orthologous regulatory factor families recognize similar binding motifs in vivo and show some similar co-associations. Our results suggest that gene-regulatory properties previously observed for individual factors are general principles of metazoan regulation that are remarkably well-preserved despite extensive functional divergence of individual network connections. The comparative maps of regulatory circuitry provided here will drive an improved understanding of the regulatory underpinnings of model organism biology and how these relate to human biology, development and disease.


Conflict of interest statement

Completing Financial Interests

MPS is a cofounder and scientific advisory board (SAB) member of Personalis. MPS is on the SAB of Genapsys.

Figures

Extended Data Figure 1
Extended Data Figure 1. Outline of data processing pipeline
All data sets were processed using a uniform processing pipeline with identical alignment and filtering criteria and standardized IDR peak calling using SPP (Human + Worm) and MACS2 (Fly).
Extended Data Figure 2
Extended Data Figure 2. Motifs
(a) 32 TF gene families with a binding dataset for at least two species (names abbreviated). Cross enrichment indicates the enrichment of motifs from one species in the datasets of another. For 13 families, we observed no cross enrichment (red). For 7 families (blue) we observed cross enrichment and for an additional 12 (green) we also had matching motifs. For two cases marked by an asterisk a known fly motif matches the human motif but no worm motif matches. (b) PRDM1/Blimp-1/blmp-1 gene family. We discovered a motif in worm datasets that match literature derived known motifs from human and fly. (c) All three motifs are highly similar and enriched in human PRDM1 and worm blmp-1 datasets. Cell-type and treatment are indicated for each dataset in parenthesis. Enrichments in each box are the fraction of motif instances that are inside the bound regions and dividing that by the fraction of shuffled motif instances. Additional motifs known and discovered for these and other datasets are included in Supplementary Information.
Extended Data Figure 3
Extended Data Figure 3. Orthologous expression in worm/fly
(a) Fly-worm stage alignment of expression using all fly-worm orthologs. (b) Fly-worm stage alignment by using all TF orthologs. (c) Fly-worm stage alignment by using ChIP’d TF ortholog. (d) Fly-worm stage alignment by using proximal genes to ChIP’d TF binding sites. The stage-mapped data exhibit two sets of collinear patterns between the two species (distinct diagonals). In the bottom diagonal, expression from worm embryos and larvae are matched with fly embryos and larvae, respectively; worm adults are matched with fly early embryos and fly female adults, possibly due to the orthologous gene expression in eggs of both species; worm dauers are matched with fly late embryo to L1 and L3 stages, which is similar to the position of dauer stages in the worm lifecycle (between worm L1 and L4 stages). In the upper diagonal, worm middle embryos are matched with fly L1 stage; worm late embryos are matched with fly prepupae and pupae stages; worm L4 male larvae are matched with fly male adults. This collinear pattern may be attributable to fly genes with two-mode expression profiles and many-to-one fly-worm orthologous gene pairs. For more details, please refer to the companion paper31.
Extended Data Figure 4
Extended Data Figure 4. Comparison of GO enrichment of orthologous TF pairs
A comparison of GO enrichment of orthologous TF pairs for all contexts in (a) Human vs Worm, (b) Human vs. Fly, and (c) Worm vs. Fly is shown. Red boxes indicate level of similar GO enrichment. ‘Plus’ signs mark orthologous TF pairs with white ‘pluses’ indicating the most significant enrichment for an ortholog pair. (d) Orthologous factors are more enriched for matching GO terms than non-orthologous factors.
Extended Data Figure 5
Extended Data Figure 5. Human HOT enrichments are not overly enriched for control DNA
HOT regions do not represent assembly or ChIP-ability artifacts. (a) Scatter plot of IgG IP/Input vs TF Occupancy. Scatterplot is shaded by density of points. Red dash line represents HOT threshold and black dashed line represent an enrichment of 1x. Black line represents best fitting line to the scatter plot (R2 = 0.0045) (b) A scatterplot of density (number of TF peaks per kb) rather than total number of peaks in a region shows a similar trend. (c) Barplot of fraction of regions with high IgG enrichment for HOT and non-HOT (RGB) regions using the same threshold (1.5x) as Teytelman et al. Figure 7 reveals little similarity between HOT regions and artifact ChIP regions. (d) The fraction of HOT (red) and non- HOT (blue) regions with high IgG enrichment is plotted as a function of threshold. Black line represents no enrichment (IgG/Input = 1x) and grey dashed line represents the enrichment cutoff (1.5x) used in (b) and in Teytelman et al. Figure 7. (e) Comparison of IgG (IgG/Input) and RNA Pol II enrichment (RNA PolII/Input) shows a different trend from Teytelman et al. Fig 3a. (e) Nearly all (99.967%) of our uniformly processed RNA PolII binding sites have IP/Input rations >2x, with a median enrichment of ~20x.
Extended Data Figure 6
Extended Data Figure 6. HOT regions were identified in all organisms
(a) To identify HOT region for each context, we first analyzed the number and size distribution of target binding regions (in which factor binding sites are concentrated). For each target case simulation, we randomly select an equivalent number of random binding regions with a matched size distribution. Next, for each factor assayed (in the target case), we evaluated the number and size of observed binding sites, and simulated an equivalent number and size distribution of target binding sites, restricting their placement to the simulated binding regions. We collapsed simulated binding sites from all factors into binding regions, verifying that these cluster into a similar number of simulated binding regions as the target binding regions. We identify regions at a 5% (HOT) and 1% (XOT) occupancy threshold based on this simulated data. (b) Binding of regulatory factors covers different fractions of the genomes of fly, human, and worm. Coverage is shown for constitutively HOT regions (cHOT – red), HOT regions (yellow), and non-HOT regions (RGB –green). Coverage for XOT regions is given in parenthesis.
Extended Data Figure 7
Extended Data Figure 7. HOT enrichments with context-specific enhancer enrichments
(a) Histone marks for HOT regions (represented by points and smoothed to show density) at proximal and (b) distal sites show similar trends of histone mark enrichment in their flanking regions. Enhancer calls for a specific developmental stage (c, e) or cell type (d) (labeled over each set of bar graphs) match HOT regions from that cell type and not HOT regions from another cell type. Each set of six bar graphs represents the same set of HOT regions called constitutively HOT or specific to each of the five cell types. Constitutive HOT (cHOT) regions are significantly enriched at promoters with the remaining regions overlapping enhancer regions.
Extended Data Figure 8
Extended Data Figure 8. The number of feed forward loops in different stage-specific networks
The number of FFLs in a stage is normalized by the number of TFs in the corresponding stage-specific network. Though the sets of TFs may differ, the number of TFs in each stage stays roughly the same.
Extended Data Figure 9
Extended Data Figure 9. Co-associations
Evolutionary retention and change in TF co-associations. The pairwise co-association strengths between orthologous TFs are shown for human-worm orthologs (a, b) and human-fly orthologs (c, d). For each pair of species-specific orthologs across multiple samples, the co-association strength, measured as the fraction of significant co-binding events between experiments, is shown (IntervalStats32). (a) Human co-association matrix for human-worm orthologs. (b) Worm co-association matrix for human-worm orthologs. (c) Human co-association matrix for human-fly orthologs. (d) Fly co-association matrix for human-fly orthologs. (e) Comparison of human-worm TF ortholog co-associations. The co-association strength of human-worm orthologs in human (x-axis) is plotted against the co-association strength in worm (y-axis). Lines depict 1 (solid) and 1.5 (dashed) standard deviations from the mean score. Factors in blue represent enrichments due to paralogous TFs in human that tend to be highly co-associated. (f) Comparison of human-fly TF ortholog co-associations. Co-association strength in human (x-axis) is plotted against co-association strength in fly (y-axis). For TF orthologs assayed in multiple developmental stages/cell-lines, the maximal co-association between contexts was selected for the comparative analyses (e, f).
Figure 1
Figure 1. Datasets overview
Data generated by the modENCODE and ENCODE consortium used in these analyses. The inner circle represents the fraction of datasets being presented for the first time in this paper. Each major context (cell lines in human and developmental stages in worm and fly) in each organism is colored a different hue in the outer two circles surrounding each organism and labeled on the edges of the diagrams. Datasets not in one of the main contexts are marked with asterisks. Each ChIP’d factor is depicted in the middle ring and the count is shown in parenthesis on the edges of the diagram (a given factor can be represented in multiple contexts). Every dataset is depicted in the outer ring, scaled by the number of peaks, and shaded to represent polymerase (red), transcription factor (lighter shade) and other (darker shade). In total 165, 93, and 52 unique factors were ChIP’d across all conditions and cell lines in human, worm, and fly respectively.
Figure 2
Figure 2. HOT regions
HOT regions contain binding sites for a large number of factors. (a) A total of 2,283, 2,948, and 46,348 HOT regions exist of which 29.1%, 13.7%, and 9.7% are constitutive in worm, fly, and human respectively. A large fraction of HOT regions are shared across multiple contexts but the majority of HOT regions are specific to a single context. (b) Constitutive human HOT (cHOT) regions show strong enrichment for promoters while cell-type specific [GM12878 (GM), H1hesc (H1), HepG2 (HG), HelaS3 (HL), K562 (K5)] HOT regions show more enhancer enrichment (see also Extended Data Figure 3).
Figure 3
Figure 3. Networks
(a) Statistics of the transcription regulatory networks in human, worm, fly and their hierarchical organization. (b) An example of the hierarchical network for worm. (c) Network motif enrichment. The human, worm and fly networks are mostly consistent in terms of motif enrichment. The motif feed-forward loop is the most enriched motif in all three networks. (d) Different transcription factors have different tendencies to appear as top, middle and bottom regulators in a FFL. The lists of human, worm, fly TFs with corresponding tendencies are displayed.
Figure 4
Figure 4. TF co-association
Many instances of TF co-association are under very specific contexts and are likely not observed in a simple genome-wide co-association study. (a) We combined the patterns of orthologous factors and genomic regions from two organisms to train a SOM where each ‘hexagon’ contains genomic regions from either organism with the same binding pattern of orthologous factors for worm (b) and fly (g). Each hexagon is shaded by the frequency of the pattern in the pairs of organisms. We show an example of binding patterns of 4 hexagons from the human-fly (c–d) and the human-worm (e–f). Names above the heatmaps are human factor names while those below are their ortholog names. Dark shaded boxes indicate binding of that factor. (c) A binding pattern shared at equal frequency between human and fly with only CTCF and SETDB1 (CTCF and SuVar3-9 in fly) binding. (d) A binding pattern that occurs more frequently in human shows ELF1, RNA Pol II, STAT, and TBP binding. (e) A binding pattern at similar frequencies in human and worm that is an example of a HOT region. (f) A pattern more frequent in humans than worms shows RNA Pol II, E2F, FOS, MYBL2, HDAC1, MXI1, FOXA, and TBP binding. (h) Co-localization patterns that occur more frequently near promoters (<500bp) in humans are highly likely to also occur at promoters in worm (80%) and fly (100%).

Comment in

  • Genomics: Hiding in plain sight.
    Muerdter F, Stark A. Muerdter F, et al. Nature. 2014 Aug 28;512(7515):374-5. doi: 10.1038/512374a. Nature. 2014. PMID: 25164742 No abstract available.

References

    1. modENCODE Consortium et al. Identification of functional elements and regulatory circuits by Drosophila modENCODE. Science. 2010;330:1787–1797. - PMC - PubMed
    1. Gerstein MB, et al. Integrative analysis of the Caenorhabditis elegans genome by the modENCODE project. Science. 2010;330:1775–1787. - PMC - PubMed
    1. Gerstein M, et al. An Integrative Comparison of Metazoan Transcriptomes
    1. Berger MF, et al. Variation in Homeodomain DNA Binding Revealed by High-Resolution Analysis of Sequence Preferences. Cell. 2008;133:1266–1276. - PMC - PubMed
    1. Moorman C, et al. Hotspots of transcription factor colocalization in the genome of Drosophila melanogaster. Proceedings of the National Academy of Sciences. 2006;103:12027–12032. - PMC - PubMed

Publication types

MeSH terms

Substances

LinkOut - more resources