. 2014 Nov;88(22):13029-46.
doi: 10.1128/JVI.01430-14. Epub 2014 Aug 27.

Stepwise priming by acidic pH and a high K+ concentration is required for efficient uncoating of influenza A virus cores after penetration

Affiliations

Stepwise priming by acidic pH and a high K+ concentration is required for efficient uncoating of influenza A virus cores after penetration

Sarah Stauffer et al. J Virol. 2014 Nov.

Abstract

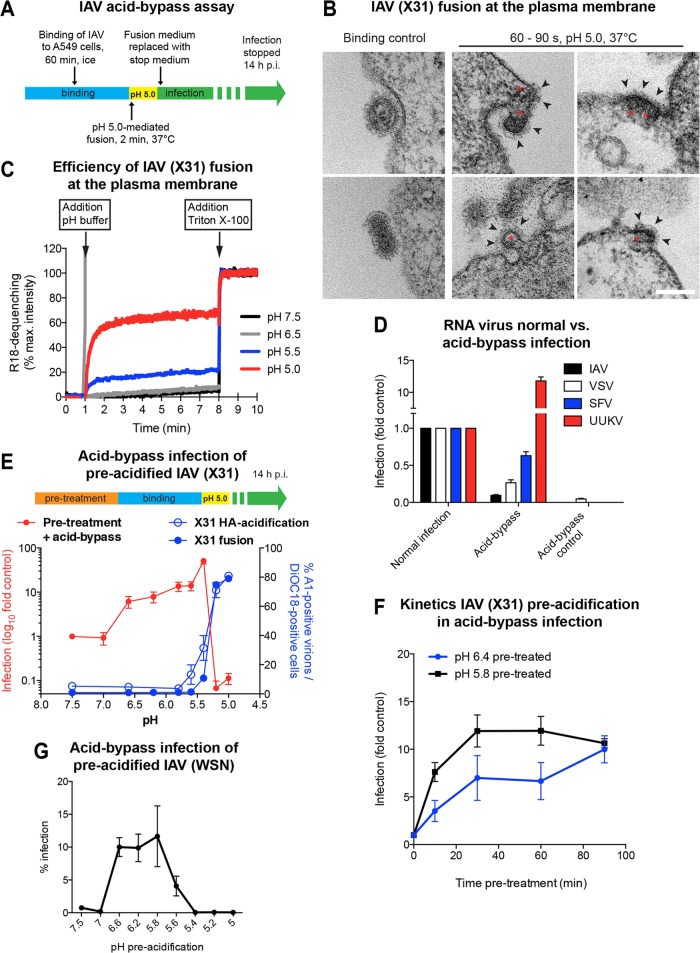
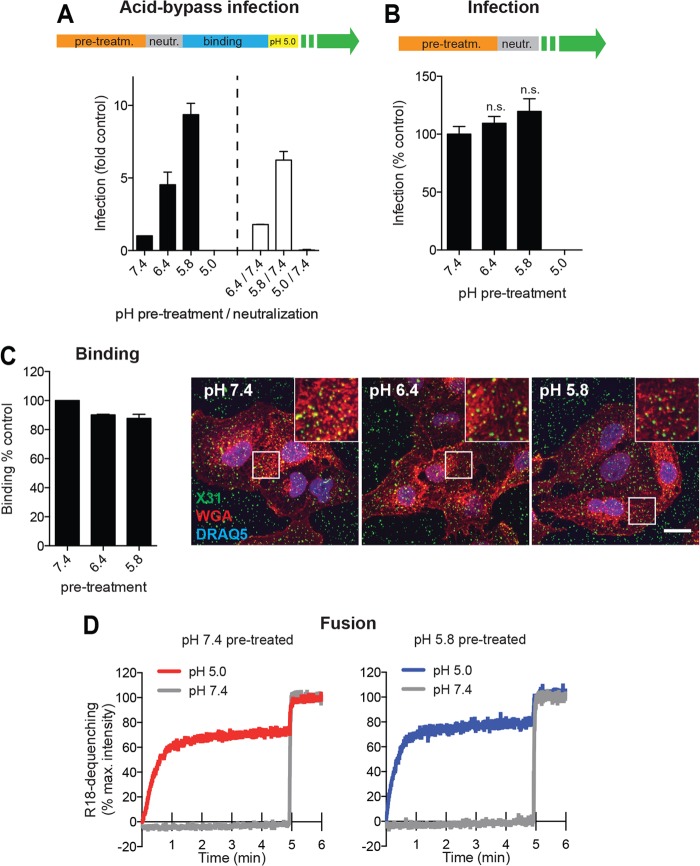
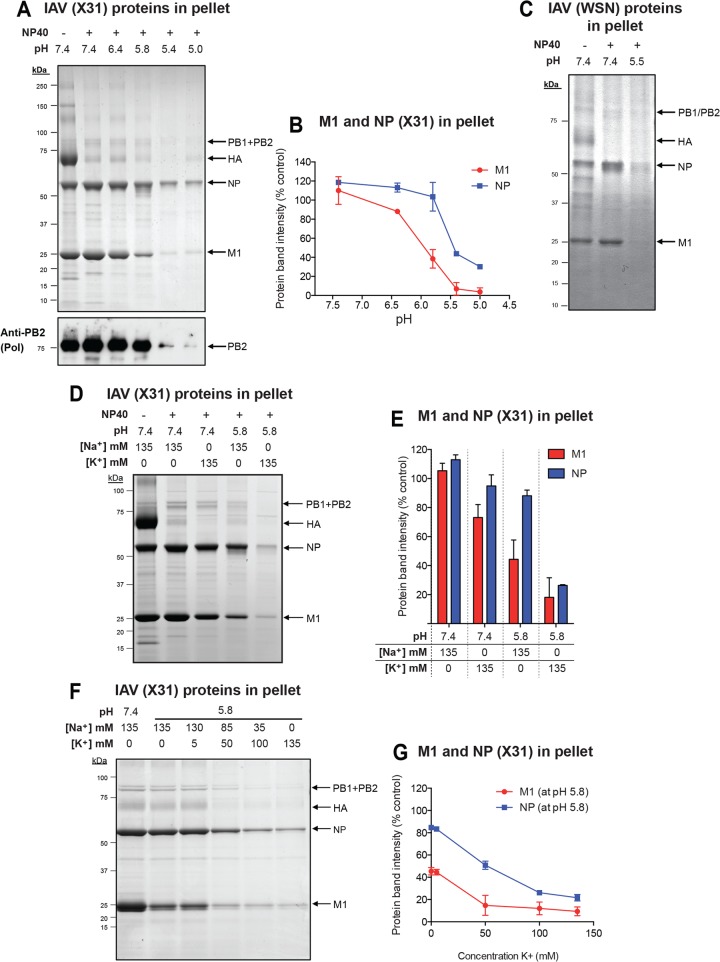
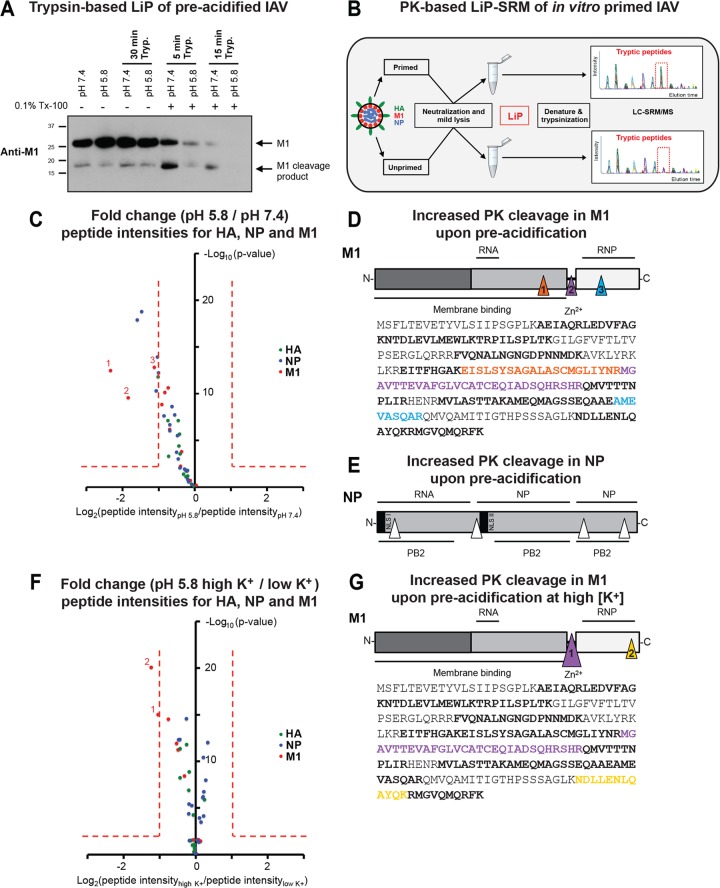
Influenza A virus (IAV) uses the low pH in late endocytic vacuoles as a cue for penetration by membrane fusion. Here, we analyzed the prefusion reactions that prepare the core for uncoating after it has been delivered to the cytosol. We found that this priming process occurs in two steps that are mediated by the envelope-embedded M2 ion channel. The first weakens the interactions between the matrix protein, M1, and the viral ribonucleoprotein bundle. It involves a conformational change in a linker sequence and the C-terminal domain of M1 after exposure to a pH below 6.5. The second step is triggered by a pH of <6.0 and by the influx of K(+) ions. It causes additional changes in M1 as well as a loss of stability in the viral ribonucleoprotein bundle. Our results indicate that both the switch from Na(+) to K(+) in maturing endosomes and the decreasing pH are needed to prime IAV cores for efficient uncoating and infection of the host cell.

Importance: The entry of IAV involves several steps, including endocytosis and fusion at late endosomes. Entry also includes disassembly of the viral core, which is composed of the viral ribonucleoproteins and the RNA genome. We have found that the uncoating process of IAV is initiated long before the core is delivered into the cytosol. M2, an ion channel in the viral membrane, is activated when the virus passes through early endosomes. Here, we show that protons entering the virus through M2 cause a conformational change in the matrix protein, M1. This weakens interactions between M1 and the viral ribonucleoproteins. A second change was found to occur when the virus enters late endosomes. The preacidified core is then exposed to a high concentration of K(+), which affects the interactions between the ribonucleoproteins. Thus, when cores are finally delivered to the cytosol, they are already partially destabilized and, therefore, uncoating competent and infectious.


Figures

FIG 1
FIG 1
Acid-induced fusion of IAV at the PM of A549 cells. (A) Schematic overview of the acid-bypass infection assay. Virus was bound to A549 cells on ice, followed by a 2-min pH 5.0 pulse at 37°C. Acid-bypass control samples were incubated for 2 min at 37°C in infection medium. Following acid bypass, cells were incubated for 14 h at 37°C in stop medium to block endosome acidification and, thus, further viral entry via endocytosis. (B) Thin-section EM of X31 fusion at the PM of A549 cells. Virus was bound to cells on ice, directly fixed (left) or incubated for 60 to 90 s in fusion medium (pH 5.0) at 37°C (middle and right), and then fixed. Viruses with compact-appearing core elements (red asterisks) could be captured during fusion. The viral glycoproteins were clearly visible on the outer side of the PM (black arrowheads). Bar, 100 nm. (C) Fluorescence spectroscopy monitoring the fusion kinetics of R18-labeled X31 with the A549 cell surface upon acid exposure. Following binding of labeled virus to cells on ice, samples were shifted to 37°C, and then fusion was initiated by lowering the pH to the indicated value. Fluorescence dequenching of R18 was measured over time, and the reaction was terminated by addition of 0.1% (final concentration) Triton X-100, which released the maximal dequenching capacity. The percent R18 dequenching shown was normalized to the fluorescence measured in the presence of 0.1% Triton X-100. max., maximum. (D) Comparison of acid-bypass infection and normal infection via endocytosis for RNA viruses. The acid-bypass protocol was performed as described in the legend to panel A. In the case of normal infection, virus was bound to A549 cells, washed, and continuously incubated in infection medium until fixation. IAV and UUKV were scored by immunostaining, detecting newly synthesized viral nucleoproteins. SFV and VSV infection was detected on the basis of GFP expression. The percentage of infected cells was normalized to the values obtained for normal infection. (E) Schematic overview of pretreatment prior to acid-bypass infection (top). X31 was pretreated for 1 h at 37°C in DMEM-based buffers adjusted to the indicated pH values. Following binding for 1 h on ice, the normal acid-bypass protocol described in the legend to panel A was performed (red line, primary y axis). In vitro HA acidification and fusion capacity were tested for the respective pH values in separate experiments (blue lines; secondary y axis). HA acidification was assessed using a conformation-specific antibody (A1) targeting only the acidic form of HA (blue line, open circles). Fusion capacity was determined by applying a FACS-based fusion assay (blue line, closed circles). (F) Kinetics of pretreatment prior to acid-bypass infection. Virus was pretreated for the indicated incubation times in DMEM-based buffers adjusted to the indicated pH values at 37°C, followed by acid-bypass infection, as described in the legend to panel E. (G) Preacidification of WSN(wt) prior to acid-bypass infection. WSN(wt) was pretreated with the indicated DMEM-based pH buffers for 10 min at 37°C, followed by performance of the acid bypass and infection scoring protocol as described for X31.
FIG 2
FIG 2
Effect of mild acid pretreatment on IAV infection, viral binding, and fusion. (A) Preacidification and neutralization of X31 prior to acid-bypass infection. Virus was pretreated for 1 h at 37°C in DMEM-based buffers adjusted to the indicated pH values. As shown schematically at the top, half of the samples were neutralized by addition of HEPES (1 M, pH 9.5) (white bars). Both sets of samples were subjected to the acid-bypass infection assay. (B) Pretreatment of X31 prior to normal infection. As shown schematically at the top, virus was pretreated for 1 h in DMEM-based buffers adjusted to the respective pH values at 37°C, neutralized, and added to A549 cells. Cells were incubated in infection medium and fixed at 10 h p.i. Statistical significance was assessed by Student's t test. (C) Binding of preacidified virus to A549 cells. X31 was pretreated with the indicated DMEM-based pH buffers for 1 h at 37°C, bound for 1 h on ice, and fixed. Cells were washed extensively in PBS and left unpermeabilized. Bound particles were detected by indirect immunofluorescence using a polyclonal anti-X31 antibody. Cell borders were visualized by staining with WGA, and nuclei were stained with DRAQ5. Representative confocal images for all conditions (right) and quantification results (left) are shown. Bar, 15 μm. (D) Fluorescence spectroscopy monitoring the fusion kinetics of R18-labeled X31 with the A549 cell surface following preacidification and neutralization. R18 dequenching was measured as explained in the legend to Fig. 1C. pre-treatm., pretreatment; neutr., neutralization; n.s., no significant difference.
FIG 3
FIG 3
Mild acidification of viral core proteins prior to pH 5.0-mediated fusion leads to more efficient uncoating. (A) IAV uncoating upon preacidification and acid-induced fusion at the PM. Virus was pretreated for 1 h at 37°C in DMEM-based buffers adjusted to pH 7.4 and 5.8. Neutralized virus was bound to A549 cells on ice, and fusion was induced as described for the acid-bypass infection assay. Cells were incubated for 5 min (M1) and 30 min (NP) after fusion in the presence of CHX-containing stop medium, fixed, and stained for M1 and NP, respectively, by indirect immunofluorescence. (Right) Representative images. Nuclei were visualized by DRAQ5 staining. (Left) M1 and NP exposure, as a measure for viral uncoating, was determined by measurement of the total fluorescence per cell and quantified with ImageJ. Bars, 20 μm. (B) Detection of M1 and NP upon acid bypass of preacidified virus. Virus was pretreated and fused at the PM of A549 cells as described in the legend to panel A. After 5 min incubation in CHX-containing stop medium, cells were fixed and stained for M1 and NP. White arrowheads, M1-free NP-staining. Bars, 10 μm. (C) Acid-bypass infection of WSN(wt) and amantadine-sensitive WSN(AS) in the presence of 100 μM the M2 inhibitor amantadine. See Materials and Methods for details about the construction of recombinant WSN(AS). (D) Preacidification of WSN(wt) and WSN(AS) in the presence of amantadine. Virus was pretreated with amantadine for 5 min at RT prior to preacidification at pH 6.2 for 10 min at 37°C. Acid-bypass infection was performed under the same conditions used for X31. (E) Acid bypass of X31 in the presence of CCCP. As schematically shown on the right, IAV was either left untreated (condition 1), preacidified at pH 5.8 for 1 h at 37°C (condition 2), or treated with CCCP for 5 min at RT (condition 3) or preacidification was combined with CCCP treatment (condition 4). Samples were subjected to either acid-bypass infection assay or normal infection of A549 cells, as described in the legend to panel A. CCCP was further present during the 2-min fusion step but excluded from subsequent incubation in stop and infection medium. (F) IAV uncoating upon acid-induced fusion at the PM in the presence of CCCP. Preincubation with CCCP and acid bypass were performed as described in the legend to Fig. 1D. Cells were fixed for 5 min (M1) and 30 min (NP) after acid bypass and subjected to indirect immunofluorescence. Representative images with DRAQ5 nuclear staining (left) and quantification (right) are shown. Samples were analyzed as described in the legend to panel A. Bars, 20 μm. (G) Acid bypass of WSN(AS) in the presence of CCCP and amantadine. As schematically shown on the left, IAV was either left untreated (condition 1) or pretreated with amantadine (condition 2) or CCCP (condition 3) for 5 min at RT. When both drugs were combined (condition 4), virus was first treated with amantadine for 5 min to block M2 channels and then CCCP was added to the solution and the mixture was further incubated for 5 min. Drugs were present during the fusion step but excluded from subsequent incubation in stop medium. The acid-bypass infection assay was performed under the same conditions described for X31.
FIG 4
FIG 4
Effect of a high K+ concentration during IAV core priming. (A) Preacidification in the presence of various monovalent cation conditions prior to acid-bypass infection. X31 was pretreated for 1 h at 37°C in buffers adjusted to pH 7.4 or 5.8 and supplemented with 120 mM indicated monovalent cations. The total ionic strength was kept constant. Following binding, the normal acid-bypass protocol described in the text was applied. (B) Preincubation with K+ over a range of concentrations (0 to 135 mM K+) at pH 5.8 prior to acid-bypass infection. (C) Binding of pretreated virus to A549 cells. X31 was pretreated for 1 h at 37°C under the indicated conditions, neutralized, and bound to A549 cells for 1 h on ice. Cells were fixed, washed, and left unpermeabilized. Bound particles were detected by using an anti-X31 polyclonal antibody (Pinda). (D) HA acidification upon exposure to acidic conditions with high (120 mM) and low (5 mM) K+ concentrations for 1 h at 37°C. (E) Fluorescence spectroscopy monitoring of the fusion kinetics of R18-labeled X31 with the A549 cell surface following preacidification (pH 5.8) in the presence of 120 mM K+. R18 dequenching was measured as explained in the legend to Fig. 1C. (F) IAV uncoating upon preacidification in the presence of 120 mM K+ and acid-induced fusion at the PM. Virus was pretreated for 1 h at 37°C. Neutralized virus was bound to A549 cells on ice, and fusion was induced as described for the acid-bypass infection assay. Cells were incubated for 5 min (M1) and 30 min (NP) after fusion in the presence of CHX-containing stop medium, fixed, and stained for M1 and NP, respectively, by indirect immunofluorescence. (Left) Representative images. Nuclei were visualized by DRAQ5 staining. (Right) M1 and NP exposure, as a measure for viral uncoating, was quantified as described in the legend to Fig. 3A. Bars, 20 μm. (G) Preacidification (Pre-acid.) of X31 in the presence and absence of the K+-specific ionophore valinomycin at 120 mM and 5 mM K+ prior to acid-bypass infection. (H) Acid-bypass infection assay of WSN(AS) in the presence of CCCP, valinomycin, and amantadine. (Right) As shown schematically, IAV was pretreated with the indicated drug combinations for 5 min at RT. When amantadine was combined with either CCCP, valinomycin, or both, virus was first treated with amantadine for 5 min to block M2 channels, and then CCCP, valinomycin, or both were added to the solution and the mixture was further incubated for 5 min. Drugs were present during the fusion step. The acid-bypass infection assay was performed under the same conditions described for X31.
FIG 5
FIG 5
Priming induces stepwise disassembly of the IAV core in vitro. (A) In vitro uncoating of X31 under different pH conditions. Purified X31 was diluted in 1 ml MNT (20 mM MES, 100 mM NaCl, 30 mM Tris) buffer, which was layered on a two-step glycerol gradient: 3 ml 15% (vol/vol) glycerol prepared in distilled water without any additions (interlayer) and 3.4 ml 25% glycerol (vol/vol) containing 1% NP-40 (bottom layer). The bottom layer was adjusted to the desired pH and salt concentration. For neutral pH, complete subviral particles were pelleted, whereas conditions favorable for uncoating of the virus led to the dissociation of viral core components into the bottom layer. Glycerol supernatants were removed, and the pellets were dissolved in nonreducing sample buffer followed by SDS-PAGE. Gels were stained with Coomassie, and viral protein band intensities were quantified by densitometry. The indicated pH conditions were tested at a constant salt concentration (150 mM NaCl). As a control, NP-40 was omitted from the bottom glycerol layer. vRNPs were detected by Western blot analysis using a monoclonal antibody against IAV PB2. (B) Densitometric quantification of the intensities of viral protein bands shown in panel A. Protein band intensities were normalized to those at pH 7.4 without NP-40. (C) In vitro uncoating of WSN(wt) at mildly acidic pH (pH 5.5). The same experimental setup described in the legend to panel A was applied. (D) Effect of a high K+ concentration (135 mM) and pH 5.8 on X31 uncoating in vitro. The assay was performed as described in the legend to panel A. (E) Densitometric quantification of the intensities of viral protein bands shown in panel D. Protein band intensities were normalized to those at pH 7.4 without NP-40. (F) Analysis of the effect of a range of K+ concentrations (0 to 135 mM K+) at pH 5.8 on X31 uncoating in vitro. The assay was performed as described in the legend to panel A. The total ionic strength was kept constant by supplementing the bottom glycerol layer with the indicated amounts of NaCl and KCl. (G) Densitometric quantification of the intensities of viral protein bands shown in panel F. Protein band intensities were normalized to those at pH 7.4 with 135 mM Na+ and NP-40.
FIG 6
FIG 6
Structural transitions of virion-derived IAV core proteins following priming probed by LiP. (A) Trypsin (Tryp.)-based LiP of mildly acidified X31 virions. X31 was pretreated at pH 7.4 and 5.8 for 1 h at 37°C, neutralized, and lysed with 0.1% Triton X-100 (Tx-100; 20 min at RT). Control samples were left unlysed. Trypsin was added at a ratio of 1:4 (trypsin/M1), and the mixture was incubated at RT for the indicated times. The reaction was stopped by addition of reducing SDS sample buffer containing 2 mM PMSF. Samples were resolved by SDS-PAGE and analyzed for M1 tryptic cleavage by Western blot analysis, using a monoclonal antibody against M1 (HB-64). (B) Schematic representation of LiP-SRM work flow applied to X31. Primed and unprimed virus samples were neutralized and lysed with 0.1% NP-40 (20 min at RT). LiP was performed with PK for 5 min at an enzyme/substrate ratio of 1:100. Samples were subsequently denatured and trypsinized for LC-SRM/MS analysis. The tryptic peptide intensities of primed and unprimed samples were compared. (C) Differences in susceptibility to PK cleavage are reflected by the fold changes of quantified LiP peptides from M1, NP, and HA between preacidified virus (pH 5.8, 60 min, 37°C) and control virus (pH 7.4). x axis, log2(fold change); y axis, −log10(P value). P values were obtained with three technical replicates per condition. Fold changes of >2 with a P value of <0.01 were considered significant. (D, E) Mapping of LiP peptides onto the sequence of M1 (D, bottom) and schematic visualization of PK cleavage sites in M1 (D, top) and NP (E). Triangles indicate the sites (based on LiP analysis) where a significant increase in PK cleavage was observed for preacidified virus. (F) Differences in susceptibility to PK cleavage are reflected by the fold changes of peptides quantified from M1, NP, and HA between virus preacidified in 5 mM K+ (low K+ concentration) and virus preacidified in 120 mM K+ (high K+ concentration). The same setup from panel A was adapted. (G) (Bottom) Mapping of peptides onto the sequence of M1. (Top) Triangles indicate the sites (based on LiP analysis) where an increase in PK cleavage was observed for virus treated with 120 mM K+ at pH 5.8. (D, E, and G) The schematic domain organizations of the viral proteins M1 and NP are shown. Binding sites reported for other viral components are indicated. NLS, nuclear localization signal.
FIG 7
FIG 7
Increased fluorescence of the K+-sensitive dye APG3 in LEs. (A) Loading of endosomes with APG3. A549 cells were serum starved for 4 h prior to EGF-AF647 (200 ng/ml) binding on ice for 30 min. Cells were then washed with growth medium and loaded for 30 min with APG3 at 37°C (APG3 pulse). Live cells were imaged with a confocal microscope. EGF-AF647 signal was false colored to red for better visualization of the resulting yellow colocalization signal. (B) APG3 fluorescence upon internalization over time. Cells were loaded with APG3 as described in the legend to panel A. Following 30 min incubation with the dye, the cells were washed, transferred to the microscope, and imaged at the indicated time points. In the case of nocodazole treatment, cells were incubated in the presence of the drug together with APG3 for 30 min, followed by exchange to fresh nocodazole-containing medium for the imaging time. (Top) Representative images for both conditions at 60 min after the APG3 pulse; (bottom) mean fluorescence intensities at the indicated time points after APG3 loading were determined with ImageJ-based quantification. (A, B) Cell borders and nuclei were determined in transmission mode and are indicated as dashed lines in the images. Bars, 20 μm.

Similar articles

Cited by

References

    1. Taubenberger JK, Kash JC. 2010. Influenza virus evolution, host adaptation, and pandemic formation. Cell Host Microbe 7:440–451. 10.1016/j.chom.2010.05.009. - DOI - PMC - PubMed
    1. Calder LJ, Wasilewski S, Berriman JA, Rosenthal PB. 2010. Structural organization of a filamentous influenza A virus. Proc. Natl. Acad. Sci. U. S. A. 107:10685–10690. 10.1073/pnas.1002123107. - DOI - PMC - PubMed
    1. Noton SL, Medcalf E, Fisher D, Mullin AE, Elton D, Digard P. 2007. Identification of the domains of the influenza A virus M1 matrix protein required for NP binding, oligomerization and incorporation into virions. J. Gen. Virol. 88:2280–2290. 10.1099/vir.0.82809-0. - DOI - PMC - PubMed
    1. Ruigrok RW, Barge A, Durrer P, Brunner J, Ma K, Whittaker GR. 2000. Membrane interaction of influenza virus M1 protein. Virology 267:289–298. 10.1006/viro.1999.0134. - DOI - PubMed
    1. Sha BD, Luo M. 1997. Structure of a bifunctional membrane-RNA binding protein, influenza virus matrix protein M1. Nat. Struct. Biol. 4:239–244. 10.1038/nsb0397-239. - DOI - PubMed

Publication types