. 2014 Nov 5;25(22):3541-51.
doi: 10.1091/mbc.E14-06-1099. Epub 2014 Aug 27.

Single-molecule tracking of tau reveals fast kiss-and-hop interaction with microtubules in living neurons

Affiliations

Single-molecule tracking of tau reveals fast kiss-and-hop interaction with microtubules in living neurons

Dennis Janning et al. Mol Biol Cell. .

Abstract

The microtubule-associated phosphoprotein tau regulates microtubule dynamics and is involved in neurodegenerative diseases collectively called tauopathies. It is generally believed that the vast majority of tau molecules decorate axonal microtubules, thereby stabilizing them. However, it is an open question how tau can regulate microtubule dynamics without impeding microtubule-dependent transport and how tau is also available for interactions other than those with microtubules. Here we address this apparent paradox by fast single-molecule tracking of tau in living neurons and Monte Carlo simulations of tau dynamics. We find that tau dwells on a single microtubule for an unexpectedly short time of ∼40 ms before it hops to the next. This dwell time is 100-fold shorter than previously reported by ensemble measurements. Furthermore, we observed by quantitative imaging using fluorescence decay after photoactivation recordings of photoactivatable GFP-tagged tubulin that, despite this rapid dynamics, tau is capable of regulating the tubulin-microtubule balance. This indicates that tau's dwell time on microtubules is sufficiently long to influence the lifetime of a tubulin subunit in a GTP cap. Our data imply a novel kiss-and-hop mechanism by which tau promotes neuronal microtubule assembly. The rapid kiss-and-hop interaction explains why tau, although binding to microtubules, does not interfere with axonal transport.


Figures

FIGURE 1:
FIGURE 1:
Single-molecule tracking reveals undirected fast movement of tau in processes of neural cells. (A) Schematic representation of the Halo-tagged tau fusion construct (Halo-tau) and the visualization of a thin cellular layer by TIRF microscopy. The microtubule-binding repeats (R1–R4) are indicated by the gray boxes, and the evanescent field close to the cellular attachment site is shown in yellow. Bottom, colocalization of Halo-tau (left) and monomeric enhanced GFP–tagged α-tubulin (EGFP-tub; right) as visualized by TIRF microscopy of the cell body of living PC12 cells. Sum projections of 1000 consecutive frames were recorded. Scale bar, 10 μm. MTOC, microtubule-organizing center. (B) Time series of individual Halo-tau molecules moving in a process of a neuronally differentiated PC12 cell. Motion during the first 85 ms. Dashed lines indicate the border of the process. A trajectory generated from the complete time series (2.2 s = 440 frames) is shown below, indicating undirected fast movement both longitudinally and transversally. The starting point is indicated by a circle and the end by a square. Scale bar, 0.5 μm.
FIGURE 2:
FIGURE 2:
Tau interacts with multiple microtubules in processes of PC12 cells. (A) Schematic representation showing the geometry and MT distribution in a process of a neuronally differentiated PC12 cell. (B) Localization of a single Halo-tau molecule in a PC12 cell process over time (for a high-resolution version see Supplemental Figure S1). For comparison, thickness and density of MTs are schematically indicated by green bars. Top, enlargement of the indicated segment. (C) Schematic representation of a real trajectory of a molecule moving between microtubules in a bundle is shown in black. Yellow and black circles indicate binding events of tau with microtubules. The recorded pseudotrajectory is indicated in red. Only the binding events within the time frame (Δt) are detected and indicated by the yellow circles. (D) Time series showing the movement of a syp-mCherry–tagged vesicle in a PC12 cell process. In contrast to tau, localization of syp-mCherry over time indicates directional movement along a single MT. Scale bar, 1 μm.
FIGURE 3:
FIGURE 3:
Step-size distribution analysis and Monte Carlo simulation indicate jumps of tau between microtubules. (A) SSD analysis of >1000 pseudotrajectories indicating subpopulations of jumps between MTs. The peaks in the histogram correspond to 1 → 2, 1 → 3, and 1 → 4 hops between MTs. (B) SSD analysis of simulated pseudotrajectories at different pseudoequilibrium constants (kon*/koff). Note that the histogram at kon*/koff = 102 closely resembles the data shown in A. The Monte Carlo simulation revealed an additional peak (indicated in red), which was not resolved by imaging.
FIGURE 4:
FIGURE 4:
Representative histogram of residence times of tau on microtubules in PC12 cells. The monoexponential fit is shown by a red line, and the time constant (dwell time) is indicated on top.
FIGURE 5:
FIGURE 5:
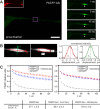
Tau promotes microtubule assembly in neurites of living cells. (A) Live-cell imaging of a PC12 cell coexpressing mCherry-tagged tau (left, inset) and PAGFP-tagged α-tubulin (PAGFP-tub) before and after fluorescence photoactivation. The position of activation is indicated by a violet box. Fluorescence decay of PAGFP-tub in the activated region is indicated by the arrows. Scale bar, 10 μm. (B) Determination of the axes of symmetry (left) and the plot of normalized intensity distributions (right) as they were used to define the ROI. (C) FDAP curves of PAGFP-tub in the ROI. The presence of mCherry-tau decreases fluorescence decay of PAGFP-tub (left), whereas a control protein (3×mCherry) has no effect (right). For comparison, FDAP of a soluble protein (3×PAGFP) is shown. Values are expressed as mean ± SEM (n = 29–36). Fractions of polymerized PAGFP-tub were estimated based on fitting of the respective FDAP curves to a reaction-diffusion model (bottom).
FIGURE 6:
FIGURE 6:
Tau exhibits kiss-and-hop behavior also in axons of primary neurons. (A) Triple fluorescence micrographs showing expression of Halo-tau (red) in lentivirally infected wild-type mouse cortical neurons. Staining against tubulin (DM1A, green) and nuclei (4′,6-diamidino-2-phenylindole [DAPI], blue) is shown. Right, Western blot indicating expression of exogenous Halo-tau (arrow) in cultures from wild-type (wt) or TAU/ mice (KO). The presence of endogenous tau in wt mice is indicated by arrowheads. Bottom, staining for actin as a loading control. Scale bar, 20 μm. (B) Triple fluorescence micrographs after a fixation-extraction protocol, which reveals cytoskeletal association. Cortical neurons from TAU/ mice were lentivirally infected to express Halo-tau (red). Top, overview; bottom, individual growth cone region. Note the enrichment of Halo-tau at the transition between the axon shaft and the growth cone as indicated by arrows. Staining against tubulin (DM1A, green) and nuclei (DAPI, blue) is shown. Scale bar, 20 μm (top), 10 μm (bottom). (C) Localization of a single Halo-tau molecule in an axon of a TAU/ neuron over time. For comparison, thickness and density of axonal MTs are schematically indicated by the green bars. Top, enlargement of the indicated segment. Note that the MT–MT distance in axons of cortical neurons is much smaller than in neurites of PC12 cells. (D) Dwell times of Halo-tau in neurites of PC12 cells (39 ± 4 ms; n = 7) and axons of primary cultures (36 ± 5 ms; n = 4). Data represent mean ± SEM.
FIGURE 7:
FIGURE 7:
Schematic representation illustrating features and consequences of the kiss-and-hop behavior of tau as identified in this study. P, phosphorylation; D, dephosphorylation.

References

    1. Aronov S, Aranda G, Behar L, Ginzburg I. Axonal tau mRNA localization coincides with tau protein in living neuronal cells and depends on axonal targeting signal. J Neurosci. 2001;21:6577–6587. - PMC - PubMed
    1. Bakota L, Brandt R, Heinisch JJ. Triple mammalian/yeast/bacterial shuttle vectors for single and combined Lentivirus-and Sindbis virus-mediated infections of neurons. Mol Genet Genomics. 2012;287:313–324. - PubMed
    1. Ballatore C, Lee VM-Y, Trojanowski JQ. Tau-mediated neurodegeneration in Alzheimer's disease and related disorders. Nat Rev Neurosci. 2007;8:663–672. - PubMed
    1. Bates DM, Watts DG. Nonlinear Regression Analysis and Its Applications. New York: Wiley; 1988.
    1. Brandt R, Lee G. Functional organization of microtubule-associated protein tau. Identification of regions which affect microtubule growth, nucleation, and bundle formation in vitro. J Biol Chem. 1993a;268:3414–3419. - PubMed

Publication types

MeSH terms

LinkOut - more resources