

Temperature alters food web body-size structure
- PMID: 25165457
- PMCID: PMC4155913
- DOI: 10.1098/rsbl.2014.0473
Temperature alters food web body-size structure
Abstract
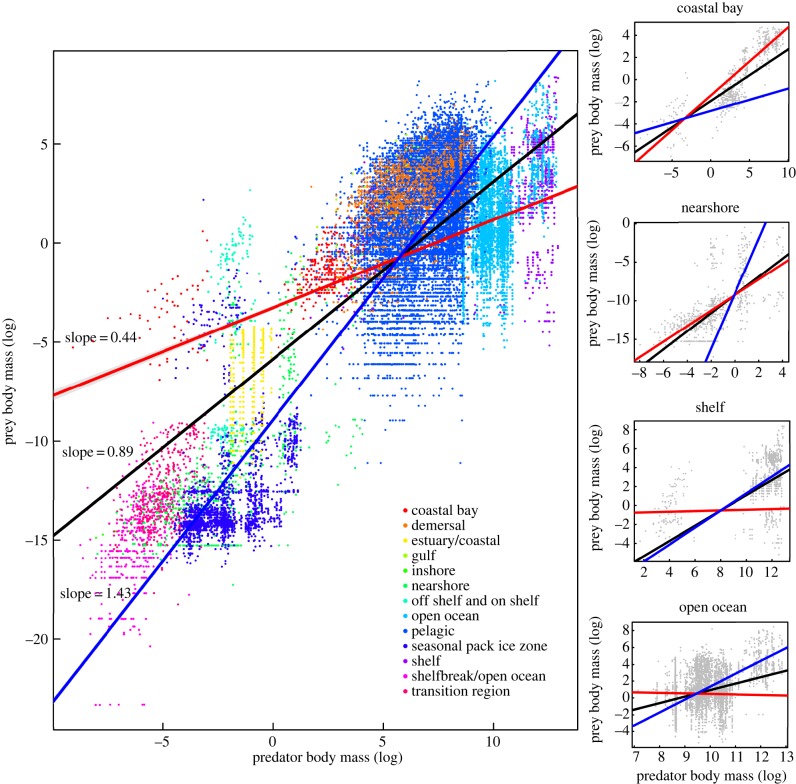
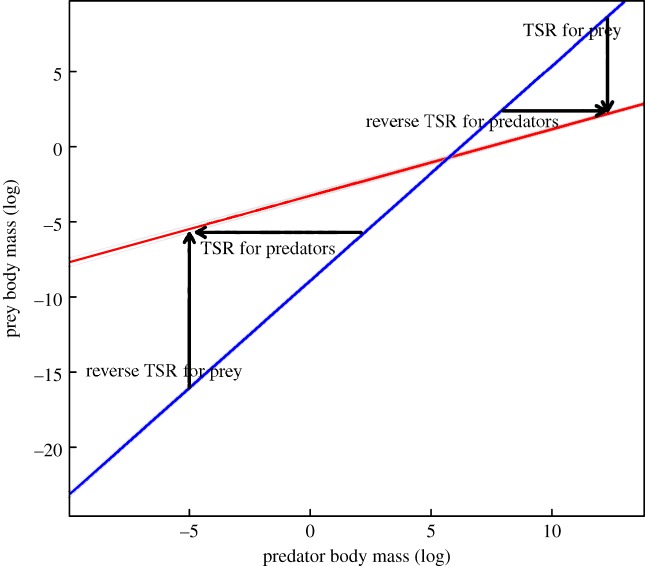
The increased temperature associated with climate change may have important effects on body size and predator-prey interactions. The consequences of these effects for food web structure are unclear because the relationships between temperature and aspects of food web structure such as predator-prey body-size relationships are unknown. Here, we use the largest reported dataset for marine predator-prey interactions to assess how temperature affects predator-prey body-size relationships among different habitats ranging from the tropics to the poles. We found that prey size selection depends on predator body size, temperature and the interaction between the two. Our results indicate that (i) predator-prey body-size ratios decrease with predator size at below-average temperatures and increase with predator size at above-average temperatures, and (ii) that the effect of temperature on predator-prey body-size structure will be stronger at small and large body sizes and relatively weak at intermediate sizes. This systematic interaction may help to simplify forecasting the potentially complex consequences of warming on interaction strengths and food web stability.
Keywords: body-size ratios; food web structure; global warming; temperature; temperature size rule.
© 2014 The Author(s) Published by the Royal Society. All rights reserved.
Figures
Similar articles
-
Global patterns in predator-prey size relationships reveal size dependency of trophic transfer efficiency.Ecology. 2010 Jan;91(1):222-32. doi: 10.1890/08-2061.1. Ecology. 2010. PMID: 20380211
-
Consumer-resource body-size relationships in natural food webs.Ecology. 2006 Oct;87(10):2411-7. doi: 10.1890/0012-9658(2006)87[2411:cbrinf]2.0.co;2. Ecology. 2006. PMID: 17089649
-
Temperature alters the predator-prey size relationships and size-selectivity of Southern Ocean fish.Nat Commun. 2024 May 10;15(1):3979. doi: 10.1038/s41467-024-48279-0. Nat Commun. 2024. PMID: 38729972 Free PMC article.
-
Functional responses and scaling in predator-prey interactions of marine fishes: contemporary issues and emerging concepts.Ecol Lett. 2011 Dec;14(12):1288-99. doi: 10.1111/j.1461-0248.2011.01696.x. Epub 2011 Oct 11. Ecol Lett. 2011. PMID: 21985428 Review.
-
[Effects of spatial structure on predator-prey interactions: A review.].Ying Yong Sheng Tai Xue Bao. 2017 Feb;28(2):712-720. doi: 10.13287/j.1001-9332.201702.040. Ying Yong Sheng Tai Xue Bao. 2017. PMID: 29749181 Review. Chinese.
Cited by
-
Changes in sea floor productivity are crucial to understanding the impact of climate change in temperate coastal ecosystems according to a new size-based model.PLoS Biol. 2023 Dec 11;21(12):e3002392. doi: 10.1371/journal.pbio.3002392. eCollection 2023 Dec. PLoS Biol. 2023. PMID: 38079442 Free PMC article.
-
Rapid eco-phenotypic feedback and the temperature response of biomass dynamics.Ecol Evol. 2023 Jan 10;13(1):e9685. doi: 10.1002/ece3.9685. eCollection 2023 Jan. Ecol Evol. 2023. PMID: 36644704 Free PMC article.
-
Increasing temperature weakens the positive effect of genetic diversity on population growth.Ecol Evol. 2021 Dec 14;11(24):17810-17816. doi: 10.1002/ece3.8335. eCollection 2021 Dec. Ecol Evol. 2021. PMID: 35003641 Free PMC article.
-
Metabolic plasticity drives mismatches in physiological traits between prey and predator.Commun Biol. 2024 May 28;7(1):653. doi: 10.1038/s42003-024-06350-y. Commun Biol. 2024. PMID: 38806643 Free PMC article.
-
Genetic basis of thermal plasticity variation in Drosophila melanogaster body size.PLoS Genet. 2018 Sep 26;14(9):e1007686. doi: 10.1371/journal.pgen.1007686. eCollection 2018 Sep. PLoS Genet. 2018. PMID: 30256798 Free PMC article.
References
-
- Brown JH, Gillooly JF, Allen AP, Savage VM, West GB. 2004. Toward a metabolic theory of ecology. Ecology 85, 1771–1789. (10.1890/03-9000) - DOI
-
- Memmott J, Martinez ND, Cohen JE. 2000. Predators, parasitoids and pathogens: species richness, trophic generality and body sizes in a natural food web. J. Anim. Ecol. 69, 1–15. (10.1046/j.1365-2656.2000.00367.x) - DOI
Publication types
MeSH terms
LinkOut - more resources
Full Text Sources
Other Literature Sources
