

Bacteriophages as antimicrobial agents against bacterial contaminants in yeast fermentation processes
- PMID: 25165487
- PMCID: PMC4145223
- DOI: 10.1186/s13068-014-0123-9
Bacteriophages as antimicrobial agents against bacterial contaminants in yeast fermentation processes
Abstract
Background: The emergence of biofuels produced through yeast fermentation represents an important avenue for sustainable energy production. Despite all its advantages, this process is vulnerable to contamination by other organisms - most commonly lactic acid bacteria - that are present in raw feedstocks and/or in production lines. These contaminants compete with the yeast for nutrients, reducing the overall biofuel yield, and release substances that inhibit yeast growth. Here, we investigated the application of bacteriophages as potential antibacterial agents in yeast fermentation.
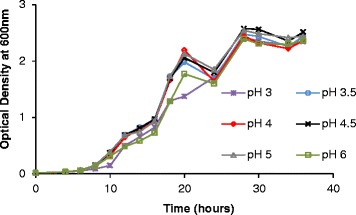
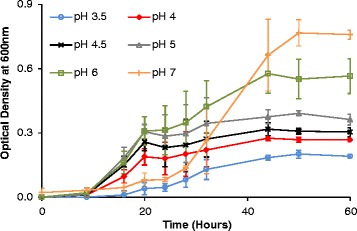
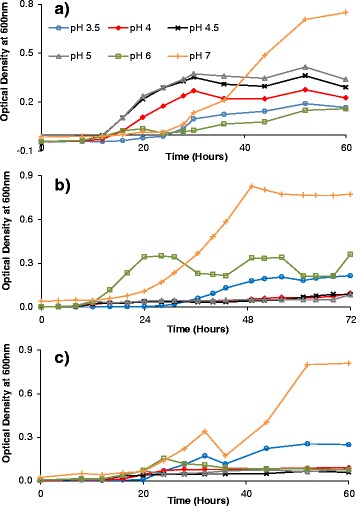
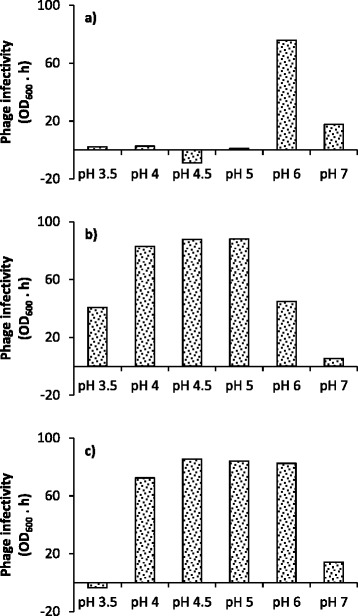
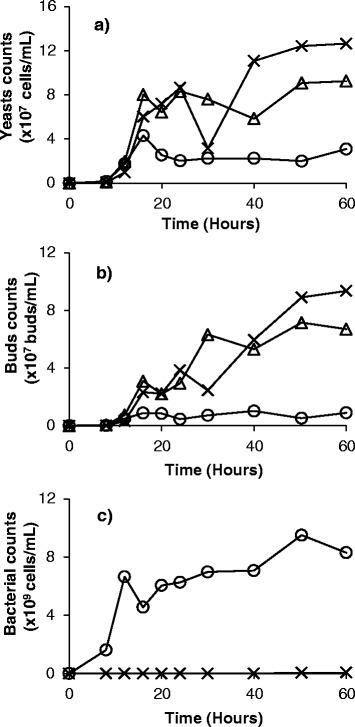
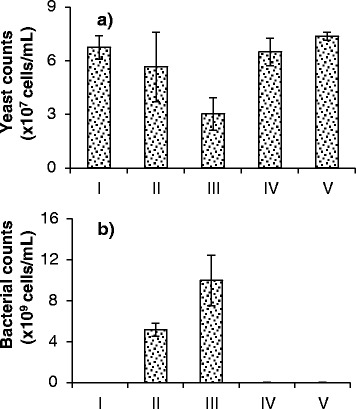
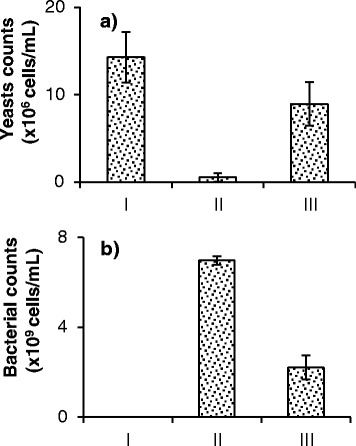
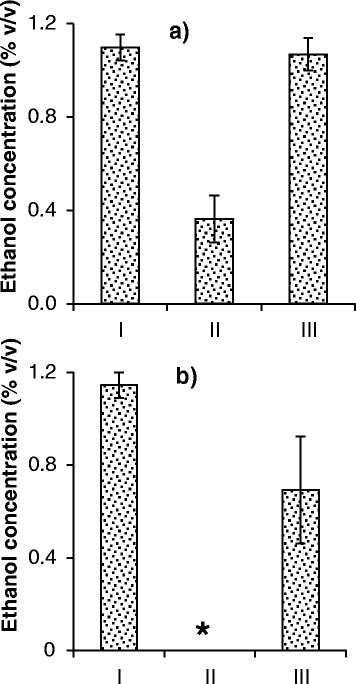
Results: Experiments conducted to understand the impact of pH on yeast, bacterial, and phage development showed that the yeast Saccharomyces cerevisiae Superstart™ grew in a similar fashion at pH levels ranging from 3 to 6. Growth of Lactobacillus plantarum ATCC® 8014™ was inhibited by pH levels of less than 4, and phages ATCC® 8014-B1™ (phage B1) and ATCC® 8014-B2™ (phage B2) displayed different infectivities within the pH range tested (pH 3.5 to 7). Phage B1 showed the best infectivity at pH 6, while phage B2 was most virulent at pH levels ranging from 4 to 5, and the cocktail of these phages showed highest infectivity in the range from pH 4 to 6. Population dynamics studies in MRS medium at pH 6 showed that, in the presence of bacteria inoculated at 10(7) cells/ml, yeast cultures were impeded under aerobic and anaerobic conditions, showing major decreases in both cell yield and ethanol production. The addition of the phage cocktail at a low initial multiplicity of infection was sufficient to reduce contamination by over 99%, and to allow yeast and ethanol yields to reach values equivalent to those of axenic cultures.
Conclusions: From the results observed, phages are good candidates as antimicrobial agents, to be used in place of or in conjunction with antibiotics, in yeast fermentation processes. Their implementation with other common contamination abatement/prevention methods could further increase their efficacy.
Keywords: Antibacterial; Bacteriophage; Biofuel; Contamination abatement; Ethanol; Lactic acid bacteria; Yeast.
Figures
Similar articles
-
Reduction of invasive bacteria in ethanol fermentations using bacteriophages.Biotechnol Bioeng. 2015 Aug;112(8):1544-53. doi: 10.1002/bit.25586. Epub 2015 Jun 15. Biotechnol Bioeng. 2015. PMID: 25788328
-
Phage adsorption to Lactobacillus plantarum: influence of physiological and environmental factors.Int J Food Microbiol. 2010 Apr 15;138(3):270-5. doi: 10.1016/j.ijfoodmicro.2010.01.007. Epub 2010 Jan 28. Int J Food Microbiol. 2010. PMID: 20153539
-
Regulation of Lactobacillus plantarum contamination on the carbohydrate and energy related metabolisms of Saccharomyces cerevisiae during bioethanol fermentation.Int J Biochem Cell Biol. 2015 Nov;68:33-41. doi: 10.1016/j.biocel.2015.08.010. Epub 2015 Aug 14. Int J Biochem Cell Biol. 2015. PMID: 26279142
-
Microbial contamination of fuel ethanol fermentations.Lett Appl Microbiol. 2011 Oct;53(4):387-94. doi: 10.1111/j.1472-765X.2011.03124.x. Epub 2011 Aug 2. Lett Appl Microbiol. 2011. PMID: 21770989 Review.
-
Engineering Saccharomyces cerevisiae for direct conversion of raw, uncooked or granular starch to ethanol.Crit Rev Biotechnol. 2015;35(3):369-91. doi: 10.3109/07388551.2014.888048. Crit Rev Biotechnol. 2015. PMID: 24666118 Review.
Cited by
-
High-Titer Production of the Fungal Anhydrotetracycline, TAN-1612, in Engineered Yeasts.ACS Synth Biol. 2022 Jul 15;11(7):2429-2444. doi: 10.1021/acssynbio.2c00116. Epub 2022 Jun 14. ACS Synth Biol. 2022. PMID: 35699947 Free PMC article.
-
Isolation of Saccharomyces Cerevisiae from Pineapple and Orange and Study of Metal's Effectiveness on Ethanol Production.Eur J Microbiol Immunol (Bp). 2017 Feb 27;7(1):76-91. doi: 10.1556/1886.2016.00035. eCollection 2017 Mar. Eur J Microbiol Immunol (Bp). 2017. PMID: 28386473 Free PMC article.
-
The Virulence Index: A Metric for Quantitative Analysis of Phage Virulence.Phage (New Rochelle). 2020 Mar 1;1(1):27-36. doi: 10.1089/phage.2019.0001. Epub 2020 Feb 25. Phage (New Rochelle). 2020. PMID: 36147620 Free PMC article.
-
Comparative Assessment of Bacteriophage and Antibiotic Activity against Multidrug-Resistant Staphylococcus aureus Biofilms.Int J Mol Sci. 2022 Jan 24;23(3):1274. doi: 10.3390/ijms23031274. Int J Mol Sci. 2022. PMID: 35163197 Free PMC article.
-
The Effect of Oxygen Availability on Bacteriophage Infection: A Review.Phage (New Rochelle). 2021 Mar 1;2(1):16-25. doi: 10.1089/phage.2020.0041. Epub 2021 Mar 17. Phage (New Rochelle). 2021. PMID: 36148442 Free PMC article. Review.
References
-
- Johnson EA, Echavarri-Erasun C. Yeast biotechnology. In: Kurtzman CP, Fell JW, Boekhout T, editors. The Yeasts - A Taxonomic Study. 5. London: Elsevier B.V; 2011. pp. 21–44.
-
- McGovern PE, Hartung U, Badler VR, Glusker DL, Exner LJ. The beginnings of winemaking and viniculture in the ancient Near East and Egypt. Expedition. 1997;39(Suppl 1):3–21.
-
- Pilgrim C. Status of the worldwide fuel alcohol industry. In: Ingledew WM, Kelsall DR, Austin GD, Kluhspies C, editors. The Alcohol Textbook – A Reference for the Beverage, Fuel and Industrial Alcohol Industries. 5. Nottingham: Nottingham University Press; 2009. pp. 7–17.
-
- Wyman CE. Cellulosic ethanol: a unique sustainable liquid transportation fuel. MRS Bull. 2008;33(Suppl 4):381–383. doi: 10.1557/mrs2008.77. - DOI
-
- Ingledew WM, Austin GD, Kelsall DR, Kluhspies C. The alcohol industry: How has it changed and matured? In: Ingledew WM, Kelsall DR, Austin GD, Kluhspies C, editors. The Alcohol Textbook – A Reference for the Beverage, Fuel and Industrial Alcohol Industries. 5. Nottingham: Nottingham University Press; 2009. pp. 1–6.
LinkOut - more resources
Full Text Sources
Other Literature Sources
Molecular Biology Databases
