. 2014 Aug 28;10(8):e1004348.
doi: 10.1371/journal.ppat.1004348. eCollection 2014 Aug.

Rabies Virus Hijacks and accelerates the p75NTR retrograde axonal transport machinery

Affiliations

Rabies Virus Hijacks and accelerates the p75NTR retrograde axonal transport machinery

Shani Gluska et al. PLoS Pathog. .

Abstract

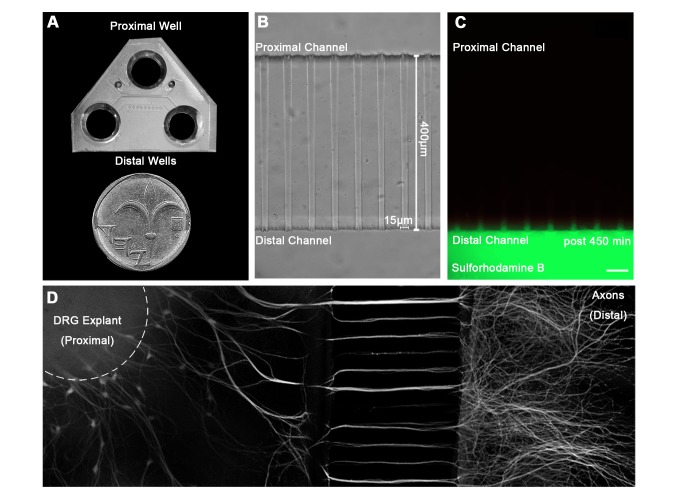
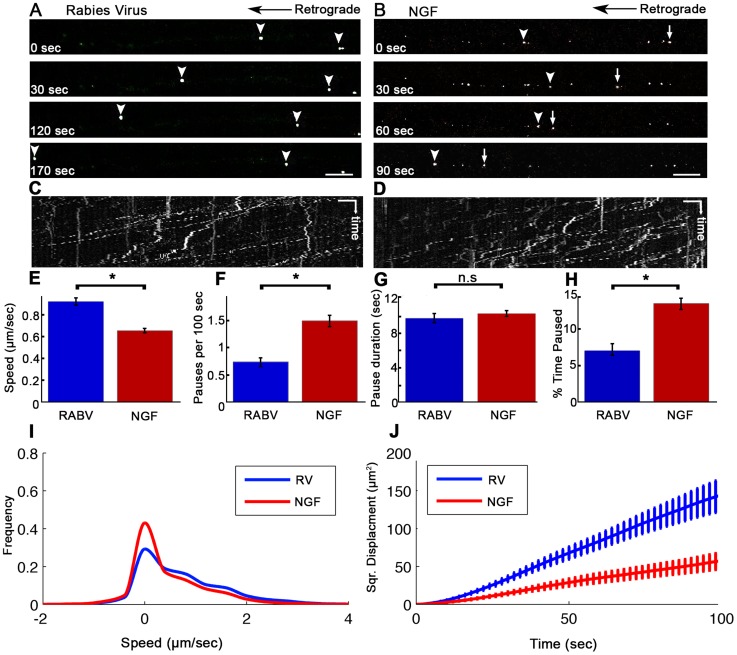
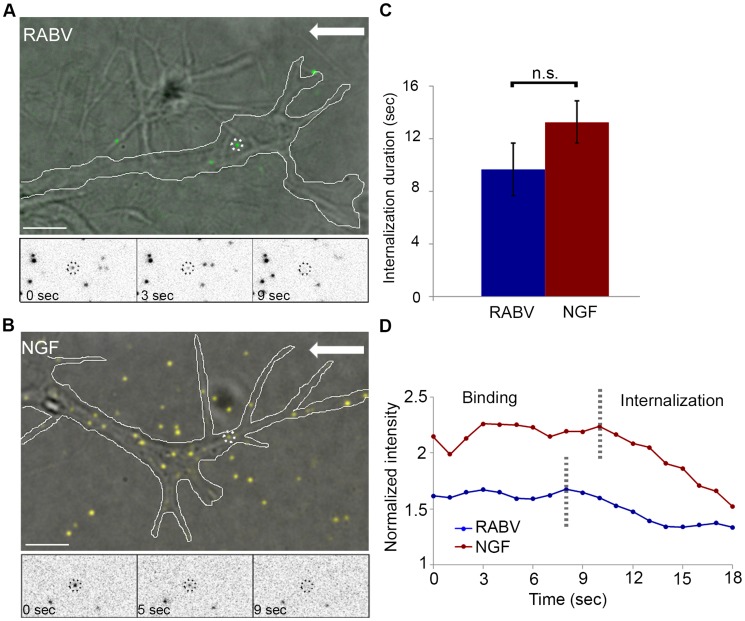
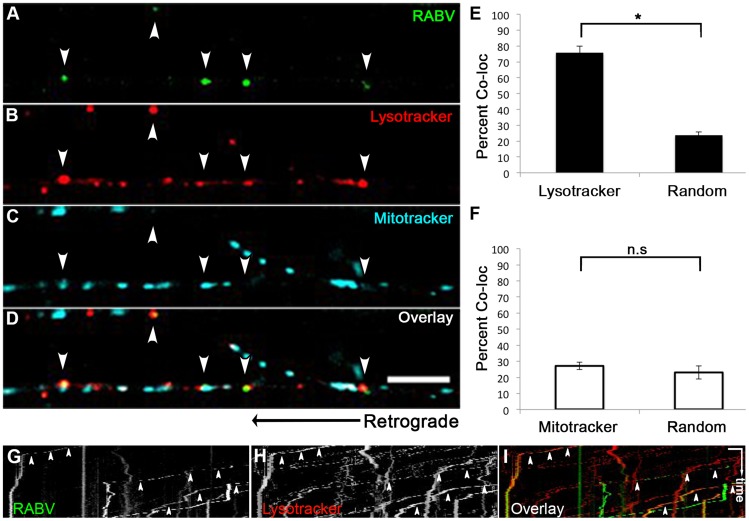
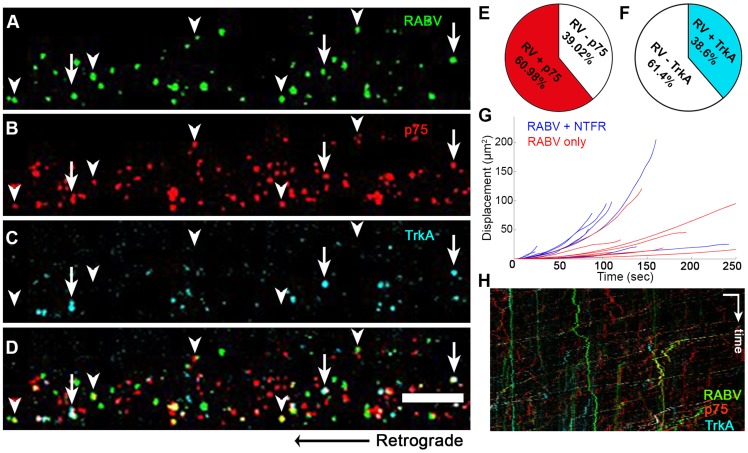
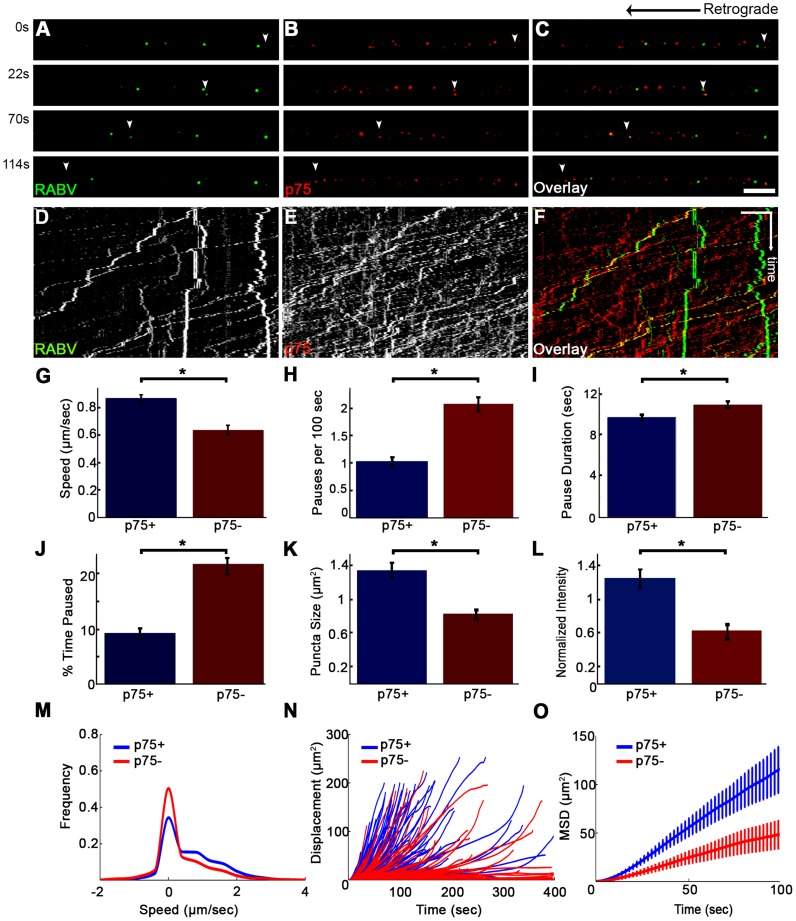
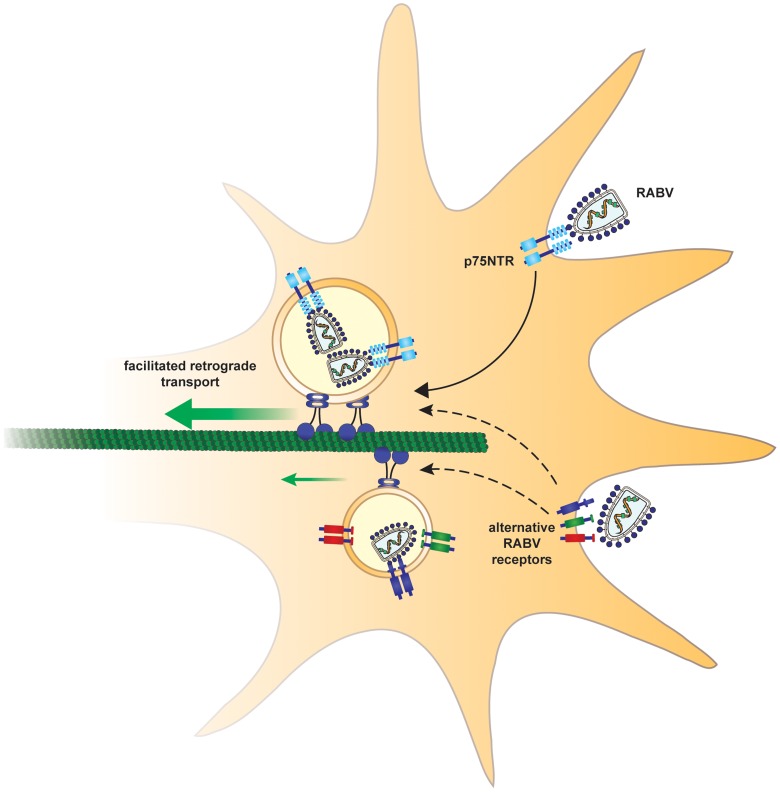
Rabies virus (RABV) is a neurotropic virus that depends on long distance axonal transport in order to reach the central nervous system (CNS). The strategy RABV uses to hijack the cellular transport machinery is still not clear. It is thought that RABV interacts with membrane receptors in order to internalize and exploit the endosomal trafficking pathway, yet this has never been demonstrated directly. The p75 Nerve Growth Factor (NGF) receptor (p75NTR) binds RABV Glycoprotein (RABV-G) with high affinity. However, as p75NTR is not essential for RABV infection, the specific role of this interaction remains in question. Here we used live cell imaging to track RABV entry at nerve terminals and studied its retrograde transport along the axon with and without the p75NTR receptor. First, we found that NGF, an endogenous p75NTR ligand, and RABV, are localized in corresponding domains along nerve tips. RABV and NGF were internalized at similar time frames, suggesting comparable entry machineries. Next, we demonstrated that RABV could internalize together with p75NTR. Characterizing RABV retrograde movement along the axon, we showed the virus is transported in acidic compartments, mostly with p75NTR. Interestingly, RABV is transported faster than NGF, suggesting that RABV not only hijacks the transport machinery but can also manipulate it. Co-transport of RABV and NGF identified two modes of transport, slow and fast, that may represent a differential control of the trafficking machinery by RABV. Finally, we determined that p75NTR-dependent transport of RABV is faster and more directed than p75NTR-independent RABV transport. This fast route to the neuronal cell body is characterized by both an increase in instantaneous velocities and fewer, shorter stops en route. Hence, RABV may employ p75NTR-dependent transport as a fast mechanism to facilitate movement to the CNS.


Conflict of interest statement

The authors have declared that no competing interests exist.

Figures

Figure 1
Figure 1. A microfluidic system for tracking retrograde transport in sensory axons.
(A) A Polydimethylsiloxane (PDMS) microfluidic chamber used for explant culture. (B,C) 40 µl interval towards the proximal compartment (top) prevents fluorescent dye from diffusing to the proximal compartment, allowing several hours of compartmental separation. Bright field (B) and fluorescent images (C) taken 7.5 hours after addition of Sulforhodamine B fluorescent dye to the distal compartment (bottom). (D) DRG explants are healthy and extend axons through micro-grooves to distal compartment after 2–3 days in vitro. One microgroove typically contains 2–5 axons. Mosaic of 10× images of Calcein-stained DRG explant taken after 5 DIV. Scale bar = 50 µm.
Figure 2
Figure 2. Rabies virus retrograde transport in DRG is faster and more directed than that of NGF.
Retrograde transport of (A) EGFP-RABV and (B) Quantum-dot conjugated NGF in DRG explants, roughly 2 hours after addition to distal axon compartment. Arrows and arrowheads pointing at transported particles. Scale bars = 10 µm. (C,D) Kymograph for EGFP-RABV and NGF respectively. Horizontal scale bars = 5 µm, vertical scale bars = 40 seconds. (E–J) Characterization of manually tracked directed particles of RABV (n = 209) and NGF (n = 149). (E) RABV is transported faster than NGF, as seen by average speed. (F) RABV is more directed and pauses less than NGF (G) Average pause duration was not significantly different. (H) RABV spent a smaller fraction of its run paused (I) Instantaneous velocities of RABV particles (n = 9885 events) are higher than those of NGF particles (n = 8973 events). Positive and negative values represent retrograde and anterograde velocities, respectively. (J) RABV particles travel larger net distances than NGF's, as seen by mean squared displacements. Data was pulled from two separate experiments. Error bars represent SEM, *p<0.0001.
Figure 3
Figure 3. RABV and NGF present similar internalization kinetics at the axon tip.
Live TIRF microscopy was used to track RABV and NGF internalization in DRG neuron tips. (A) EGFP-RABV (dashed circles) is detected on the surface of a neuron tip (white line). Lower panels present a particle (circled in black) disappearing gradually into the cell over a course of ∼9 seconds. (B) Qdot labeled NGF undergoes gradual internalization at the tip of the DRG neuron. (C) Average internalization time of RABV and NGF (n = 6 and 8, respectively), from onset of gradual signal reduction to its disappearance, do not differ significantly [p = 0.148]. (D) Representative time course of individual RABV (blue) and NGF (red) particles intensity profile, from detection on the cell surface to their internalization. Arrows represent direction of the neuron soma. Scale bars = 5 µm.
Figure 4
Figure 4. RABV binds and internalizes with p75NTR in DRG neuron tips.
Co-localization of EGFP-RABV with p75NTR is shown by live TIRF imaging and sub-pixel localization algorithms. (A) RABV-p75 particles shift from the periphery to the center of the growth cone, where they are internalized into the cell. Lower panels zoom in on dashed square, showing co-localized puncta (left) shifting towards the center of the growth cone (middle) until finally internalized (right). (B) Presentation of six separate events of RABV and p75NTR binding and internalization on the surface of the growth cone shown in (A). Colored trajectories denote displacement from point of detection to point of disappearance. (C) RABV and p75NTR are internalized together, illustrated by corresponding plots of puncta intensity over time (normalized to background), calculated for co-localized particles shown in lower panels of (A). Scale bars = 5 µm. (D) Zoom-in on colocalized RABV and p75 spot, taken from panel (A), scale bar = 1 µm. (E) Overlay of 1D-Gaussian fits of p75 and RABV intensity profiles at the x-axis of the image in panel (D). (F) Representative overlay of radial symmetry fits of the x-y intensity profiles of p75 and RABV spots. σ is the standard deviation of each fitting function; distance between the two spot centers is 51.3 nm. (G) Knockdown of p75NTR decreases rabies virus infection for shorts time incubation. DRGs embryonic cells infected with lentiviral vectors (LV) containing 4 different EGFP-tagged shRNA's against p75NTR or LV-EGFP, were transfected with RABV for 30 or 120 minutes. Low levels of infected neurons were found in shRNA-p75-EGFP cells Average RABV infection rates were normalized to LV-EGFP controls (n = 4 experiments, error bars = SEM, *p<0.005, **p<0.0005).
Figure 5
Figure 5. Co-transport of RABV and NGF.
(A–C) EGFP-RABV and Qdot-NGF were simultaneously added to the distal compartment of a DRG explant at 3DIV. Dual-channel live imaging revealed multiple events of RABV co-transported with NGF, illustrated by corresponding images from either channel and overlay. Arrowheads: co-localized puncta trafficked over time. Scale bar = 10 µm. (D–F) Kymographs of EGFP-RABV and Qdot-NGF show mutual transport of RABV and NGF. (G) Two populations of RABV-NGF particles were identified by distribution of average track speeds, as seen by fitted curve (red, minima point represented by dashed line, n = 46). (H–J) “Slow” (n = 38) and “fast” (n = 8) populations according to the minima (1.01 µm/sec) in (G). “Slow” tracks paused more than “fast” tracks (H), and though stop duration was not significantly different (I), spent a larger fraction of their travel paused (J). Data is pulled from two experiments. Error bars represent SEM, *p<0.02.
Figure 6
Figure 6. RABV is transported in acidic compartments in sensory axons.
(A–D), Multi-channel live imaging of EGFP-RABV retrograde transport in DRG axons, along with the fluorescent cellular markers Lysotracker Red and Mitotracker Deep Red. Arrowheads: RABV particles positive for Lysotracker Red. Scale bar = 10 µm. (E) 75.9% of RABV puncta are co-localized with Lysotracker Red, thus found in acidic compartments along the axon, as opposed to 23.6% co-localization with random Lysotracker frames from the same time lapse (n = 3 separate experiments). (F) RABV does not co-localize with Mitotracker. (G–I) Kymographs of EGFP-RABV (G) and Lysotracker (H) are overlaid in (I) show kinetics of RABV (green) and Lysotracker (red) retrograde transport in DRG axons. Arrowheads: acidic transport of RABV. Horizontal scale bar = 5 µm, vertical scale bar = 40 seconds. *p<0.0005. n.s = non significant.
Figure 7
Figure 7. RABV is retrogradely transported with neurotrophin receptors.
(A–D), Retrograde transport of EGFP-RABV, added to the distal axon compartment of DRG explant previously treated with fluorescent antibodies against p75NTR and TrkA. Arrowheads: RABV puncta positive for p75NTR, arrows: RABV puncta positive for p75NTR and TrkA. Scale bar = 10 µm. (E,F) Co-localisation of RABV with p75NTR and TrkA calculated from two and one experiments, respectively. (G) Trajectories of RABV trafficked with neurotrophin receptors (NTFR, Blue) or without (Red), illustrating a more processive displacement over time of RABV with NTFR. (H) Merged kymographs of RABV (green) p75NTR (red) and TrkA (cyan), drawn for multi-channel time lapse. Vertical scale bar = 5 µm, horizontal scale bar = 40 seconds.
Figure 8
Figure 8. RABV travels faster and is more directed when transported with p75NTR.
(A–C) Multi-channel live imaging of EGFP-RABV 2 hours after addition to distal axon compartment of DRG explant previously treated with a fluorescent antibody against p75NTR. Arrowheads: p75NTR-positive RABV puncta, scale bar = 10 µm. (D,E) Kymographs of and P75NTR extracted from time lapse depicted in (A–C). (F) RABV-only tracks (green) are less directed than RABV-p75NTR tracks (yellow), as shown when overlaying corresponding kymographs. Vertical scale bar = 5 µm, horizontal scale bar = 40 seconds. (G–O) Characterization of directed RABV puncta, transported with and without p75NTR, n = 184 and n = 122, respectively. (G) RABV presents higher speeds when transported with p75NTR, due to less frequent (H) and shorter pauses (I). Overall RABV-p75NTR spent less time paused on average (J), Diameter and intensity measurements revealed that RABV puncta positive for p75NTR were larger (K) and had higher intensity levels (L) than p75NTR-negative puncta. (M–O) p75NTR positive puncta (blue) are faster, more directed and present higher displacements over time, compared to p75NTR negative puncta (red), illustrated by distribution of instantaneous velocities in (M) (RABV+p75: n = 8051 events; RABV-p75: n = 7423 events) displacement plotted over time (N) and mean square displacement (O). Data is pulled from two separate experiments, error bars represent SEM. *p<0.05.
Figure 9
Figure 9. Suggested model.
In order to arrive at the cell body and subsequently the CNS, rabies virus hijacks a fast route using the p75NTR endosomal pathway. In a p75NTR dependent path, RABV manipulates the axonal transport machinery to migrate faster to the cell body. An alternative, slower path, may involve alternative RABV receptors.

References

    1. Salinas S, Schiavo G, Kremer EJ (2010) A hitchhiker's guide to the nervous system: the complex journey of viruses and toxins. Nat Rev Microbiol 8: 645–655 Available: http://www.ncbi.nlm.nih.gov/pubmed/20706281. Accessed 27 January 2014. - PubMed
    1. Zampieri N, Jessell TM, Murray AJ (2014) Mapping Sensory Circuits by Anterograde Transsynaptic Transfer of Recombinant Rabies Virus. Neuron 1–13 Available: http://www.ncbi.nlm.nih.gov/pubmed/24486087. Accessed 4 February 2014. - PMC - PubMed
    1. Ugolini G (2008) Use of rabies virus as a transneuronal tracer of neuronal connections: implications for the understanding of rabies pathogenesis. Dev Biol (Basel) 131: 493–506 Available: http://www.ncbi.nlm.nih.gov/pubmed/18634512. Accessed 11 March 2014. - PubMed
    1. Wickersham IR, Finke S, Conzelmann K-K, Callaway EM (2007) Retrograde neuronal tracing with a deletion-mutant rabies virus. Nat Methods 4: 47–49 Available: http://www.pubmedcentral.nih.gov/articlerender.fcgi?artid=2755236&tool=p.... Accessed 27 January 2014. - PMC - PubMed
    1. Wickersham IR, Lyon DC, Barnard RJO, Mori T, Finke S, et al. (2007) Monosynaptic restriction of transsynaptic tracing from single, genetically targeted neurons. Neuron 53: 639–647 Available: http://www.pubmedcentral.nih.gov/articlerender.fcgi?artid=2629495&tool=p.... Accessed 21 January 2014. - PMC - PubMed

Publication types

Substances