. 2014 Sep;9(9):2267-84.
doi: 10.1038/nprot.2014.153. Epub 2014 Aug 28.

Measuring the activity of protein variants on a large scale using deep mutational scanning

Affiliations

Measuring the activity of protein variants on a large scale using deep mutational scanning

Douglas M Fowler et al. Nat Protoc. 2014 Sep.

Abstract

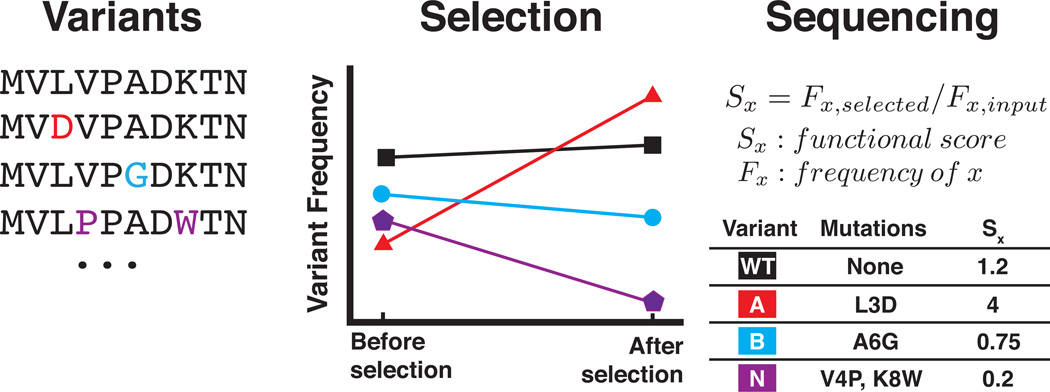
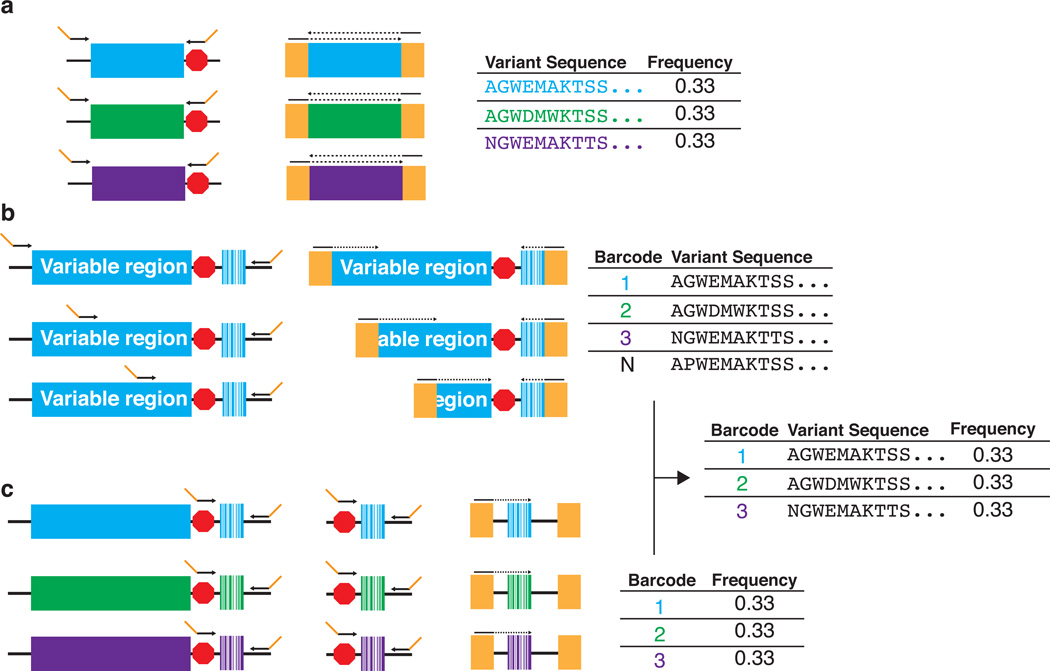
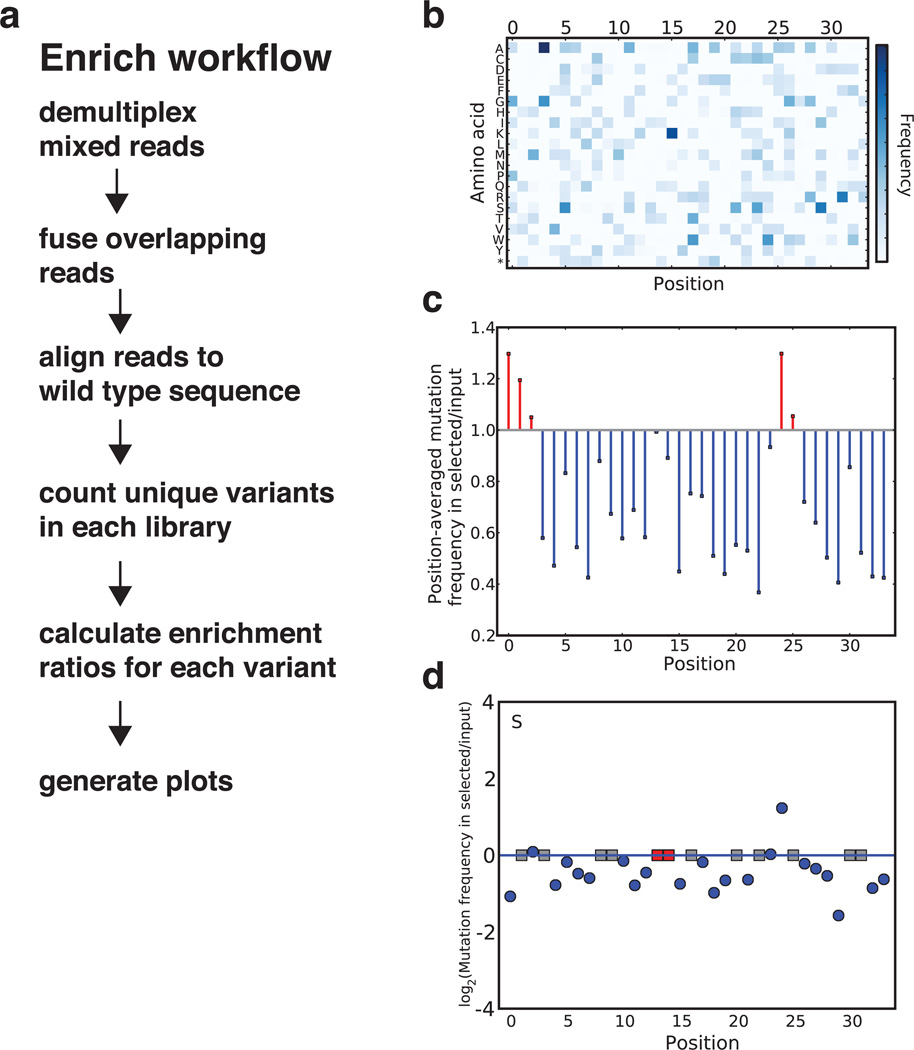
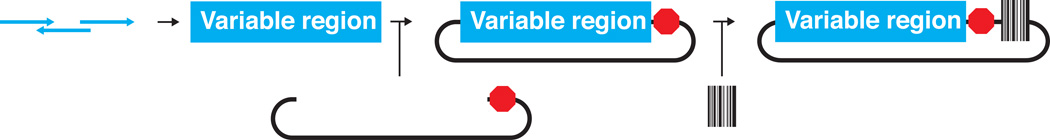
Deep mutational scanning marries selection for protein function to high-throughput DNA sequencing in order to quantify the activity of variants of a protein on a massive scale. First, an appropriate selection system for the protein function of interest is identified and validated. Second, a library of variants is created, introduced into the selection system and subjected to selection. Third, library DNA is recovered throughout the selection and deep-sequenced. Finally, a functional score for each variant is calculated on the basis of the change in the frequency of the variant during the selection. This protocol describes the steps that must be carried out to generate a large-scale mutagenesis data set consisting of functional scores for up to hundreds of thousands of variants of a protein of interest. Establishing an assay, generating a library of variants and carrying out a selection and its accompanying sequencing takes on the order of 4-6 weeks; the initial data analysis can be completed in 1 week.


Figures

Figure 1
Figure 1. Deep mutational scanning workflow
A deep mutational scan starts with a library of variants of a protein (left panel). These variants are expressed in a system that links the sequence of each variant to the functional capacity of the variant (e.g. phage display or plasmids in yeast cells). Then, the library is subjected to selective pressure for the function of the protein (middle panel). Selective pressure increases the frequency of variants with enhanced activity (middle panel, red and black lines) and decreases the frequency of variants with diminished activity (middle panel, blue and purple lines). High-throughput DNA sequencing is used to quantify the frequency of each variant in the library throughout the selection. An activity score is derived from the change in frequency for each variant (right panel). In the example shown, only two time points are used to calculate the functional score. Multiple time points can be collected and analyzed by regression. In cases where a variant present in the input library is not observed in the selected library, the experimenter can add a single read pseudo-count for each drop-out variant in the post-selection data. This pseudo-count will enable the experimenter to calculate enrichment ratios for drop-out variants.
Figure 2
Figure 2. Variable library sequencing methods
A deep mutational scan can be conducted using either direct sequencing of the variable region or subassembly of the variable region. (a) In direct sequencing, the variable region (three variants are depicted in blue, green and purple; the red octagon indicates the stop codon) is amplified using primers that append Illumina-compatible cluster generation sequences (gold). Overlapping, paired-end reads are acquired and the frequency of each variant in the library is calculated (the solid line indicates the sequencing primer annealing site, the dotted line indicates the acquired sequencing read). (b, c) In subassembly, each variant is identified by a unique DNA barcode. First, the variable region is amplified (a single variant is shown in blue; the red octagon indicates the stop codon) using a set of primers that tile across the variable region. These primers generate amplicons of differing lengths that contain Illumina-compatible cluster generation sequences (gold) (b, left panel). Next, each a read pair is acquired from each amplicon; one reads the barcode and the other reads a part of the variable region (b, middle panel, the solid line indicates the sequencing primer annealing site, the dotted line indicates the acquired sequencing read). All partial variable region reads associated with each barcode are collected from the high throughput sequencing data and aligned, producing a full-length sequence of the variable region associated with each barcode. The result is a barcode lookup table (b, right panel). To measure the frequency of each barcode in a library, barcodes are first amplified (three barcodes are depicted in blue, green and purple) using a set of primers that append Illumina-compatible cluster generation sequences (gold) (c). Each barcode is sequenced and the frequency of each barcode is calculated (c, the solid line indicates the sequencing primer annealing site, the dotted line indicates the acquired sequencing read). Finally, the full-length variable region associated with each barcode is identified using the barcode lookup table.
Figure 3
Figure 3. Using the Enrich software to analyze deep mutational scanning data
(a) The Enrich workflow. Enrich is designed with a modular architecture; each step in the list corresponds to a module in the software. Enrich produces three visualizations; examples from the data set included with Enrich are shown in panels bd. (b) The diversity within a library is illustrated by a heatmap of the frequency of each position–mutation combination. (c) The position-averaged change in mutational frequency between two libraries. (d) The log2-scaled enrichment ratio for each position-mutation combination is plotted, individually organized both by position and by amino acid (a single amino acid, serine, is shown). Blue dots indicate the enrichment or depletion of substitutions. Red squares correspond to wild-type residues. Grey squares correspond to unobserved mutations. Figure and text partially reproduced.
Figure 4
Figure 4. Creating a barcoded library from Gibson-assembled oligonucleotides
Several single-stranded oligonucleotides are combined into one double-stranded DNA fragment using Gibson assembly (left panel). This fragment is cloned into a suitable plasmid (middle panel) and then reduced in complexity to the desired number of protein variants. Finally, a unique DNA barcode is added to each library member (right panel) and the library is reduced in complexity to the desired number of barcodes per protein variant.

References

    1. Cunningham BC, Wells JA. High-resolution epitope mapping of hGH-receptor interactions by alanine-scanning mutagenesis. Science. 1989;244:1081–1085. - PubMed
    1. Pál G, Kouadio JLK, Artis DR, Kossiakoff AA, Sidhu SS. Comprehensive and quantitative mapping of energy landscapes for protein-protein interactions by rapid combinatorial scanning. J. Biol. Chem. 2006;281:22378–22385. - PubMed
    1. Brocchieri L, Karlin S. Protein length in eukaryotic and prokaryotic proteomes. Nucleic Acids Res. 2005;33:3390–3400. - PMC - PubMed
    1. Fowler DM, et al. High-resolution mapping of protein sequence-function relationships. Nat. Methods. 2010;7:741–746. - PMC - PubMed
    1. Araya CL, Fowler DM. Deep mutational scanning: assessing protein function on a massive scale. Trends Biotechnol. 2011;29:435–442. - PMC - PubMed

Publication types

MeSH terms