Comparative Study
. 2014 Dec;76(6):500-7.
doi: 10.1038/pr.2014.128. Epub 2014 Aug 28.

A detailed comparison of mouse and human cardiac development

Affiliations
Comparative Study

A detailed comparison of mouse and human cardiac development

Anita Krishnan et al. Pediatr Res. 2014 Dec.

Abstract

Background: Mouse mutants are used to model human congenital cardiovascular disease. Few studies exist comparing normal cardiovascular development in mice vs. humans. We carried out a systematic comparative analysis of mouse and human fetal cardiovascular development.

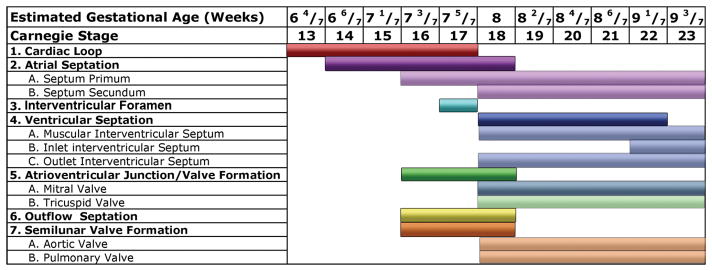
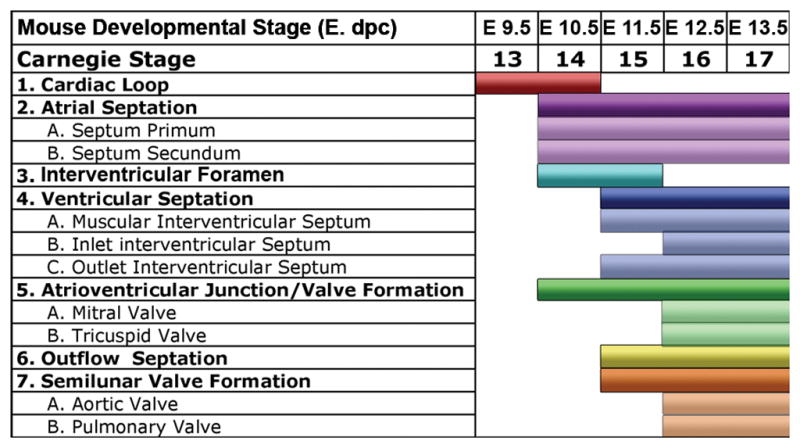
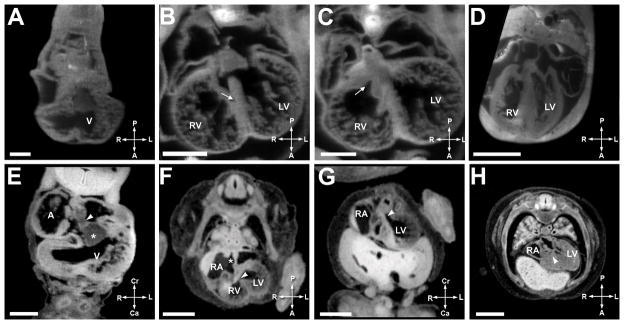
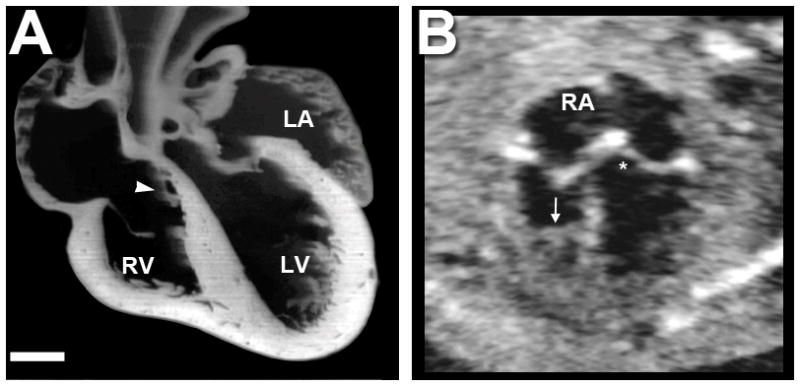
Methods: Episcopic fluorescence image capture (EFIC) was performed on 66 wild-type mouse embryos from embryonic day (E) 9.5 to birth; 2-dimensional and 3-dimensional datasets were compared with EFIC and magnetic resonance images from a study of 52 human fetuses (Carnegie stage 13-23).

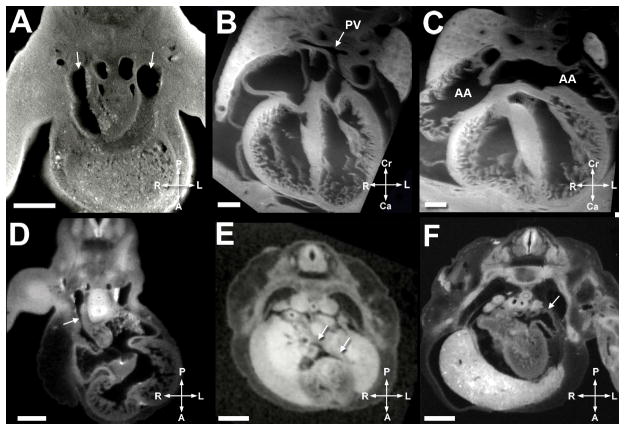
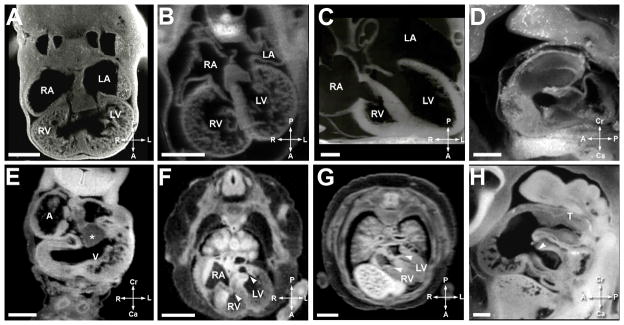
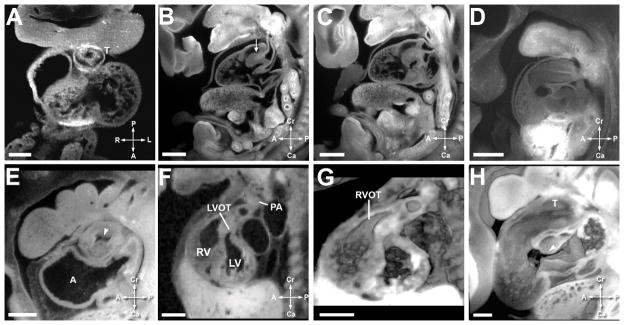
Results: Time course of atrial, ventricular, and outflow septation were outlined and followed a similar sequence in both species. Bilateral venae cavae and prominent atrial appendages were seen in the mouse fetus; in human fetuses, atrial appendages were small, and a single right superior vena cava was present. In contrast to humans with separate pulmonary vein orifices, a pulmonary venous confluence with one orifice enters the left atrium in mice.

Conclusion: The cardiac developmental sequences observed in mouse and human fetuses are comparable, with minor differences in atrial and venous morphology. These comparisons of mouse and human cardiac development strongly support that mouse morphogenesis is a good model for human development.


Figures

Figure 1
Figure 1
Stages of development in the human heart are outlined
Figure 2
Figure 2
Stages of development in the mouse heart are outlined
Figure 3
Figure 3. Comparative Ventricular Septation
A. Mouse heart at E10.5. Scale bar = 250 micrometers.’V’ is ventricle. B. Mouse heart at E12.5. Scale bar = 550 micrometers. ‘RV’ is right ventricle, ‘LV is left ventricle’, and the arrowhead indicates the muscular ventricular septum. C. Mouse heart at E12.5. Scale bar = 450 micrometers. The arrowhead indicates the outlet ventricular septum. D. Mouse heart at E13.5. Scale bar = 600 micrometers. E. Human heart at EGA 6 6/7 weeks (CS 14). Scale bar = 500 micrometers. ‘A’ is atrium, ‘*’ indicates the endocardial cushion, and arrowhead shows the mesenchymal cap. F. Human heart at EGA 8 (CS 18). Scale bar = 1500 micrometers. ‘RA’ is the right atrium, arrowhead indicates the interventricular foramen, and ‘*’ shows the septum primum. G. Human heart at EGA 8 (CS 18). Scale bar = 1500 micrometers. The arrowhead shows the outlet ventricular septum. H. Human heart at EGA 9 1/7 weeks (CS 22). Scale bar = 2000 micrometers. The arrowhead shows the closed interventricular foramen. 3A to D illustrate ventricular septation in the mouse and 3E–3H illustrate ventricular septation in the human. Figures 3A and 3E show the cardiac loop in the mouse and human respectively. The arrowhead in 3E illustrates the atrial spine fusing with the inferior cushion (*). The muscular ventricular septum begins to develop at 7 3/7 weeks (CS 16) in the human and E 10.5 in the mouse. Note the rapid progression of the muscular interventricular septum by E12.5 (3B) in the mouse and EGA 8 weeks (CS 18) (3F) in the human. At this stage the outlet septum, indicated by the arrowhead in 3G, is closed (3C mouse, 3G human), but the interventricular foramen (arrowhead in 3F) comprises a small portion of what is clinically termed the membranous and inlet ventricular septum. 3D (mouse, E13.5) and 3H (human, EGA 9 1/7 weeks, CS 22) show closure of the final portion of the interventricular foramen (arrowhead).
Figure 4
Figure 4
A. Mouse heart in frontal plane section immediately at term birth. Scale bar = 400 micrometers. Note the tricuspid valve septal leaflet (white arrow) has not delaminated from the ventricular septum. The tricuspid valve annulus sits inferior to the mitral valve annulus, similar to in the human. B. A fetal echocardiographic image from a human fetus in the second trimester. RA indicates the right atrium. An arrow indicates the presence of a moderator band. The ‘*’ indicates the atrioventricular septum, or area of offset between the mitral and tricuspid valve.
Figure 5
Figure 5
A. Mouse heart at E11.5. Scale bar = 400 micrometers. Arrowheads indicate the bilateral superior vena cavae present in the mouse. B. Mouse heart at E14.5. Scale bar = 350 micrometers. ‘PV’ and the arrow denote the single pulmonary vein orifice present in the mouse. C. Mouse heart at E14.5. Scale bar = 350 micrometers. ‘AA’ indicate the atrial appendages, which are large and constitute a significant portion of the mouse atria. D. Human heart at EGA 7 3/7 weeks (CS 16). Scale bar = 900 micrometers. Arrow denotes the single right superior vena cava. E. Human heart at EGA 8 weeks (CS 18). Scale bar = 900 micrometers. Arrowheads indicate the separate right and left pulmonary vein orifices. F. Human heart at EGA 8 weeks (CS18). Scale bar = 900 micrometers. Arrowhead indicates the atrial appendage which is small in the human in comparison to the mouse. Figures 5A–F illustrate the comparative venous and atrial anatomy in the mouse and human. Bilateral superior vena cavae (5A) are present in the mouse in contrast to a single right superior vena cava in the human (5D). The pulmonary veins in the human enter in one orifice in the mouse (5B) in contrast to separate orifices in the human (5E). Atrial appendages are large in mouse (5C) and small in the human (5F).
Figure 6
Figure 6. Comparative Atrioventricular Valve Morphogenesis
A. Mouse heart at E11.5. Scale bar = 400 micrometers. ‘RA’ is the right atrium, ‘RV’ is the right ventricle, ‘LA’ is the left atrium, and ‘LV’ is the left ventricle. B. Mouse heart at E12.5. Scale bar = 550 micrometers. C. Mouse heart at E17.5. Scale bar = 400 micrometers. D. Mouse heart at E11.5. Scale bar = 400 micrometers. E. Human heart at EGA 6 6/7 weeks gestation (CS14). Scale bar = 500 micrometers. ‘A’ indicates the atrium, ‘V’ is the ventricle, and ‘*’ the inferior cushion. F. Human heart at EGA 8 weeks gestation (CS 18). Scale bar = 1500 micrometers. The arrowheads indicate the AV valve orifices. G. Human heart at EGA 9 3/7 weeks gestation (CS 23). Scale bar = 2000 micrometers. The arrowheads indicate the AV valve orifices. H. Human heart at EGA 7 3/7 weeks gestation (CS16). Scale bar = 400 micrometers. ‘T’ is the truncus arteriosus, and the arrowhead indicates the AV valve orifice. Figures 6A–6D illustrate AV Valve morphogenesis in the mouse; Figures 6E–6H show the same in the human. Figures 6A and 6E show the mouse and human heart in the looped stage, with large endocardial cushion. Figure 6B (mouse) and 6F (human) show two distinct atrioventricular communications with thickened atrioventricular valves. The arrowheads in 6F, 6G, and 6H indicate the AV valve orifices as they develop. Figures 6C and 6G show the atrioventricular valves acquiring a thinner more mature appearance. Figure 6D shows a sagittal view of the atrioventricular junction at the looped heart stage of the mouse and 6H highlights a similar figure in the human.
Figure 7
Figure 7. Comparative Outflow Tract Septation
A. Mouse heart at E10.5. Scale bar = 135 micrometers. ‘T’ indicates the truncus arteriosus. B. Mouse heart at E12.5. Scale bar = 480 micrometers. The arrowhead indicates the septation between the aortic and pulmonary outflow tracts. C. Mouse heart at E12.5. Scale bar = 480 micrometers. D. Mouse heart at E11.5. Scale bar = 470 micrometers. E. Human heart at EGA 7 1/7 weeks (CS15). Scale bar = 630 micrometers. ‘A’ indicates the atrium and arrowhead shows unseptated lumen of the outflow. F. Human heart at EGA 8 weeks (CS 18). Scale bar = 1350 micrometers. ‘LVOT’ is the left ventricular outlow, ‘RV’ is the right ventricle, ‘LV’ is the left ventricle, and ‘PA’ is the pulmonary artery. G. Human heart at EGA 8 weeks (CS 18). Scale bar = 1350 micrometers. ‘RVOT’ is the right ventricular outflow tract. H. Human heart at EGA 7 3/7 weeks (CS16). Scale bar = 400 micrometers. Figures 7A–7D illustrate outflow tract septation in the murine heart. Figures 7E–7H illustrate the same in the human heart. Figures 7A (mouse) and 7E (human) show the outflow cushions in the unseptated outflow tract during the cardiac loop stage. Figures 7B–C show distinct left and right ventricular outflow tracts in the mouse; Figures 7F and 7G show the same in the human. Figure 7G is a 3 dimensional reconstruction of the image in Figure 7F, and both are at EGA 8 (CS 18). At this stage in the mouse and human, the semilunar valve area is occupied by thick likely mesenchymal tissue, and discrete valve leaflets are not seen. Figure 7D shows a 3 dimensional reconstruction of the atrioventricular and outflow cushions in a mouse at stage E11.5 and 7H shows a comparable reconstruction in the human. The characteristic ‘dog leg bend’ separating the proximal and distal outflow areas can be seen. The atrioventricular and outflow cushions are separate. In these images, the outflow cushions appear to be 2 long cushions, as opposed to separate proximal and distal cushions.

References

    1. Mitchell SCKS, Berendes HW. Congenital heart disease in 56,109 births. Circulation. 1971;43:323–332. - PubMed
    1. DeLaughter DM, Saint-Jean L, Baldwin HS, et al. What chick and mouse models have taught us about the role of the endocardium in congenital heart disease. Birth Defects Res A Clin Mol Teratol. 2011;91:511–525. - PMC - PubMed
    1. MacGrogan D, Nus M, de la Pompa JL. Notch signaling in cardiac development and disease. Curr Top Dev Biol. 2010;92:333–365. - PubMed
    1. Webb S, Brown NA, Anderson RH. Formation of the atrioventricular septal structures in the normal mouse. Circ Res. 1998;82:645–656. - PubMed
    1. Nishimura H, Takano K, Tanimura T, et al. Normal and abnormal development of human embryos: first report of the analysis of 1,213 intact embryos. Teratology. 1968;1:281–290. - PubMed

Publication types