Clinical Trial
. 2014;16(2):R90.
doi: 10.1186/ar4555. Epub 2014 Apr 30.

Synovial phenotypes in rheumatoid arthritis correlate with response to biologic therapeutics

Clinical Trial

Synovial phenotypes in rheumatoid arthritis correlate with response to biologic therapeutics

Glynn Dennis Jr et al. Arthritis Res Ther. 2014.

Abstract

Introduction: Rheumatoid arthritis (RA) is a complex and clinically heterogeneous autoimmune disease. Currently, the relationship between pathogenic molecular drivers of disease in RA and therapeutic response is poorly understood.

Methods: We analyzed synovial tissue samples from two RA cohorts of 49 and 20 patients using a combination of global gene expression, histologic and cellular analyses, and analysis of gene expression data from two further publicly available RA cohorts. To identify candidate serum biomarkers that correspond to differential synovial biology and clinical response to targeted therapies, we performed pre-treatment biomarker analysis compared with therapeutic outcome at week 24 in serum samples from 198 patients from the ADACTA (ADalimumab ACTemrA) phase 4 trial of tocilizumab (anti-IL-6R) monotherapy versus adalimumab (anti-TNFα) monotherapy.

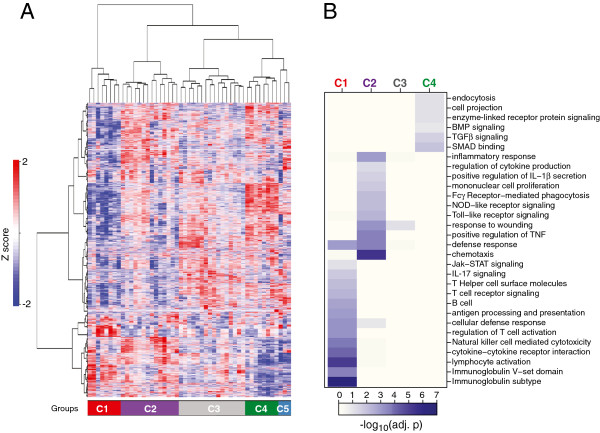
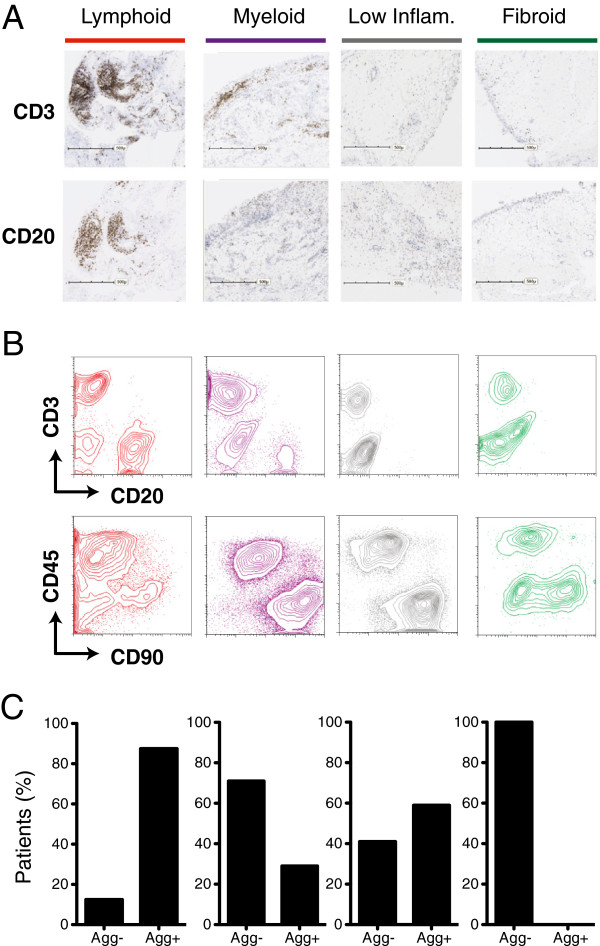
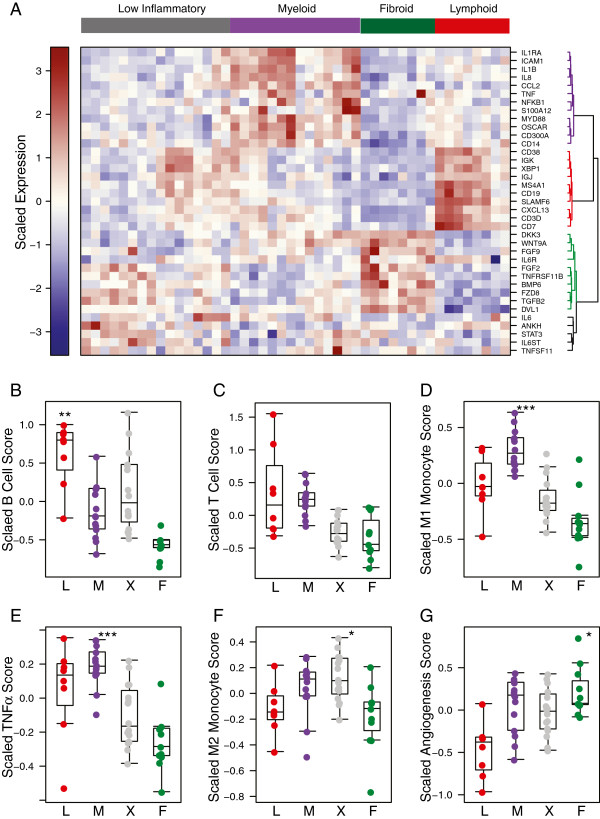
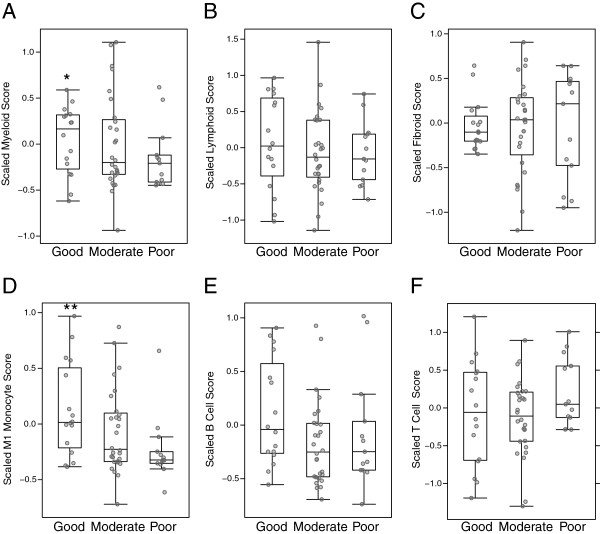
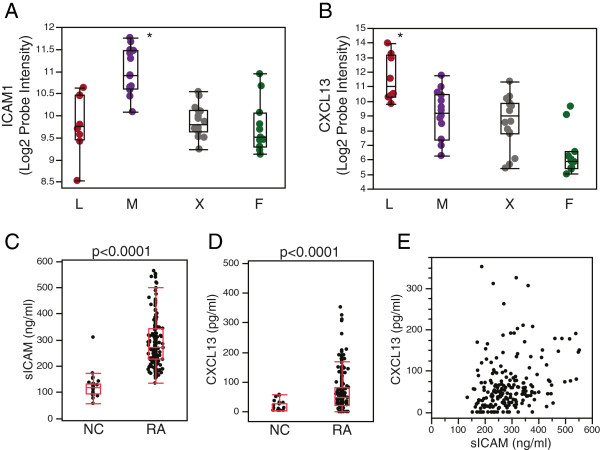
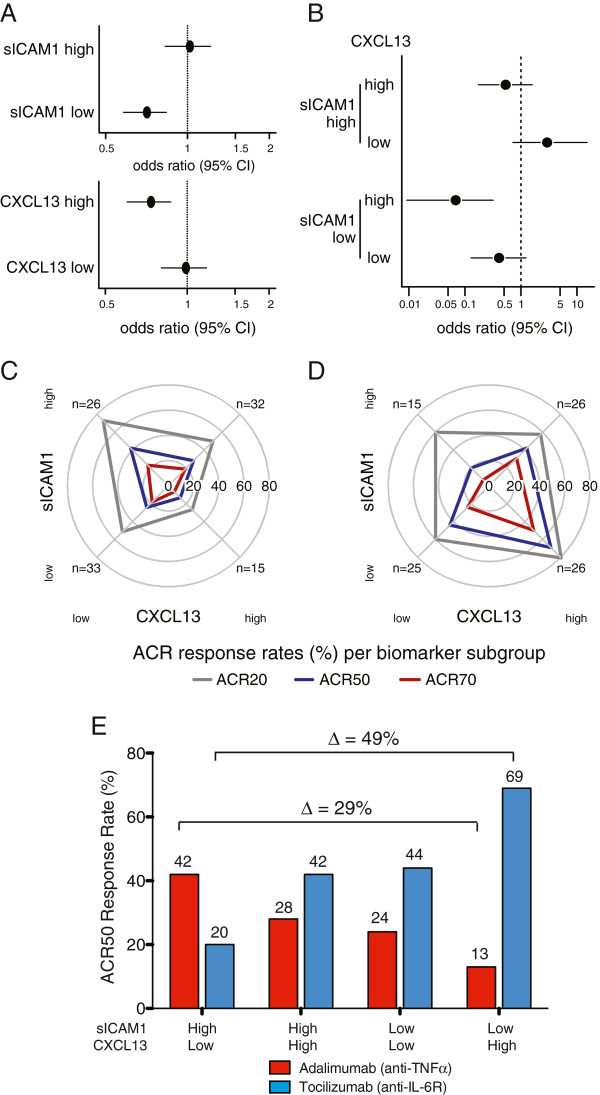
Results: We documented evidence for four major phenotypes of RA synovium - lymphoid, myeloid, low inflammatory, and fibroid - each with distinct underlying gene expression signatures. We observed that baseline synovial myeloid, but not lymphoid, gene signature expression was higher in patients with good compared with poor European league against rheumatism (EULAR) clinical response to anti-TNFα therapy at week 16 (P =0.011). We observed that high baseline serum soluble intercellular adhesion molecule 1 (sICAM1), associated with the myeloid phenotype, and high serum C-X-C motif chemokine 13 (CXCL13), associated with the lymphoid phenotype, had differential relationships with clinical response to anti-TNFα compared with anti-IL6R treatment. sICAM1-high/CXCL13-low patients showed the highest week 24 American College of Rheumatology (ACR) 50 response rate to anti-TNFα treatment as compared with sICAM1-low/CXCL13-high patients (42% versus 13%, respectively, P =0.05) while anti-IL-6R patients showed the opposite relationship with these biomarker subgroups (ACR50 20% versus 69%, P =0.004).

Conclusions: These data demonstrate that underlying molecular and cellular heterogeneity in RA impacts clinical outcome to therapies targeting different biological pathways, with patients with the myeloid phenotype exhibiting the most robust response to anti-TNFα. These data suggest a path to identify and validate serum biomarkers that predict response to targeted therapies in rheumatoid arthritis and possibly other autoimmune diseases.

Trial registration: ClinicalTrials.gov NCT01119859


Figures

Figure 1
Figure 1
Stratification of rheumatoid arthritis (RA) transcriptional heterogeneity into homogeneous molecular phenotypes.(A) Two-dimensional hierarchical clustering of approximately 7,000 probes (rows), representing quantile-normalized and scaled expression values of the top 40% most variable probe sets (variability assessed using SD), in 49 RA patients (columns) inferring five molecular subgroups of synovial tissues. Patient-sample ordering and dendrogram based on agglomerative hierarchical clustering (Ward method): resulting tree used to select patient subgroups; number of patient subgroups selected to maximize mean silhouette width and k-nearest neighbor distances (k = 5 considered optimal). z-score-based color intensity scale for each probe in each sample is shown. Patient samples clustering into five main branches are color-coded left to right (bottom of the heatmap): C1 = red (n = 8), C2 = purple (n = 14), C3 = gray (n = 16), C4 = green (n = 8), C5 = light blue (n = 3). (B) Heatmap depicting over-represented Database for Annotation, Visualization and Integrated Discovery biological process categories for genes upregulated in the four largest synovial clusters. Each column represents one cluster (C1 to C4), color-coordinated as in panel A. Each row corresponds to a biological process category. Heatmap colors reflect log10 (adjusted P-value) from modified Fisher exact test for categorical over-representation. Annotation for each cluster based on the key biological processes is indicated. BMP, bone morphogenetic protein; TGF, transforming growth factor; SMAD, Sma Mothers Against Decapentaplegic; NOD, nucleotide-binding oligomerization domain; JAK-STAT, Janus kinase-signal transducer and activator of transcription.
Figure 2
Figure 2
Rheumatoid arthritis (RA) molecular phenotypes reflect cellular and biological differences. (A) Immunohistochemical detection of T cells (CD3) and B cells (CD20) in synovial tissue sections. Columns correspond to representative sections for each of the RA molecular phenotypes designated by color-coordinated bars on top. Scales on images refer to a length of 500 microns. (B) Fluorescence activated cell-sorting analysis of fresh synovial tissue samples. Cells were stained with CD3- and CD20- gated by forward and side-scatter lymphocyte parameters and fluorescent intensities plotted in a scatter-plot with T cells (CD3) on the y-axis and B cells (CD20) on the x-axis (top panel). Contour-plots from the same patients above showing macrophages (CD45+, lymphocyte-gate exclusion) along the y-axis and fibroblasts (CD90) along the x-axis (bottom panel). Samples are arranged left to right according to their phenotype membership as in panel A. (C) Bar plots of the percentages of patient synovial tissues that contained non-aggregated (Agg-) or aggregated (Agg+) cellular infiltration as determined by immunohistological assessment of CD3- and CD20-positive cells.
Figure 3
Figure 3
Distribution of biological process genes and gene sets across the synovial tissue phenotypes. (A) Heatmap of expression of selected genes in lymphoid (red), myeloid (purple) and fibroid (green) patient subgroups. Patient-sample clusters are supervised by prior phenotype assignment, and genes are distributed by unsupervised clustering. (B-G) Distribution of biological processes for each synovial phenotype (L = lymphoid, M = myeloid, X = low inflammatory, F = fibroid) was assessed using predefined gene sets to interrogate the respective microarray datasets. Gene sets reflecting B cells (B), T cells (C), M1 classically activated monocytes (D), genes induced by TNFα (E), M2 alternatively activated monocytes (F) and angiogenesis (G). Each subgroup was compared to all other groups using the f-test, and significant Benjamini-Hochberg-corrected P-values for a group compared with all other groups are indicated (*P ≤0.05, **P ≤0.01, ***P ≤0.001) for subgroups with positive t-statistic values.
Figure 4
Figure 4
Pretreatment magnitude of gene sets derived from the synovial myeloid phenotype and classically activated monocytes correlates with clinical response to anti-TNFα (infliximab) therapy. Analysis of synovial tissue microarray data from 62 rheumatoid arthritis patients in GSE21537 prior to initiation of infliximab (anti-TNFα therapy). Scores for gene sets for phenotypes, defined from the Michigan cohort training data, as well as gene sets derived from purified immune cell lineages (see Methods), were calculated from the GSE21537 data and compared against anti-TNFα clinical outcome at 16 weeks as defined by European League Against Rheumatism (EULAR) response criteria as assigned in GSE21537. Scores versus EULAR response are plotted for the synovial myeloid phenotype (A), lymphoid phenotype (B), fibroid phenotype (C), as well as classically activated M1 monocytes (D), B cells (E) and T cells (F). Statistical significance for good compared with poor EULAR response for the level of each gene-set module was calculated based upon the t-statistic (* = P ≤0.05, **P ≤0.01).
Figure 5
Figure 5
Assessment of serum biomarkers extrapolated from lymphoid and myeloid synovial phenotype gene expression in the synovial transcriptome training dataset. Intercellular adhesion molecule 1 (ICAM1) (A) and C-X-C motif chemokine 13 (CXCL13) (B) genes are expressed at highest levels in the myeloid (M) and lymphoid (L) phenotypes respectively. Array probes for each transcript were compared across all groups using the f-test, and in both cases Benjamini-Hochberg-corrected, *P < 0.001. X = low inflammatory phenotype and F = fibroid phenotype. Soluble (s)ICAM1 (C) and CXCL13 (D) are elevated in serum samples from rheumatoid arthritis (RA) patients (ADACTA trial) as compared with normal control (NC) serum. P-values derived from the Wilcoxon test are indicated. (E) Serum sICAM1 and CXCL13 levels were only weakly correlated in RA (ρ < 0.33, Spearman rank correlation coefficient).
Figure 6
Figure 6
Lymphoid (C-X-C motif chemokine 13 (CXCL13)) and myeloid (soluble intercellular adhesion molecule 1 (sICAM1)) serum biomarkers define rheumatoid arthritis patient subgroups with differential clinical response to anti-TNFα (adalimumab) compared with anti-IL-6R (tocilizumab) in the ADACTA trial. Relative treatment effectiveness (week-24 American College of Rheumatology (ACR)50 response) of adalimumab compared with tocilizumab was assessed by logistic regression for (A) each individual biomarker and (B) biomarker combination-defined subgroups using their respective medians as cutoffs (see Methods). Relative treatment effectiveness for adalimumab versus tocilizumab is represented by odds ratio and 95% CI for ACR50 response. Week-24 ACR20 (gray), ACR50 (green), and ACR70 (purple) response rates (%) per biomarker-defined subgroup are represented by radial plot for adalimumab (C) and tocilizumab (D) treatment arms. The direction of each radial line corresponds to a biomarker subgroup as follows: sICAM1 low (bottom) and high (top), CXCL13 low (left) and high (right). Low and high designations refer to biomarker values above and below their respective medians. Distance from radial plot center indicates response rate. Summary of week-24 ACR50 response rates for sICAM1-high/CXCL13-low, sICAM1-high/CXCL13-high, sICAM1-low/CXCL13-low and sICAM1-low/CXCL13-high ADACTA RA patients (E). The treatment-effect deltas between sICAM1-high/CXCL13-low and sICAM1-low/CXCL13-high patient groups are indicated for both adalimumab and tocilizumab.

References

    1. Goronzy JJ, Weyand CM. Rheumatoid arthritis. Immunol Rev. 2005;204:55–73. doi: 10.1111/j.0105-2896.2005.00245.x. - DOI - PubMed
    1. Lee DM, Weinblatt ME. Rheumatoid arthritis. Lancet. 2001;358:903–911. doi: 10.1016/S0140-6736(01)06075-5. - DOI - PubMed
    1. Tak PP, Bresnihan B. The pathogenesis and prevention of joint damage in rheumatoid arthritis: advances from synovial biopsy and tissue analysis. Arthritis Rheum. 2000;43:2619–2633. doi: 10.1002/1529-0131(200012)43:12<2619::AID-ANR1>3.0.CO;2-V. - DOI - PubMed
    1. Lindstrom TM, Robinson WH. Biomarkers for rheumatoid arthritis: making it personal. Scand J Clin Lab Invest Suppl. 2010;242:79–84. - PMC - PubMed
    1. Scott DL, Wolfe F, Huizinga TW. Rheumatoid arthritis. Lancet. 2010;376:1094–1108. doi: 10.1016/S0140-6736(10)60826-4. - DOI - PubMed

Publication types

Associated data