. 2014 Nov;17(11):1380-8.
doi: 10.1111/ele.12337. Epub 2014 Aug 28.

Higher resources decrease fluctuating selection during host-parasite coevolution

Affiliations
Free PMC article

Higher resources decrease fluctuating selection during host-parasite coevolution

Laura Lopez Pascua et al. Ecol Lett. 2014 Nov.
Free PMC article

Abstract

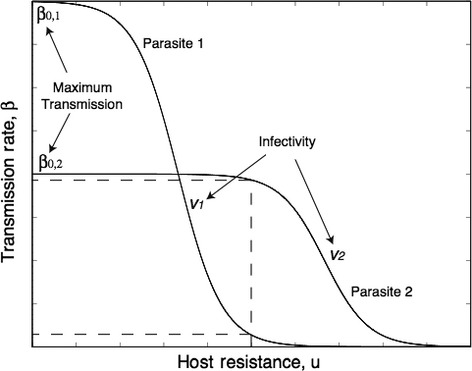
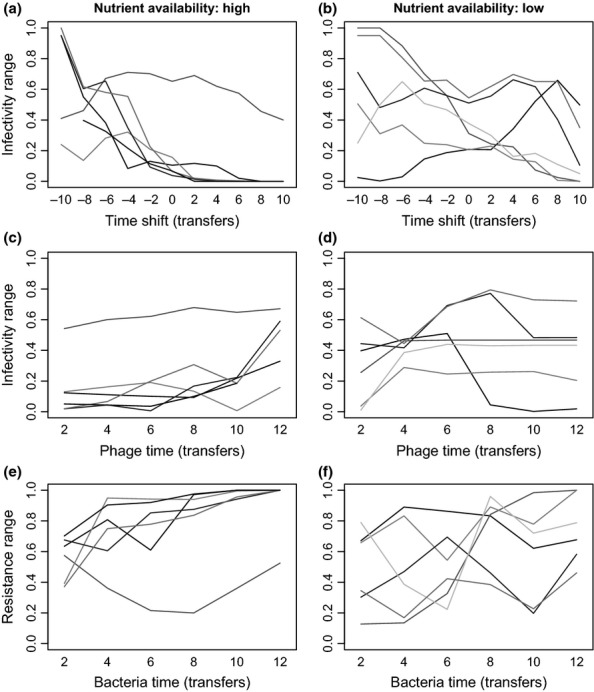
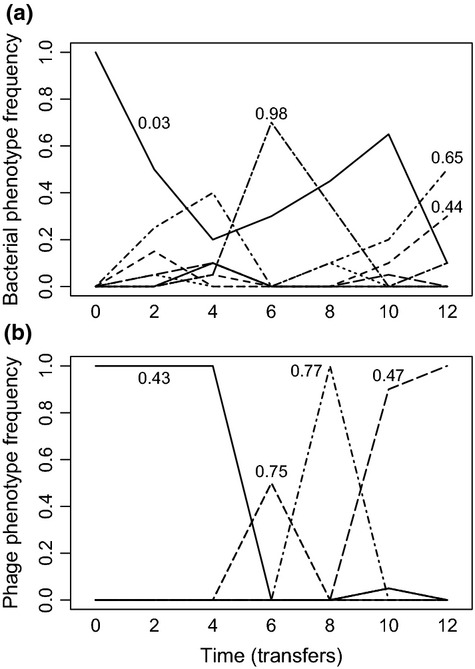
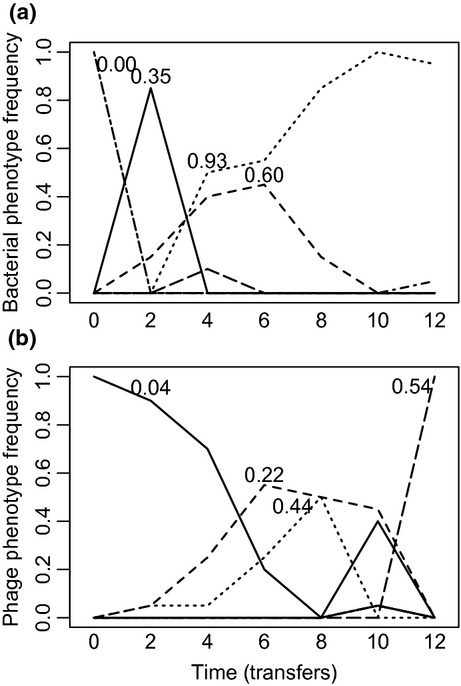
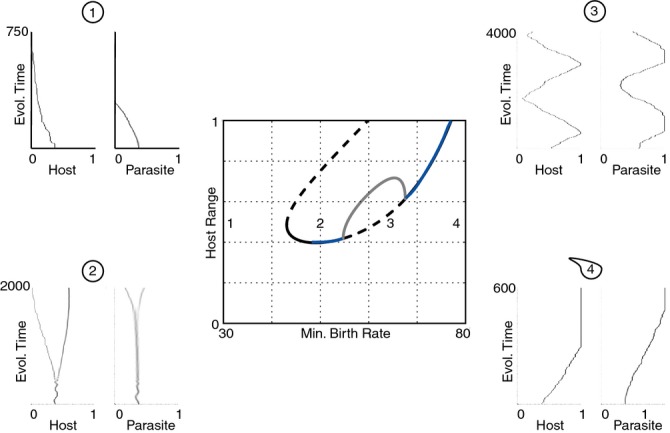
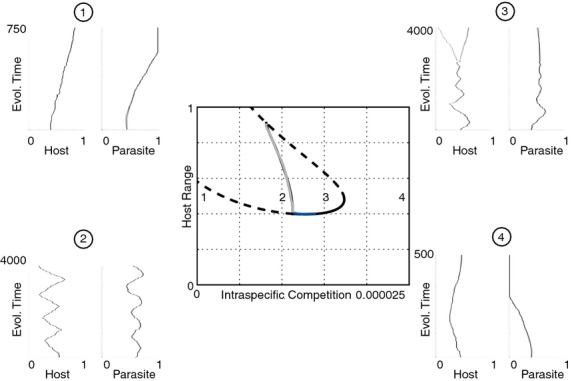
We still know very little about how the environment influences coevolutionary dynamics. Here, we investigated both theoretically and empirically how nutrient availability affects the relative extent of escalation of resistance and infectivity (arms race dynamic; ARD) and fluctuating selection (fluctuating selection dynamic; FSD) in experimentally coevolving populations of bacteria and viruses. By comparing interactions between clones of bacteria and viruses both within- and between-time points, we show that increasing nutrient availability resulted in coevolution shifting from FSD, with fluctuations in average infectivity and resistance ranges over time, to ARD. Our model shows that range fluctuations with lower nutrient availability can be explained both by elevated costs of resistance (a direct effect of nutrient availability), and reduced benefits of resistance when population sizes of hosts and parasites are lower (an indirect effect). Nutrient availability can therefore predictably and generally affect qualitative coevolutionary dynamics by both direct and indirect (mediated through ecological feedbacks) effects on costs of resistance.

Keywords: Adaptive dynamics; bacteria; experimental evolution; virus.


Figures

Figure 1
Figure 1
Illustration of the infection function used in the theoretical model in equation (2). Parasite 1 has a small infection range (v1) but achieves high transmission rates against those hosts it can infect. In contrast, parasite 2 has a large infection range (v2) but infects these hosts at a lower rate. Hosts with low resistance ranges (u) will be infected by more parasite types but are assumed to have higher birth rates.
Figure 2
Figure 2
Temporal changes in mean infectivity and resistance ranges through time under high (a, c, e) and low (b, d, f) nutrient availability. Individual lines show the six replicates per treatment. Data are plotted both as a function of time point from which bacteria or phages were isolated, and as a function of the difference in time point between phages and bacteria (time shift).
Figure 3
Figure 3
Temporal dynamics of different bacteria (a) and phage (b) phenotypes (based on cluster analyses with 80% similarity) of a single community evolved under low nutrient conditions. Numbers associated with the dominant phenotypes indicate their resistance/infectivity ranges (i.e. proportion of clonal isolates bacteria could resist/phage could infect).
Figure 4
Figure 4
Temporal dynamics of different bacteria (a) and phage (b) phenotypes (based on cluster analyses with 80% similarity) of a single community evolved under high nutrient conditions. Numbers associated with the dominant phenotypes indicate their resistance/infectivity ranges (i.e. proportion of clonal isolates bacteria could resist/phage could infect).
Figure 5
Figure 5
Bifurcation diagram showing the location and stability of host resistance range as the minimum birth rate is varied. Solid black lines denote convergence stable ‘ESS’ points, dashed lines unstable points, blue lines convergence stable but evolutionarily unstable ‘branching’ points and grey lines maximum limit of cycles. Example coevolutionary simulations are also shown for four scenarios (host range on the left, parasite range on the right). In region 1 there is no singular point and both host and parasite minimise their ranges. To the right, stable and unstable intermediate singular points emerge. The stable singular point is initially an ESS but then becomes a branching point in region 2, producing coexisting host (then parasite) strains. A Hopf bifurcation and cycles emerge in region 3. Cycles stop and ranges are maximised in region 4.
Figure 6
Figure 6
Bifurcation diagram showing the location and stability of host resistance range as competition is varied. Solid black lines denote convergence stable ‘ESS’ points, dashed lines unstable points, blue lines convergence stable but evolutionarily unstable ‘branching’ points and grey lines maximum limit of cycles. Examples of coevolutionary simulations are also shown for four scenarios (host range on the left, parasite range on the right). In region 1 there is no singular point and both host and parasite minimise their range. To the left stable and unstable intermediate singular points emerge. The stable singular point is initially an ESS but becomes a branching point in region 2, producing coexisting host (then parasite) strains. A Hopf bifurcation then occurs and cycles emerge in region 3. These cycles continue until a ‘homoclinic’ orbit where the cycles intersect the unstable singular point. There is no stable singular point in region 4 and ranges are maximised.

References

    1. Agrawal A. Lively CM. Infection genetics: gene-for-gene versus matching-alleles models and all points in between. Evol. Ecol. Res. 2002;4:79–90.
    1. Anderson RM. May RM. The population dynamics of microparasites and their invertebrate hosts. Philos. Trans. R. Soc. Lond. B Biol. Sci. 1981;291:451–524.
    1. Anderson RM. May RM. Coevolution of hosts and parasites. Parasitology. 1982;85:411–426. - PubMed
    1. Bell G. The ecology and genetics of fitness in chlamydomonas.1. Genotype-by-environment interaction among pure strains. Proc. R. Soc. Lond. B. 1990;240:295–321.
    1. Bell G. Fluctuating selection: the perpetual renewal of adaptation in variable environments. Philos. Trans. R. Soc. Lond. B Biol. Sci. 2010;365:87–97. - PMC - PubMed

Publication types

MeSH terms