Comparative Study
. 2014 Aug 29;15(1):737.
doi: 10.1186/1471-2164-15-737.

Characterization of the core and accessory genomes of Pseudomonas aeruginosa using bioinformatic tools Spine and AGEnt

Affiliations
Comparative Study

Characterization of the core and accessory genomes of Pseudomonas aeruginosa using bioinformatic tools Spine and AGEnt

Egon A Ozer et al. BMC Genomics. .

Abstract

Background: Pseudomonas aeruginosa is an important opportunistic pathogen responsible for many infections in hospitalized and immunocompromised patients. Previous reports estimated that approximately 10% of its 6.6 Mbp genome varies from strain to strain and is therefore referred to as "accessory genome". Elements within the accessory genome of P. aeruginosa have been associated with differences in virulence and antibiotic resistance. As whole genome sequencing of bacterial strains becomes more widespread and cost-effective, methods to quickly and reliably identify accessory genomic elements in newly sequenced P. aeruginosa genomes will be needed.

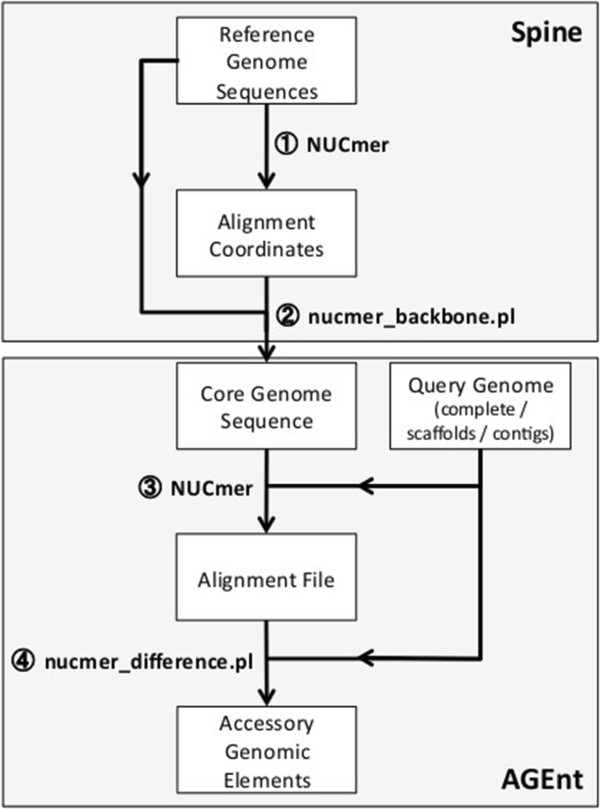
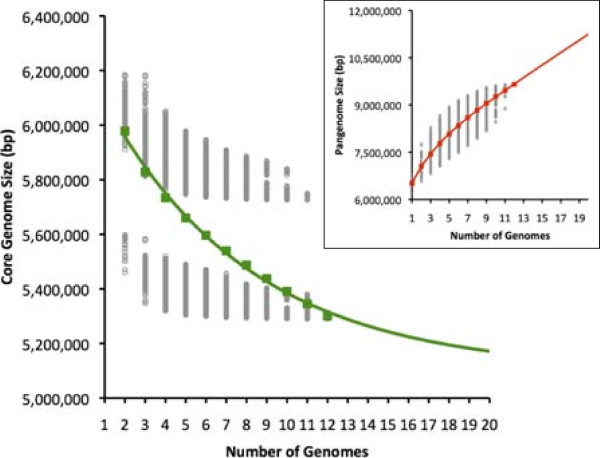
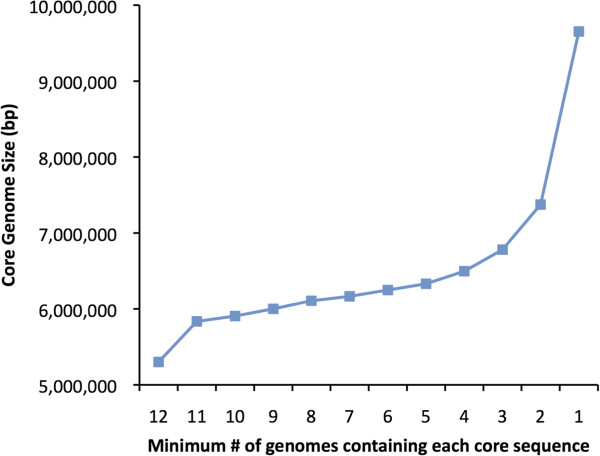
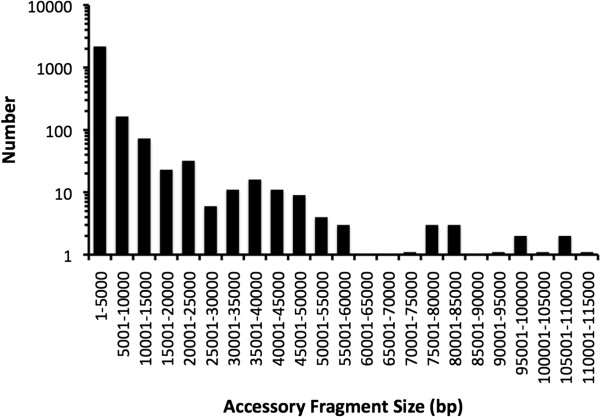
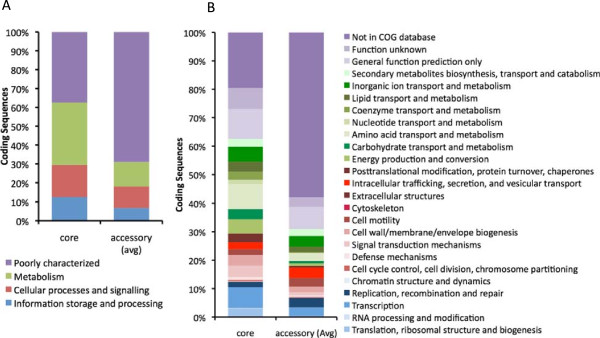
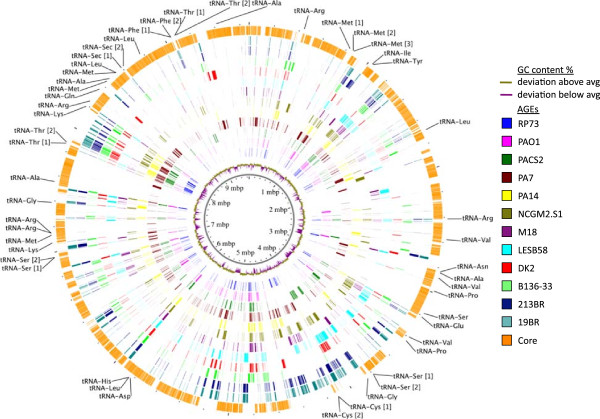
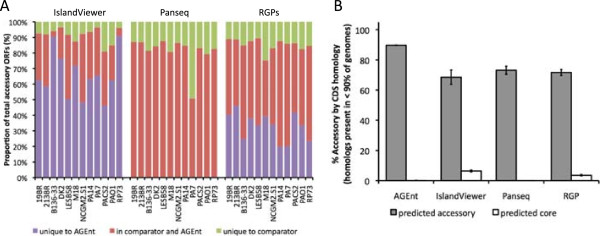
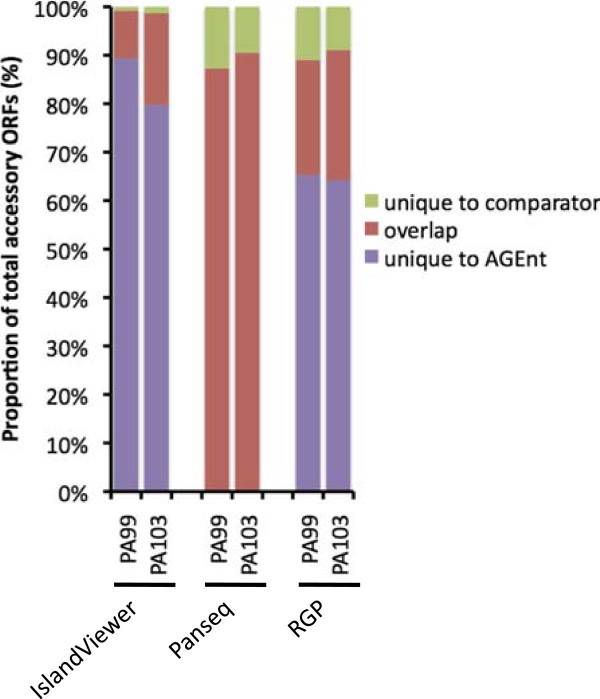
Results: We developed a bioinformatic method for identifying the accessory genome of P. aeruginosa. First, the core genome was determined based on sequence conserved among the completed genomes of twelve reference strains using Spine, a software program developed for this purpose. The core genome was 5.84 Mbp in size and contained 5,316 coding sequences. We then developed an in silico genome subtraction program named AGEnt to filter out core genomic sequences from P. aeruginosa whole genomes to identify accessory genomic sequences of these reference strains. This analysis determined that the accessory genome of P. aeruginosa ranged from 6.9-18.0% of the total genome, was enriched for genes associated with mobile elements, and was comprised of a majority of genes with unknown or unclear function. Using these genomes, we showed that AGEnt performed well compared to other publically available programs designed to detect accessory genomic elements. We then demonstrated the utility of the AGEnt program by applying it to the draft genomes of two previously unsequenced P. aeruginosa strains, PA99 and PA103.

Conclusions: The P. aeruginosa genome is rich in accessory genetic material. The AGEnt program accurately identified the accessory genomes of newly sequenced P. aeruginosa strains, even when draft genomes were used. As P. aeruginosa genomes become available at an increasingly rapid pace, this program will be useful in cataloging the expanding accessory genome of this bacterium and in discerning correlations between phenotype and accessory genome makeup. The combination of Spine and AGEnt should be useful in defining the accessory genomes of other bacterial species as well.


Figures

Figure 1
Figure 1
Approach to accessory genomic element identification. Programs used to accomplish the listed steps are indicated by circled numbers: 1, 3, NUCmer (whole-genome aligner); 2, nucmer_backbone.pl (converts coordinates of conserved regions to DNA sequence); 4, nucmer_difference.pl (subtracts regions not aligning to core). See Methods section for further details.
Figure 2
Figure 2
Core genome analysis of P. aeruginosa . The amount of common nucleotide sequence is plotted as a function of the number of strains sequentially added (n). Gray circles represent core genome size with each possible strain combination of n genomes. Colored squares represent the average core genome size at each n. The continuous curve shows the least-squares fit of an exponential decay function (R2 = 0.996). The inset shows the size of the nucleotide pangenome as a function of the number of strains sequentially added. The functions for both the core genome and pangenome continuous best-fit curves were derived as described in Tettelin et al. [32].
Figure 3
Figure 3
The P. aeruginosa core genome size based on variable definition of “core” sequences. The nucleotide core genome size is plotted as a function of the minimum number of the twelve reference genomes in which a particular genomic element must be present to be considered “core”. As flexibility is introduced into the definition of the core genome (i.e. an element is considered “core” if it is present in eleven of the twelve genomes, or ten of the twelve genomes, etc.), the “core” genome size increases. A “core” genome requirement of presence in only one of the twelve genomes therefore yields the pangenome of these twelve strains. Each symbol represents the average core genome size of all possible permutations of genome orders for twelve (12 permutations), eleven (132 permutations), and ten (1320 permutations) genome minimums, and the average core genome size for 10,000 randomly generated permutations at all other minimum genome numbers. Standard errors of the means at each value are too small to be visible at the scale of the figure.
Figure 4
Figure 4
Sizes of accessory genomic regions. The size distribution of all accessory genomic elements identified among the twelve reference genomes are plotted. For each of the ranges 7001-7500 bp, 9001-9500 bp, 100001-10500 bp, and 110001-11500 bp, only 1 element was found, as indicated in the figure by a bar of artificially non-zero height on the log scale.
Figure 5
Figure 5
Functional annotations of core and accessory genes. (A) COG categories and (B) COG subcategories of predicted genes within the core and accessory genomes of P. aeruginosa. Each category or subcategory is graphed as a percentage of the total number of genes in the core or accessory genomes. Accessory genome percentages are averages of the twelve reference strains.
Figure 6
Figure 6
Pangenome and core genome of twelve strains of P. aeruginosa . The inner plot shows the deviation of GC content of each region above or below the mean GC content of the pangenome. Colored rings show accessory genomic elements of each reference strain. The outer orange ring shows the distribution of core genomic elements along the pangenome. PA14 tRNA gene locations are indicated with tRNA gene names followed by numbers in square brackets in cases of gene interruption by accessory sequence. (Figure format was adapted from Mathee et al. [12]).
Figure 7
Figure 7
Performance of AGEnt compared to other predictors of P. aeruginosa accessory genome. AGEnt was compared to IslandViewer, Panseq, and RGPs for identification of accessory genome sequences. (A) Colored bars represent the proportion of accessory genome coding sequences (CDS) identified by both AGEnt and the comparator method (red), identified by AGEnt but not the comparator method (purple), or identified by the respective comparator method but not AGEnt (green). (B) Evaluation of the accuracy of accessory genome identification by AGEnt and the comparator methods using gene homology searches as a gold-standard. Genes were considered homologous if they shared at least 50% sequence identity across at least 50% of the gene length. CDSs in each of the genomes were classified as accessory if they were found to have homologs in <90% of the twelve reference genomes by sequential sequence alignments (see Methods for details). Bars represent average percentage of total CDS called by each method as accessory (grey bars) or core (white bars) subsequently identified as accessory by gene homology.
Figure 8
Figure 8
Performance of AGEnt in identifying accessory sequences in the draft genomes of P. aeruginosa strains PA99 and PA103. AGEnt was compared to IslandViewer, Panseq, and RGPs for identification of accessory genome sequences. Colored bar sections represent the proportion of accessory genome CDS identified by both AGEnt and the comparator method (red), identified by AGEnt but not the comparator method (purple), or identified by the respective comparator method but not AGEnt (green).

References

    1. Silby MW, Winstanley C, Godfrey SA, Levy SB, Jackson RW. Pseudomonas genomes: diverse and adaptable. FEMS Microbiol Rev. 2011;35(4):652–680. doi: 10.1111/j.1574-6976.2011.00269.x. - DOI - PubMed
    1. Jarvis WR. Epidemiology and Control of Pseudomonas aeruginosa Infections in the Intensive Care Unit. In: Hauser AR, Rello J, editors. Severe Infections Caused by Pseudomonas aeruginosa. Boston: Kluwer Academic Publishers; 2003. pp. 153–168.
    1. Obritsch MD, Fish DN, MacLaren R, Jung R. National surveillance of antimicrobial resistance in Pseudomonas aeruginosa isolates obtained from intensive care unit patients from 1993 to 2002. Antimicrob Agents Chemother. 2004;48(12):4606–4610. doi: 10.1128/AAC.48.12.4606-4610.2004. - DOI - PMC - PubMed
    1. Fagon JY, Chastre J, Domart Y, Trouillet JL, Pierre J, Carne C, Gibert C. Nosocomial pneumonia in patients receiving continuous mechanical ventilation. Am Rev Respir Dis. 1989;139:877–884. doi: 10.1164/ajrccm/139.4.877. - DOI - PubMed
    1. Rakhimova E, Wiehlmann L, Brauer AL, Sethi S, Murphy TF, Tummler B. Pseudomonas aeruginosa population biology in chronic obstructive pulmonary disease. J Infect Dis. 2009;200(12):1928–1935. doi: 10.1086/648404. - DOI - PubMed

Publication types

LinkOut - more resources