. 2014 Sep 1;28(5):1156-1169.
doi: 10.1016/j.csl.2013.11.006.

The glottaltopogram: a method of analyzing high-speed images of the vocal folds

Affiliations

The glottaltopogram: a method of analyzing high-speed images of the vocal folds

Gang Chen et al. Comput Speech Lang. .

Abstract

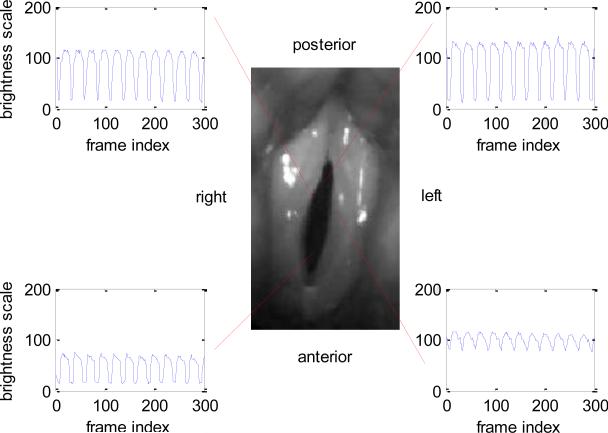
Laryngeal high-speed videoendoscopy is a state-of-the-art technique to examine physiological vibrational patterns of the vocal folds. With sampling rates of thousands of frames per second, high-speed videoendoscopy produces a large amount of data that is difficult to analyze subjectively. In order to visualize high-speed video in a straightforward and intuitive way, many methods have been proposed to condense the three-dimensional data into a few static images that preserve characteristics of the underlying vocal fold vibratory patterns. In this paper, we propose the "glottaltopogram," which is based on principal component analysis of changes over time in the brightness of each pixel in consecutive video images. This method reveals the overall synchronization of the vibrational patterns of the vocal folds over the entire laryngeal area. Experimental results showed that this method is effective in visualizing pathological and normal vocal fold vibratory patterns.

Keywords: high-speed videoendoscopy; principal component analysis; vocal fold vibration.


Figures

Figure 1
Figure 1
The 3 dimensions of variability in high speed video data: left-right (x), posterior-anterior (y), and time (t).
Figure 2
Figure 2
(a) The original image of the glottis. (b) The image after brightness adjustment. The posterior glottis is shown at the top of the images, and the anterior glottis is at the bottom.
Figure 3
Figure 3
(Color online) Center: image selected for analyses. Surrounding panels: Brightness scale time functions of pixels at different locations in and around the glottis.
Figure 4
Figure 4
(Color online) Glottaltopograms of modal voice produced by three males without voice disorders. (a) and (b): the first and second principal coefficients, displayed in terms of color saturation. (c): reconstruction error using the first two principal coefficients, displayed in terms of color saturation. The first row represents speaker M1; the second row represents speaker M2; and the third row represents speaker M3. The posterior glottis is shown at the top of each image, with the anterior glottis at the bottom.
Figure 5
Figure 5
(Color online) Multi-line kymogram of a modal voice from a normal subject (speaker M1). The x axis represents time, and the y axis represents the amplitude of vocal fold vibration. Each row of images corresponds to movement of the folds at one glottal location (indicated by the red lines through the frame at the left of the figure). Movements of the right vocal fold are shown at the top of the kymogram, and those of the left vocal fold are shown at the bottom.
Figure 6
Figure 6
(Color online) Glottaltopograms for modal, breathy, and pressed phonation produced by a normal subject (speaker F1). (a) and (b): the first and second principal coefficients, displayed in terms of color saturation. (c): reconstruction error using the first two principal coefficients, displayed in terms of color saturation. The first row represents modal phonation; the second row represents breathy phonation; and the third row represents pressed phonation. The posterior glottis is shown at the top of each image, with the anterior glottis at the bottom.
Figure 7
Figure 7
(Color online) Multi-line kymogram of a patient (speaker PM1) with creaky voice. The x axis represents time, and the y axis represents the amplitude of vocal fold vibration. Each row of images corresponds to movement of the folds at one glottal location (indicated by the red lines through the frame at the left of the figure). Movements of the right vocal fold are shown at the top of each frame, and those of the left vocal fold are shown at the bottom.
Figure 8
Figure 8
(Color online) The glottaltopogram of a patient (speaker PM1) with creaky voice. (a) and (b): the first and second principal coefficients, displayed in terms of color saturation. (c): reconstruction error using the first two principal coefficients, displayed in terms of color saturation. The posterior glottis is shown at the top of each image, with the anterior glottis at the bottom.
Figure 9
Figure 9
(Color online) The glottaltopogram of a patient (speaker PM2) with breathy voice. (a) and (b): the first and second principal coefficients, displayed in terms of color saturation. (c): reconstruction error using the first two principal coefficients, displayed in terms of color saturation. The posterior glottis is shown at the top of each image, with the anterior glottis at the bottom.
Figure 10
Figure 10
(Color online) Multi-line kymogram of a patient (speaker PM2) with breathy voice. The x axis represents time, and the y axis represents the amplitude of vocal fold vibration. Each row of images corresponds to movement of the folds at one glottal location (indicated by the red lines through the frame at the left of the figure). Movements of the right vocal fold are shown at the top of the kymogram, and those of the left vocal fold are shown at the bottom.
Figure 11
Figure 11
(Color online) The glottaltopogram of a patient (speaker PM3) with breathy voice. (a) and (b): the first and second principal coefficients, displayed in terms of color saturation. (c): reconstruction error using the first two principal coefficients, displayed in terms of color saturation. The posterior glottis is shown at the top of each image, with the anterior glottis at the bottom.
Figure 12
Figure 12
(Color online) Multi-line kymogram of a patient (speaker PM3) with breathy voice. The x axis represents time, and the y axis represents the amplitude of vocal fold vibration. Each row of images corresponds to movement of the folds at one glottal location (indicated by the red lines through the frame at the left of the figure). Movements of the right vocal fold are shown at the top of the kymogram, and those of the left vocal fold are shown at the bottom.
Figure 13
Figure 13
(Color online) The glottaltopogram of a patient (speaker PM4) with vocal hyperfunction. (a) and (b): the first and second principal coefficients, displayed in terms of color saturation. (c): reconstruction error using the first two principal coefficients, displayed in terms of color saturation. The posterior glottis is shown at the top of each image, with the anterior glottis at the bottom.
Figure 14
Figure 14
(Color online) Multi-line kymogram of a patient (speaker PM4) with vocal hyperfunction. The x axis represents time, and the y axis represents the amplitude of vocal fold vibration. Each row of images corresponds to movement of the folds at one glottal location (indicated by the red lines through the frame at the left of the figure). Movements of the right vocal fold are shown at the top of the kymogram, and those of the left vocal fold are shown at the bottom.

References

    1. Adams R, Bischof L. Seeded region growing. Pattern Analysis and Machine Intelligence. IEEE Transactions on. 1994;16(6):641–647.
    1. Baken RJ. Electroglottography. J. Voice. 1992;6:98–110.
    1. Chen G, Kreiman J, Gerratt BR, Neubauer J, Shue Y-L, Alwan A. Development of a glottal area index that integrates glottal gap size and open quotient. J. Acoust. Soc. Am. 2013;133:1656–1666. - PMC - PubMed
    1. Döllinger M, Braunschweig T, Lohscheller J, Eysholdt U, Hoppe U. Normal voice production: computation of driving parameters from endoscopic digital high speed images. Meth. Inf. Med. 2003;42(3):271–276. - PubMed
    1. Döllinger M, Lohscheller J, Svec J, McWhorter A, Kunduk M. Support vector machine classification of vocal fold vibrations based on phonovibrogram features. In: Ebrahim F, editor. Advances in Vibration Analysis Research. InTech; Croatia: 2011. pp. 435–456.