Review
. 2014 Aug 28;20(32):11262-72.
doi: 10.3748/wjg.v20.i32.11262.

Multimodality magnetic resonance imaging in hepatic encephalopathy: an update

Affiliations
Review

Multimodality magnetic resonance imaging in hepatic encephalopathy: an update

Xiao-Dong Zhang et al. World J Gastroenterol. .

Abstract

Hepatic encephalopathy (HE) is a neuropsychiatric complication of cirrhosis or acute liver failure. Currently, HE is regarded as a continuous cognitive impairment ranging from the mildest stage, minimal HE to overt HE. Hyperammonaemia and neuroinflammation are two main underlying factors which contribute to the neurological alterations in HE. Both structural and functional impairments are found in the white mater and grey mater involved in HE. Although the investigations into HE pathophysiological mechanism are enormous, the exact pathophysiological causes underlying HE remain controversial. Multimodality magnetic resonance imaging (MRI) plays an important role in helping to understand the pathological process of HE. This paper reviews the up-to-date multimodality MRI methods and predominant findings in HE patients with a highlight of the increasingly important role of blood oxygen level dependent functional MRI.

Keywords: Blood oxygenation level dependent functional magnetic resonance imaging; Default-mode network; Diffusion weighted imaging; Hepatic encephalopathy; Magnetic resonance imaging; Magnetic resonance spectroscopy.


Figures

Figure 1
Figure 1
Acute hepatic encephalopathy in a 44-year-old female with hepatitis B virus-related cirrhosis. A: T1 weighted image shows high signal intensity of bilateral globus pallidus; B: T2 Fluid Attenuated Inversion Recovery image shows diffused cortical edema; C: Axial diffusion weighted image shows diffuse cortical high signal intensity corresponding to diffuse cortical edema.
Figure 2
Figure 2
Voxel based morphometry analysis of patients with minimal hepatic encephalopathy and healthy controls. Minimal hepatic encephalopathy patients show grey matter volume losses in the frontal and temporal cortices, caudate, putamen, amygdale, paracentral lobule, anterior and middle cingulate cortices, supplementary motor area, and increased volume in the thalamus. From reference [6] (with permission). L: Left; R: Right.
Figure 3
Figure 3
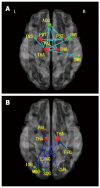
Axial magnetic resonance images show functional connectivities in patients with minimal hepatic encephalopathy between cortical and subcortical regions. A: Decreased positive functional connectivities between cortical and subcortical regions; B: Decreased negative functional connectivities between cortical and subcortical regions. Green nodes: Cortical ROIs; red nodes: Subcortical ROIs; light blue lines: Decreased positive connectivities in patients with minimal HE; dark blue lines: Decreased negative connectivities in patients with minimal HE. R: Right; L: Left; ACG: Anterior cingulum gyrus; SMG: Supramarginal gyrus; PUT: Putamen; PAL: Pallidum; THA: Thalamus; CUN: Cuneus; LING: Lingual gyrus; SOG: Superior occipital gyrus; MOG: Middle occipital gyrus; IOG: Inferior occipital gyrus; FFG: Fusiform gyrus; INS: Insula. From reference [54] (with permission).
Figure 4
Figure 4
Amplitude of low frequency fluctuation maps in groups of healthy control subjects, patients with minimal hepatic encephalopathy, and patients with overt hepatic encephalopathy. Group of MHE and group of OHE vs control subjects, P < 0.05. Within each group (A: Group of Ctrl; B: Group of MHE; C: Group of OHE), posterior cingulated cortex and precuneus, medial prefrontal cortex, inferior parietal lobe, and occipital areas show high amplitude of low frequency fluctuation values. Color scale indicates t values. From reference [60] (with permission). Ctrl: Control subjects; MHE: Minimal hepatic encephalopathy; OHE: Overt hepatic encephalopathy. L: Left; R: Right.

Similar articles

Cited by

References

    1. Atluri DK, Prakash R, Mullen KD. Pathogenesis, diagnosis, and treatment of hepatic encephalopathy. J Clin Exp Hepatol. 2011;1:77–86. - PMC - PubMed
    1. Zhang LJ, Zhong J, Lu GM. Multimodality MR imaging findings of low-grade brain edema in hepatic encephalopathy. AJNR Am J Neuroradiol. 2013;34:707–715. - PMC - PubMed
    1. Garcia-Martinez R, Rovira A, Alonso J, Jacas C, Simón-Talero M, Chavarria L, Vargas V, Córdoba J. Hepatic encephalopathy is associated with posttransplant cognitive function and brain volume. Liver Transpl. 2011;17:38–46. - PubMed
    1. Mattarozzi K, Cretella L, Guarino M, Stracciari A. Minimal hepatic encephalopathy: follow-up 10 years after successful liver transplantation. Transplantation. 2012;93:639–643. - PubMed
    1. Torlot FJ, McPhail MJ, Taylor-Robinson SD. Meta-analysis: The diagnostic accuracy of critical flicker frequency in minimal hepatic encephalopathy. Aliment Pharmacol Ther. 2013;37:527–536. - PMC - PubMed

Publication types