. 2015 Jan;36(1):155-63.
doi: 10.1097/AUD.0000000000000077.

Air-leak effects on ear-canal acoustic absorbance

Affiliations
Free PMC article

Air-leak effects on ear-canal acoustic absorbance

Katherine A Groon et al. Ear Hear. 2015 Jan.
Free PMC article

Abstract

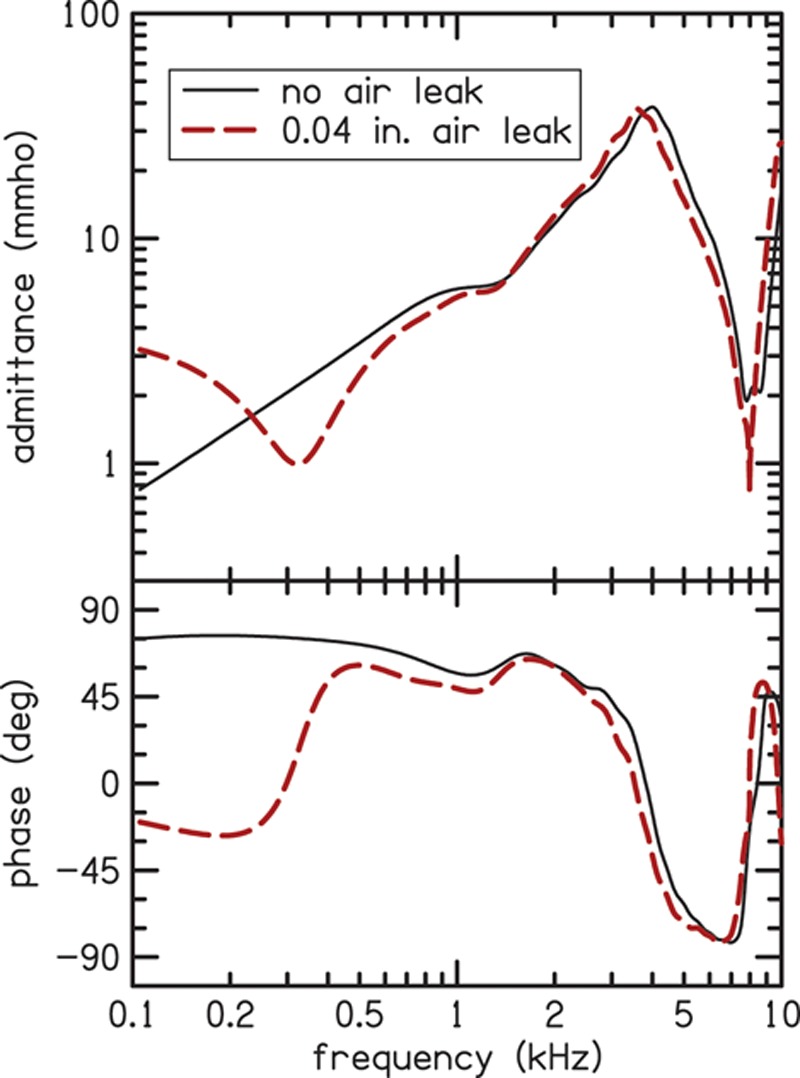
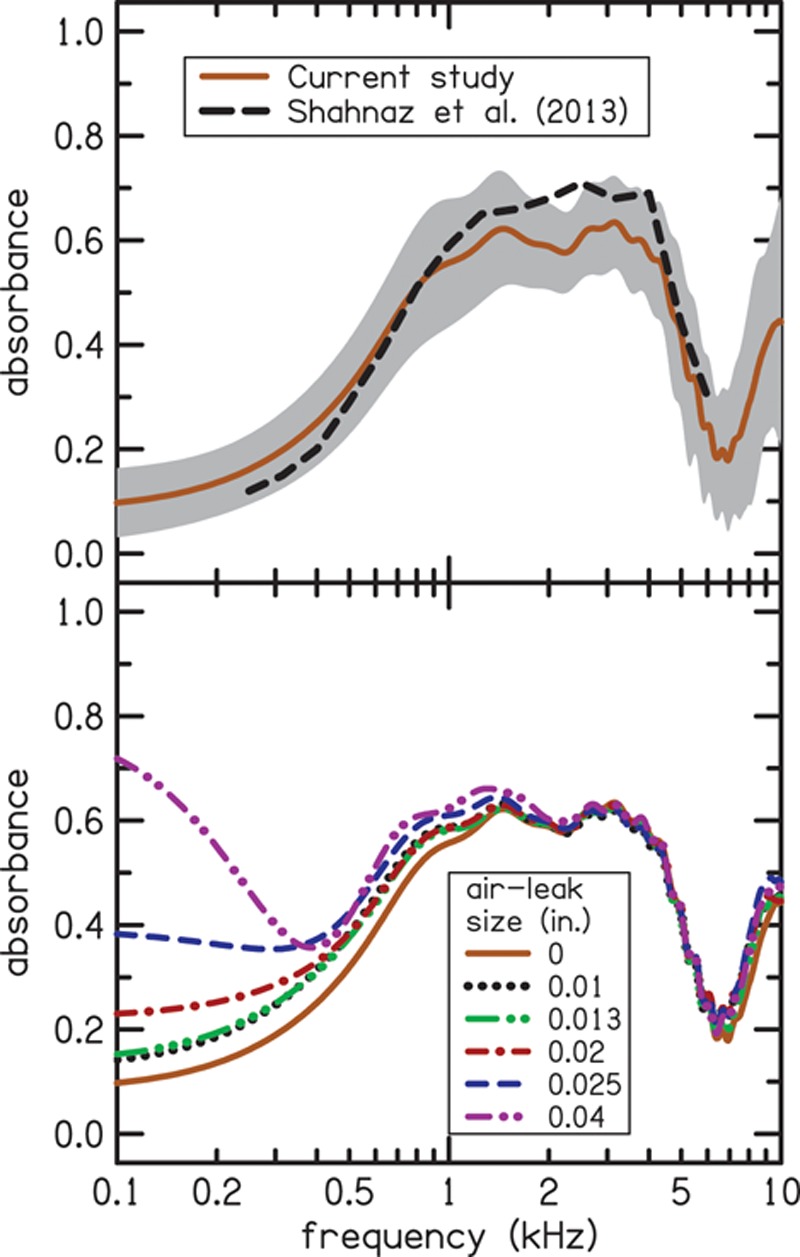
Objective: Accurate ear-canal acoustic measurements, such as wideband acoustic admittance, absorbance, and otoacoustic emissions, require that the measurement probe be tightly sealed in the ear canal. Air leaks can compromise the validity of the measurements, interfere with calibrations, and increase variability. There are no established procedures for determining the presence of air leaks or criteria for what size leak would affect the accuracy of ear-canal acoustic measurements. The purpose of this study was to determine ways to quantify the effects of air leaks and to develop objective criteria to detect their presence.

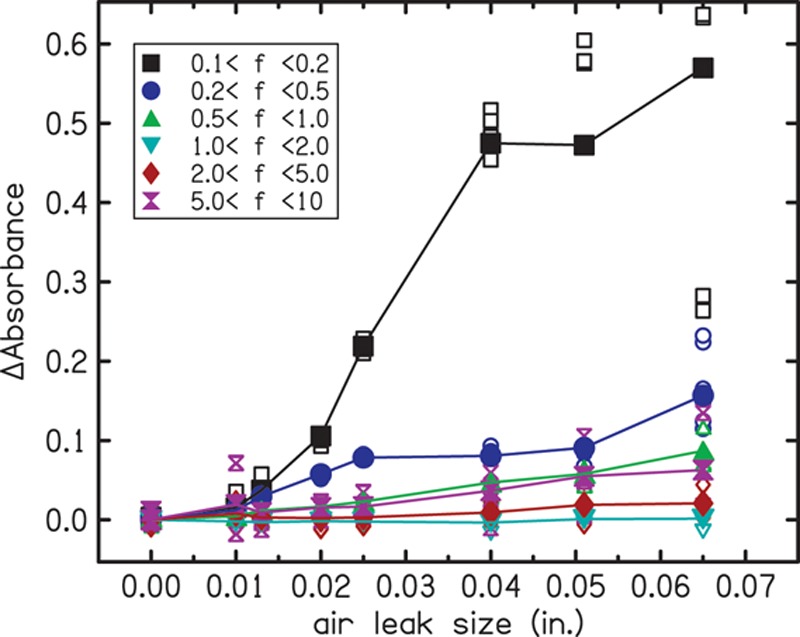
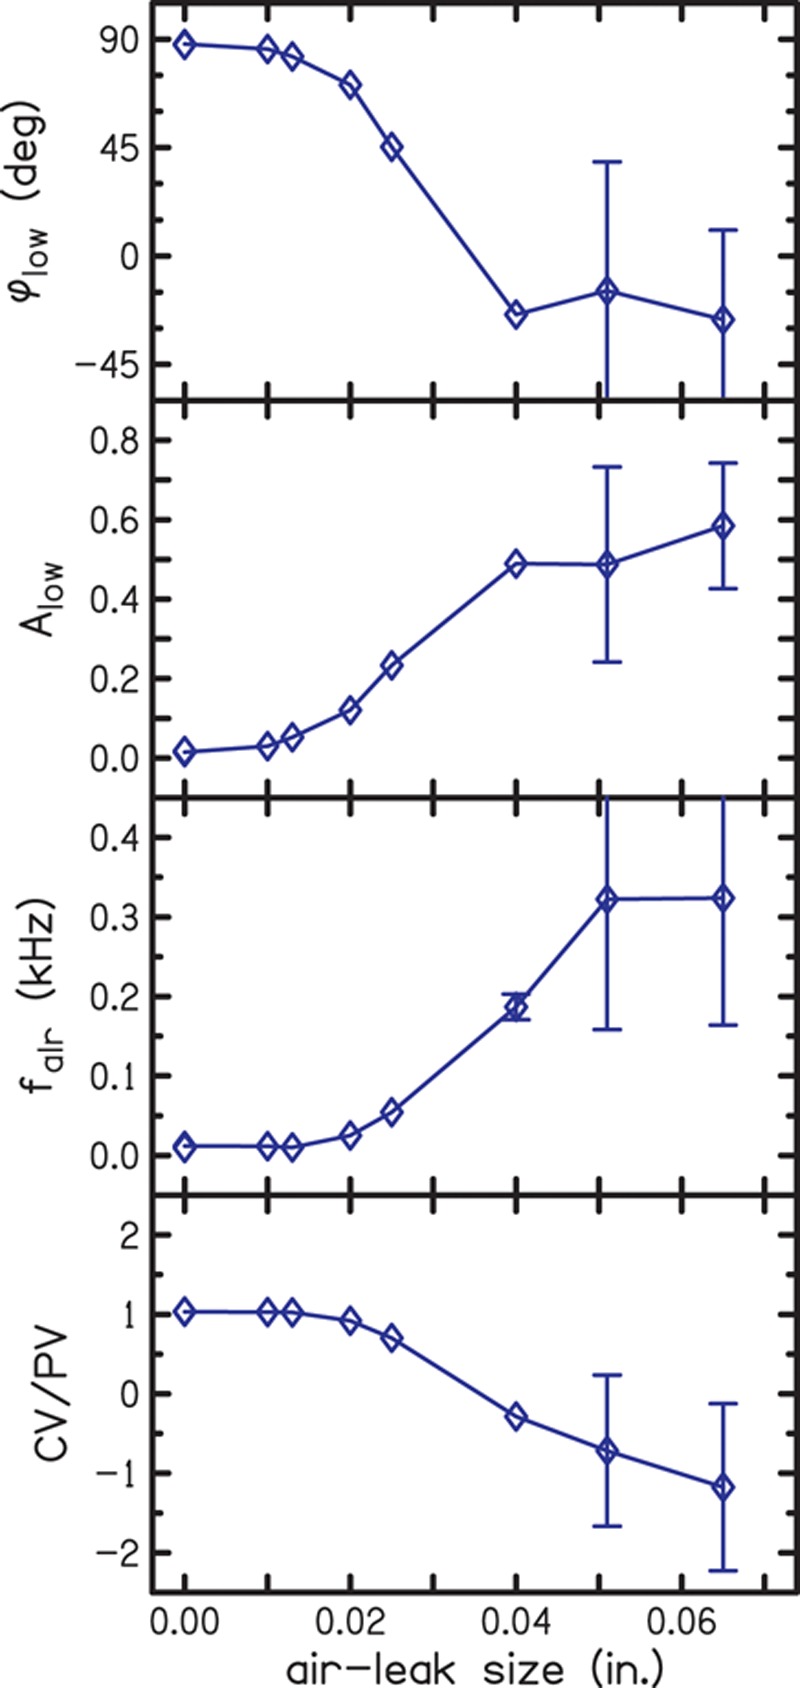
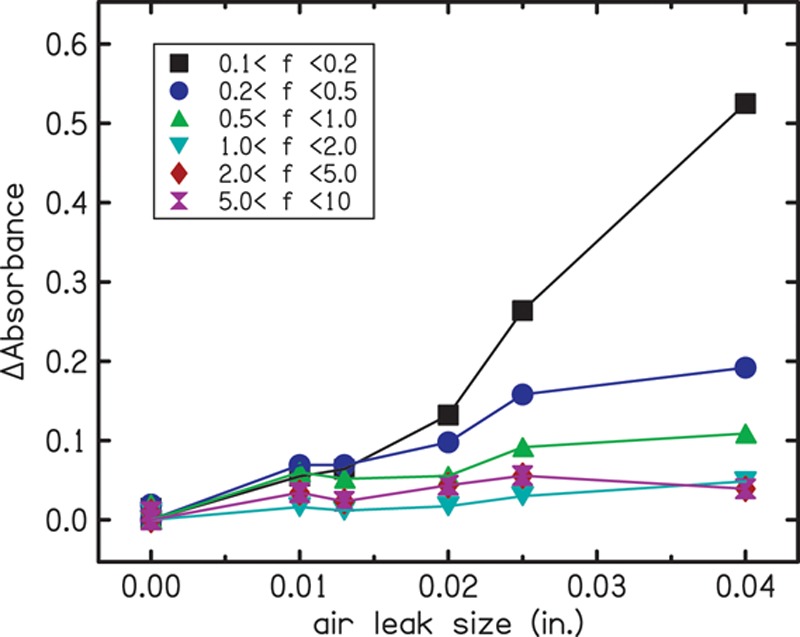
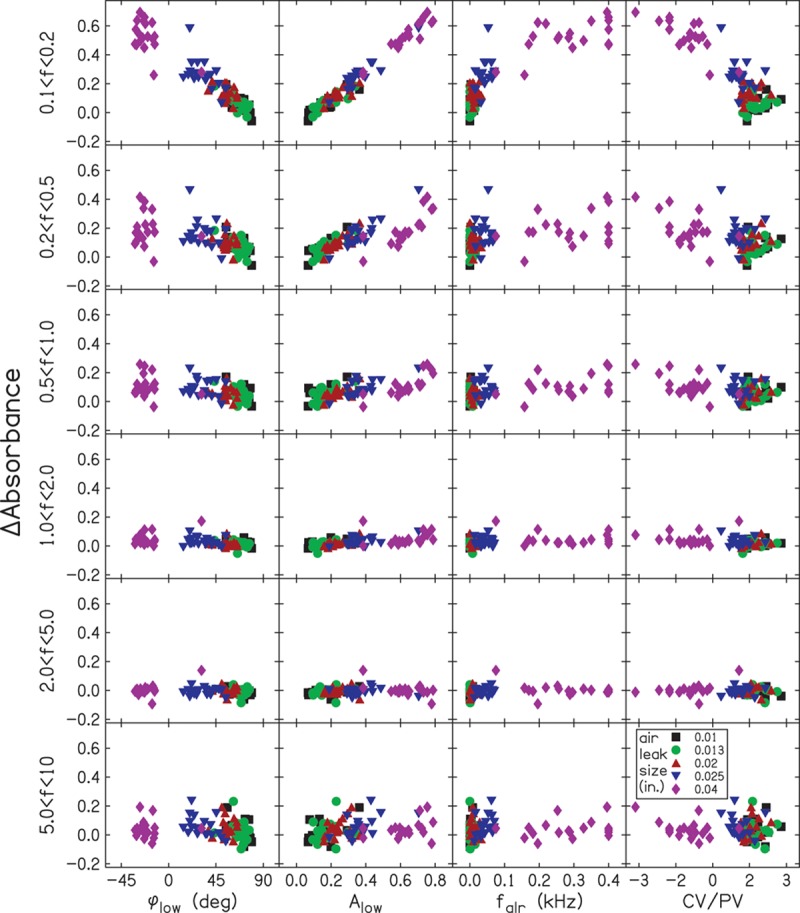
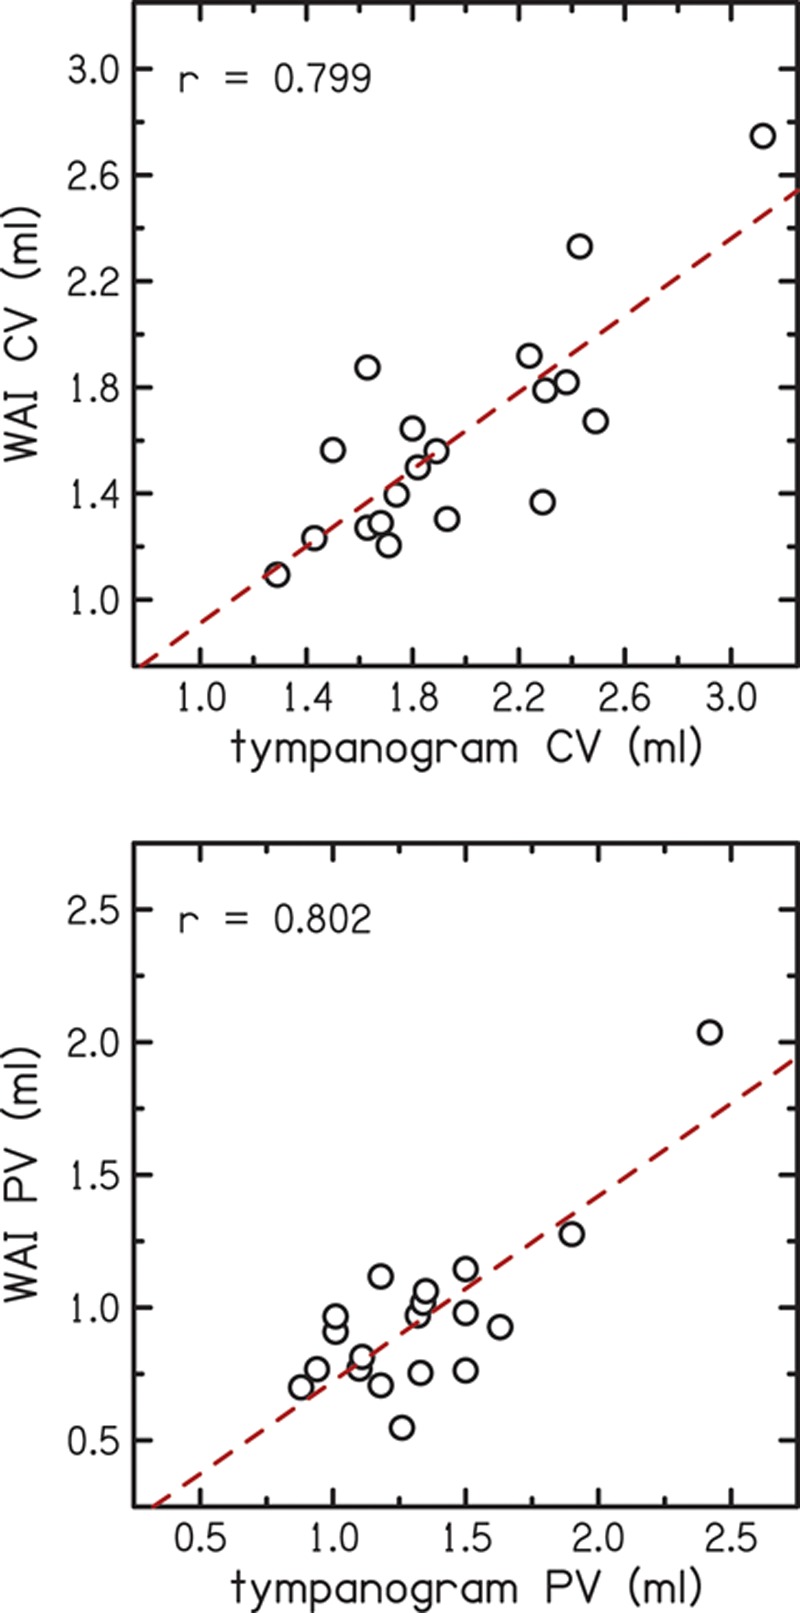
Design: Air leaks were simulated by modifying the foam tips that are used with the measurement probe through insertion of thin plastic tubing. To analyze the effect of air leaks, acoustic measurements were taken with both modified and unmodified foam tips in brass-tube cavities and human ear canals. Measurements were initially made in cavities to determine the range of critical leaks. Subsequently, data were collected in ears of 21 adults with normal hearing and normal middle-ear function. Four acoustic metrics were used for predicting the presence of air leaks and for quantifying these leaks: (1) low-frequency admittance phase (averaged over 0.1-0.2 kHz), (2) low-frequency absorbance, (3) the ratio of compliance volume to physical volume (CV/PV), and (4) the air-leak resonance frequency. The outcome variable in this analysis was the absorbance change (Δabsorbance), which was calculated in eight frequency bands.

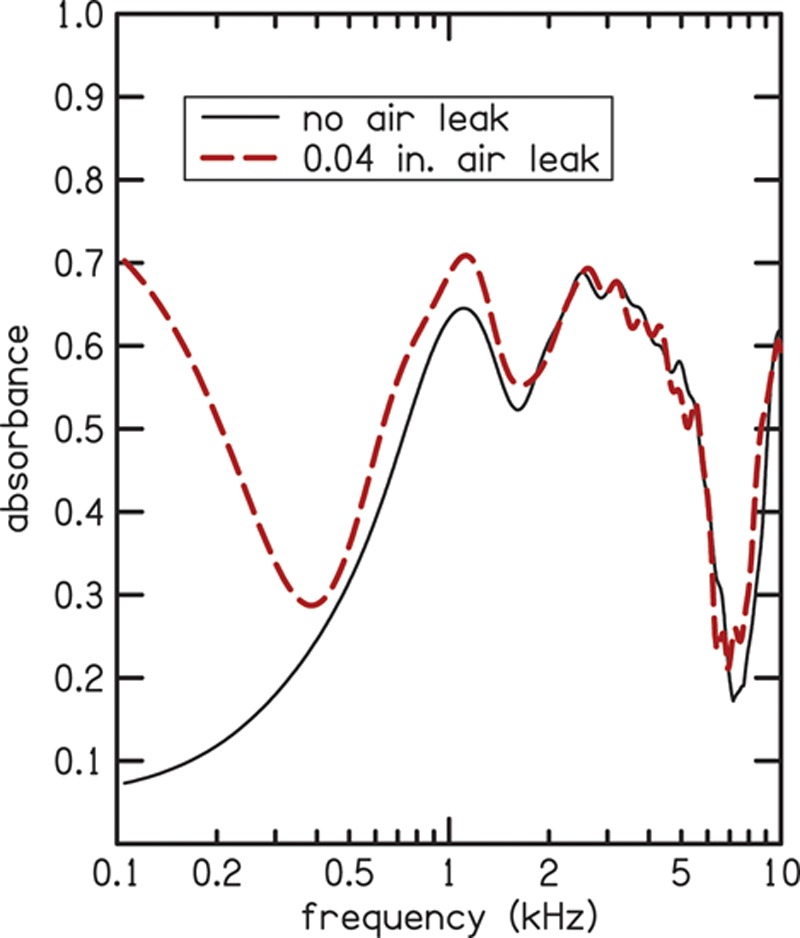
Results: The trends were similar for both the brass cavities and the ear canals. ΔAbsorbance generally increased with air-leak size and was largest for the lower frequency bands (0.1-0.2 and 0.2-0.5 kHz). Air-leak effects were observed in frequencies up to 10 kHz, but their effects above 1 kHz were unpredictable. These high-frequency air leaks were larger in brass cavities than in ear canals. Each of the four predictor variables exhibited consistent dependence on air-leak size. Low-frequency admittance phase and CV/PV decreased, while low-frequency absorbance and the air-leak resonance frequency increased.

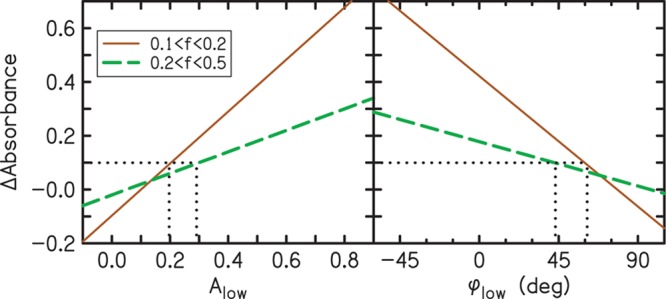
Conclusion: The effect of air leaks can be significant when their equivalent diameter exceeds 0.01 in. The observed effects were greatest at low frequencies where air leaks caused absorbance to increase. Recommended criteria for detecting air leaks include the following: when the frequency range of interest extends as low as 0.1 kHz, low-frequency absorbance should be ≤0.20 and low-frequency admittance phase ≥61 degrees. For frequency ranges as low as 0.2 kHz, low-frequency absorbance should be ≤0.29 and low-frequency admittance phase ≥44 degrees.


Conflict of interest statement

The authors declare no other conflict of interest.

Figures

Fig. 1.
Fig. 1.
Measured admittance magnitude (top panel) and phase (bottom panel) for the foam tip with no-leak (solid line) and for the modified foam tip with a 0.04-in. leak (dashed line) in the ear canal of one participant. The modified tip with the air leak has smaller admittance magnitude in the low frequencies where the leak susceptance cancels the ear-canal susceptance. The bottom panel shows how the phase goes to zero at the air-leak resonance frequency and is reduced at all frequencies below 1 kHz. A color version is available online.
Fig. 2.
Fig. 2.
Absorbance for the foam tip with no-leak (solid line) and for the modified foam tip with the 0.04-in. leak (dashed line) in the same ear canal for which admittance and phase data were shown in Fig. 1. Low-frequency absorbance increases in the leak condition compared to the no-leak condition. A color version is available online.
Fig. 3.
Fig. 3.
ΔAbsorbance as a function of the leak size in the brass cavity measurements. The parameter is the frequency band in which the estimates were made, represented by different symbols and colors as indicated in the inset. Open symbols indicate repeated measurements and filled symbols indicate the mean. ΔAbsorbance greater than zero can be observed in nearly all of the frequency bands but is largest in the lowest frequency band. A color version is available online.
Fig. 4.
Fig. 4.
Quantifying air leaks by diameter in a brass cavity using the four predictor variables: (1) the admittance phase at low frequency (φlow), (2) the absorbance at low frequencies (Alow), (3) the resonance frequency of the air leak (falr), and (4) the ratio of compliance volume to physical volume (CV/PV). Low-frequency admittance phase and absorbance were calculated as averages over the frequency range of 0.1–0.2 kHz. The brass tube had 38.7 mm length and 8 mm i.d. (volume of 1.95 cc). The diamonds represent the mean results for the air-leak diameters, which are connected by the lines to better illustrate the trend. Error bars indicate SDs and show the greatest variability in the measurements at the two largest diameters. A color version is available online.
Fig. 5.
Fig. 5.
The top panel shows mean absorbance for the condition without an air leak. The shaded region indicates the standard deviation. Our data is similar to the data of Shahnaz et al. (2013) (shown as dashed line), which included 186 participants and was collected using different measurement equipment. However, our data covers a wider frequency range, a consequence of the custom measurement equipment. The bottom panel shows the effect of the size of the air leak on mean absorbance. Leak sizes are indicated using different colors and line styles as shown in the inset. Absorbance increases in the low frequencies (below 0.4 kHz) as the size of the air leak increases. A color version is available online.
Fig. 6.
Fig. 6.
Mean effects of air-leak size on Δabsorbance in the ear canal in six frequency bands. The filled symbols represent the mean results for 19 subjects. Different colors and symbols indicate the frequency bands used in the analysis, as indicated in the inset. A color version is available online.
Fig. 7.
Fig. 7.
ΔAbsorbance as a function of the four predictor variables. Each panel has the mean results for each participant (19 subjects, five air-leak diameters). Different colors and symbols are used to indicate air-leak sizes. ΔAbsorbance is plotted on the y axis, and data for different frequency bands are shown in each row. The columns represent results for the four predictor variables: (1) the low-frequency phase (φlow), (2) the absorbance at low frequencies (Alow), (3) the air-leak-resonance frequency (falr), (4) the ratio of compliance volume to physical volume (CV/PV). A color version is available online.
Fig. 8.
Fig. 8.
Summary of the criteria that have the strongest correlations with air leaks. The solid and dashed lines are simple linear regression fits to the data of Fig. 7 for frequency bands of 0.1–0.2 and 0.2–0.5 kHz, respectively. The two dotted lines show the values of Alow and φlow that correspond to a significant change in Δabsorbance. No leak is indicated when the value of Alow is less than 0.20. In the 0.1–0.2 kHz band, a leak is indicated when Alow is in the range from 0.20 to 0.29 and in the 0.2–0.5 kHz band, a leak is indicated when Alow is greater than 0.29. Likewise, φlow indicates no leak when φlow is greater than 61 degrees. In the 0.1–0.2 kHz band, a leak is indicated when φlow is in the range from 44 to 61 degrees and in the 0.2–0.5 kHz band and a leak is indicated when φlow is less than 44 degrees. A color version is available online.
Fig. 9.
Fig. 9.
Comparison of compliance volume and physical volume determined using wideband acoustic immittance (WAI) to tympanometric values. In the top panel, the y-axis is the compliance volume derived from the WAI measurements and the x-axis shows compliance volume from the tympanogram. In the bottom panel, the y-axis is the physical volume derived from the WAI measurements and the x-axis shows physical volume from the tympanogram. The dashed lines indicate simple linear regression fits to the data. A color version is available online.

References

    1. Allen J. B. Measurement of eardrum acoustic impedance. In: J. B. Allen, J. L. Hall, A. Hubbard, S. T. Neely, A. Tubis., editors. Peripheral Auditory Mechanisms. New York, NY: Springer-Verlag; (1986). pp. 44–51).
    1. Burke S. R., Rogers A. R., Neely S. T., et al. Influence of calibration method on DPOAE measurements: I. Test performance. Ear Hear. (2010);31:533–545. - PMC - PubMed
    1. Feeney P. M., Hunter L. L., Kei J., et al. Consensus statement: Eriksholm workshop on wideband measures of the middle ear. Ear Hear. (2013);34:78S–79S. - PubMed
    1. Henriksen V. Using impedance measurements to detect and quantify the effect of air leaks on the attenuation of earplugs. J Acoust Soc Am. (2008);124:510–522. - PubMed
    1. Hunter L. L., Prieve B. A., Kei J., et al. Pediatric applications of wideband acoustic immittance measures. Ear Hear. (2013);34(Suppl 1):36S–42S. - PubMed

Publication types