. 2014 Aug 29;9(8):e106331.
doi: 10.1371/journal.pone.0106331. eCollection 2014.

Prolonged neuroinflammation after lipopolysaccharide exposure in aged rats

Affiliations

Prolonged neuroinflammation after lipopolysaccharide exposure in aged rats

Hui Qun Fu et al. PLoS One. .

Abstract

Inflammation is a hallmark of several disease states ranging from neurodegeneration to sepsis but is also implicated in physiological processes like ageing. Non-resolving inflammation and prolonged neuroinflammation are unclear processes implicated in several conditions, including ageing. In this study we studied the long-term effects of endotoxemia, as systemic lipopolysaccharide (LPS) injection, focusing on the role of astrocyte activation and cytokine release in the brain of aged rats. A single dose of LPS (2 mg/kg) or 0.9% saline was injected intraperitoneally in aged rats. Levels of pro-inflammatory cytokines (TNFα and IL-1β) and NF-κB p65 activation were measured systemically and in hippocampal tissue. Astrocytes and cytokines release in the CNS were detected via double immunofluorescence staining at different time-points up to day 30. Serum levels of TNFα and IL-1β were significantly increased acutely after 30 minutes (p<0.001) and up to 6 hours (p<0.001) following LPS-injection. Centrally, LPS-treated rats showed up-regulated mRNA expression and protein levels of pro-inflammatory cytokines in the hippocampus. These changes associated with astrogliosis in the hippocampus dentate gyrus (DG), IL-1β immunoreactivity and elevated NF-κB p65 expression up to day 30 post LPS exposure. Overall, these data demonstrate that LPS induces prolonged neuroinflammation and astrocyte activation in the hippocampus of aged rats. Hippocampal NF-κB p65 and excessive astrocytes-derived IL-1β release may play a pivotal role in regulating long-lasting neuroinflammation.


Conflict of interest statement

Competing Interests: The authors have declared that no competing interests exist.

Figures

Figure 1
Figure 1. LPS increase systemic levels of TNF-α and IL-1β in aged rats.
Animals were adminstrated either LPS (2 mg/kg) or equal volume of saline (i.p.). No significant changes were measured in saline injected animals at all time points. (A) TNF-α in serum significantly increased at 0.5 h and 2 h after LPS administration, and returned to control level at day 1. (B) There was also a siginificant increase in circulating IL-1β level following LPS injection but this was delayed from TNF-α release and started at 2 h. Data are expressed as mean ± standard error of the mean (n = 8) and compared by 1-way analysis of variance followed with Boferroni post hoc analysis, ***p<0.001 vs Control.
Figure 2
Figure 2. Gene expression and protein level of TNF-α, IL-1β and NF-κB in the hippocampus.
After LPS injection the expression of pro-inflammatory cytokines including TNF-α (A), IL-1β (B) and NF-κB p65 (C) mRNA activity were measured at different time points up to day 30. (A) Levels of TNF-α peaked at day 7 (18.4±5.4) and remained mildly, but significnalty, increased at day 30 (8.5±1.6). (B) IL-1β started to be up-regualted at day 3 (7.8±0.5), peaked at day 7 (14.7±3.1) and remained increased at mRNA level up to day 30 (12.4±0.8). (C) NF-κB p65 expression was found increased at day 3 (1.8±0.3) and day 7 (4.3±0.1) post LPS exposure. Protein levels were also measure using ELISA (D–E–F). (D) TNF-α levels in hippocampal homogenate were stably increased from day 1 to day 7. (E) IL-1β was detected only at day 7 with other values comparable to saline injected rats. (F) NF-κB p65 was up-regulated at all time-points, from day 1 to day 30. Data are expressed as mean ± standard error of the mean (n = 4) and compared by 1-way analysis of variance followed with Boferroni post hoc analysis, *p<0.05, **p<0.01, ***p<0.001 vs Control respectively.
Figure 3
Figure 3. Astrocytes activity and GFAP/TNF-α double staining in the DG area.
Astrocyte activity was measure with GFAP immunofluorescence. Representative photomicrographs show control and LPS-injected rats at different time points up to day 30. (A) Densitometry of GFAP fluorescence intensity was up-regulated from day 1 to day 7. Following LPS injection, astrocytes showed changes in morphology, which was recognized by decreased ramification and hypertrophy of the soma. (B) Double fluorescence staining of GFAP and TNF-α in hippocampal astrocytes. The ratio of TNF-α positive astrocytes in total astrocytes (GFAP-positive cells) was significantly increased from day 1 and peaking on day 7. Pictures show DG area, data are expressed as mean ± standard error of the mean (n = 4) and compared by 1-way analysis of variance followed with Boferroni post hoc analysis, **p<0.01, ***p<0.001 vs Control.
Figure 4
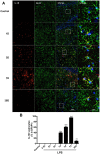
Figure 4. Sustained IL-1β up-regulation in hippocampal astrocytes.
IL-1β immunoreactivity was measured in GFAP-positive cells after LPS exposure or saline. Levels of IL-1β were found up-regulated from day 1 up to day 30. Higher magnification insets highlight the co-localization of IL-1β with GFAP (A). The ratio of IL-1β positive astrocytes in total astrocytes (GFAP positive cells) was quantified (B). Pictures show DG area, data are expressed as mean ± standard error of the mean (n = 4) and compared by 1-way analysis of variance followed with Boferroni post hoc analysis, **p<0.01, ***p<0.001 vs Control.
Figure 5
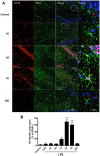
Figure 5. NF-κB p65 DNA biding activity in astrocytes after LPS.
NF-κB activation in astrocytes was measured by NF-κB p65/GFAP double staining. Confocal images and quantification show a gradual increase in NF-κB p65 activity and nuclear translocation from day 1 to day 7, with a peak on day 3. Representative high magnification pictures are shown in the insets. Pictures are representative from DG area, data are expressed as mean ± standard error of the mean (n = 4) and compared by 1-way analysis of variance followed with Boferroni post hoc analysis, ***p<0.001 vs Control.

References

    1. Nathan C, Ding A (2010) Nonresolving inflammation. Cell 140: 871–882. - PubMed
    1. Barrientos RM, Higgins EA, Biedenkapp JC, Sprunger DB, Wright-Hardesty KJ, et al. (2006) Peripheral infection and aging interact to impair hippocampal memory consolidation. Neurobiology of aging 27: 723–732. - PubMed
    1. Terrando N, Monaco C, Ma D, Foxwell BM, Feldmann M, et al. (2010) Tumor necrosis factor-alpha triggers a cytokine cascade yielding postoperative cognitive decline. Proceedings of the National Academy of Sciences of the United States of America 107: 20518–20522. - PMC - PubMed
    1. Dantzer R, Kelley KW (2007) Twenty years of research on cytokine-induced sickness behavior. Brain, behavior, and immunity 21: 153–160. - PMC - PubMed
    1. Simone MJ, Tan ZS (2011) The role of inflammation in the pathogenesis of delirium and dementia in older adults: a review. CNS neuroscience & therapeutics 17: 506–513. - PMC - PubMed

Publication types

MeSH terms