High efficiency light harvesting by carotenoids in the LH2 complex from photosynthetic bacteria: unique adaptation to growth under low-light conditions
- PMID: 25171303
- PMCID: PMC4174993
- DOI: 10.1021/jp5070984
High efficiency light harvesting by carotenoids in the LH2 complex from photosynthetic bacteria: unique adaptation to growth under low-light conditions
Abstract
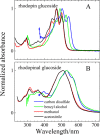
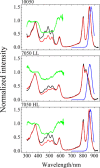
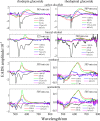
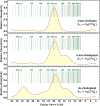
Rhodopin, rhodopinal, and their glucoside derivatives are carotenoids that accumulate in different amounts in the photosynthetic bacterium, Rhodoblastus (Rbl.) acidophilus strain 7050, depending on the intensity of the light under which the organism is grown. The different growth conditions also have a profound effect on the spectra of the bacteriochlorophyll (BChl) pigments that assemble in the major LH2 light-harvesting pigment-protein complex. Under high-light conditions the well-characterized B800-850 LH2 complex is formed and accumulates rhodopin and rhodopin glucoside as the primary carotenoids. Under low-light conditions, a variant LH2, denoted B800-820, is formed, and rhodopinal and rhodopinal glucoside are the most abundant carotenoids. The present investigation compares and contrasts the spectral properties and dynamics of the excited states of rhodopin and rhodopinal in solution. In addition, the systematic differences in pigment composition and structure of the chromophores in the LH2 complexes provide an opportunity to explore the effect of these factors on the rate and efficiency of carotenoid-to-BChl energy transfer. It is found that the enzymatic conversion of rhodopin to rhodopinal by Rbl. acidophilus 7050 grown under low-light conditions results in nearly 100% carotenoid-to-BChl energy transfer efficiency in the LH2 complex. This comparative analysis provides insight into how photosynthetic systems are able to adapt and survive under challenging environmental conditions.
Figures


Similar articles
-
Spectral heterogeneity and carotenoid-to-bacteriochlorophyll energy transfer in LH2 light-harvesting complexes from Allochromatium vinosum.Photosynth Res. 2016 Feb;127(2):171-87. doi: 10.1007/s11120-015-0165-2. Epub 2015 Jun 6. Photosynth Res. 2016. PMID: 26048106
-
Carotenoid responds to excess energy dissipation in the LH2 complex from Rhodoblastus acidophilus.Photosynth Res. 2022 Oct;154(1):75-87. doi: 10.1007/s11120-022-00952-5. Epub 2022 Sep 6. Photosynth Res. 2022. PMID: 36066816
-
Carotenoids Do Not Protect Bacteriochlorophylls in Isolated Light-Harvesting LH2 Complexes of Photosynthetic Bacteria from Destructive Interactions with Singlet Oxygen.Molecules. 2021 Aug 24;26(17):5120. doi: 10.3390/molecules26175120. Molecules. 2021. PMID: 34500552 Free PMC article.
-
Ultrafast time-resolved carotenoid to-bacteriochlorophyll energy transfer in LH2 complexes from photosynthetic bacteria.J Phys Chem B. 2008 Aug 28;112(34):10689-703. doi: 10.1021/jp711946w. Epub 2008 Jul 31. J Phys Chem B. 2008. PMID: 18671366 Free PMC article.
-
Quantum chemical insights in energy dissipation and carotenoid radical cation formation in light harvesting complexes.Phys Chem Chem Phys. 2007 Jun 21;9(23):2917-31. doi: 10.1039/b703028b. Epub 2007 Apr 25. Phys Chem Chem Phys. 2007. PMID: 17551615 Review.
Cited by
-
Spectral heterogeneity and carotenoid-to-bacteriochlorophyll energy transfer in LH2 light-harvesting complexes from Allochromatium vinosum.Photosynth Res. 2016 Feb;127(2):171-87. doi: 10.1007/s11120-015-0165-2. Epub 2015 Jun 6. Photosynth Res. 2016. PMID: 26048106
-
Changing Form and Function through Carotenoids and Synthetic Biology.Plant Physiol. 2019 Mar;179(3):830-843. doi: 10.1104/pp.18.01122. Epub 2018 Oct 25. Plant Physiol. 2019. PMID: 30361256 Free PMC article.
-
The role of charge-transfer states in the spectral tuning of antenna complexes of purple bacteria.Photosynth Res. 2018 Aug;137(2):215-226. doi: 10.1007/s11120-018-0492-1. Epub 2018 Mar 3. Photosynth Res. 2018. PMID: 29502240
-
Excitation energy transfer from the bacteriochlorophyll Soret band to carotenoids in the LH2 light-harvesting complex from Ectothiorhodospira haloalkaliphila is negligible.Photosynth Res. 2017 Sep;133(1-3):289-295. doi: 10.1007/s11120-017-0341-7. Epub 2017 Feb 16. Photosynth Res. 2017. PMID: 28205063
-
Carotenoid responds to excess energy dissipation in the LH2 complex from Rhodoblastus acidophilus.Photosynth Res. 2022 Oct;154(1):75-87. doi: 10.1007/s11120-022-00952-5. Epub 2022 Sep 6. Photosynth Res. 2022. PMID: 36066816
References
-
- Cogdell R. J.; Durant I.; Valentine J.; Lindsay J. G.; Schmidt K. The Isolation and Partial Characterization of the Light-Harvesting Pigment-Protein Complement of Rhodopseudomonas acidophila. Biochim. Biophys. Acta 1983, 722, 427–435.
-
- Angerhofer A.; Cogdell R. J.; Hipkins M. F. A Spectral Characterization of the Light-Harvesting Pigment-Protein Complexes from Rhodopseudomonas acidophila. Biochim. Biophys. Acta 1986, 848, 333–341.
-
- Gardiner A. T.; Cogdell R. J.; Takaichi S. The Effect of Growth Conditions on the Light-Harvesting Apparatus in Rhodopseudomonas acidophila. Photosynth. Res. 1993, 38, 159–167. - PubMed
-
- Deinum G.; Otte S. C. M.; Gardiner A. T.; Aartsma T. J.; Cogdell R. J.; Amesz J. Antenna Organization of Rhodopseudomonas acidophila: A Study of the Excitation Migration. Biochim. Biophys. Acta 1991, 1060, 125–131.
-
- Cogdell R. J.; Howard T. D.; Isaacs N. W.; McLuskey K.; Gardiner A. T. Structural Factors Which Control the Position of the Qy Absorption Band of Bacteriochlorophyll a in Purple Bacterial Antenna Complexes. Photosynth. Res. 2002, 74, 135–141. - PubMed
Publication types
MeSH terms
Substances
Grants and funding
LinkOut - more resources
Full Text Sources
Other Literature Sources

