. 2014 Aug 28;158(5):1060-1071.
doi: 10.1016/j.cell.2014.06.046.

Evolution of resistance to a last-resort antibiotic in Staphylococcus aureus via bacterial competition

Affiliations

Evolution of resistance to a last-resort antibiotic in Staphylococcus aureus via bacterial competition

Gudrun Koch et al. Cell. .

Abstract

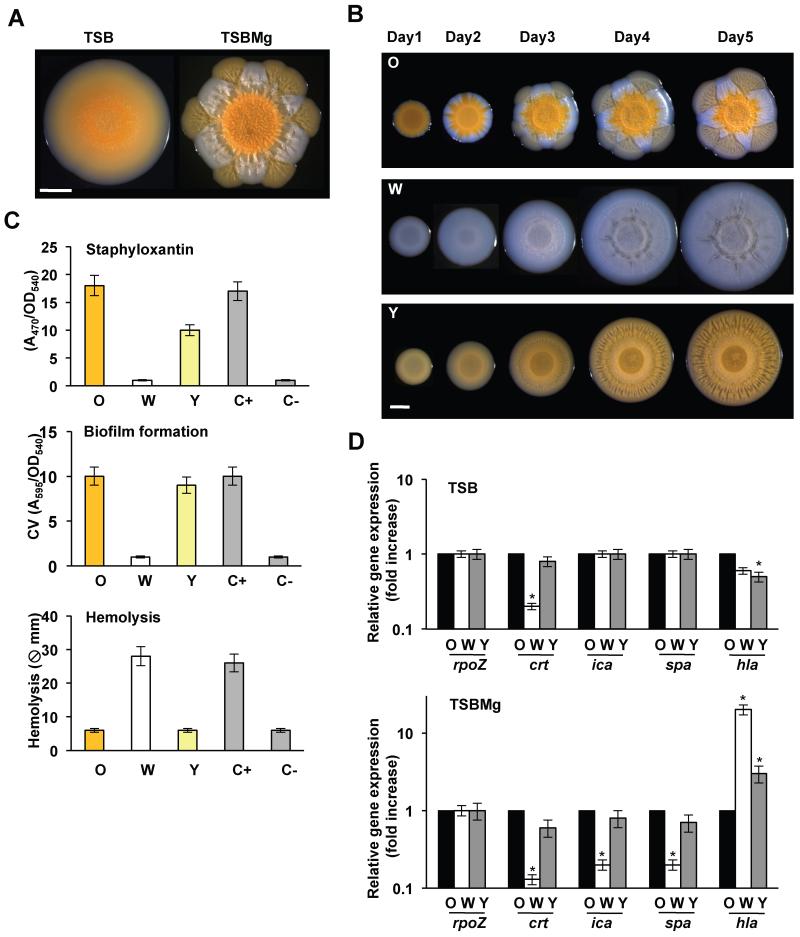
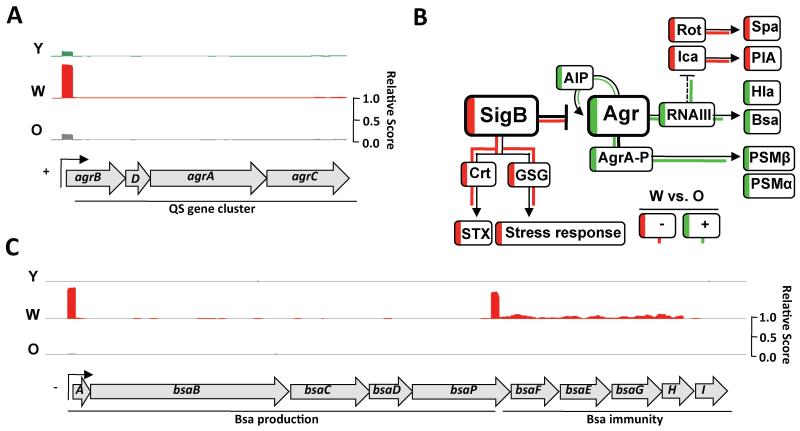
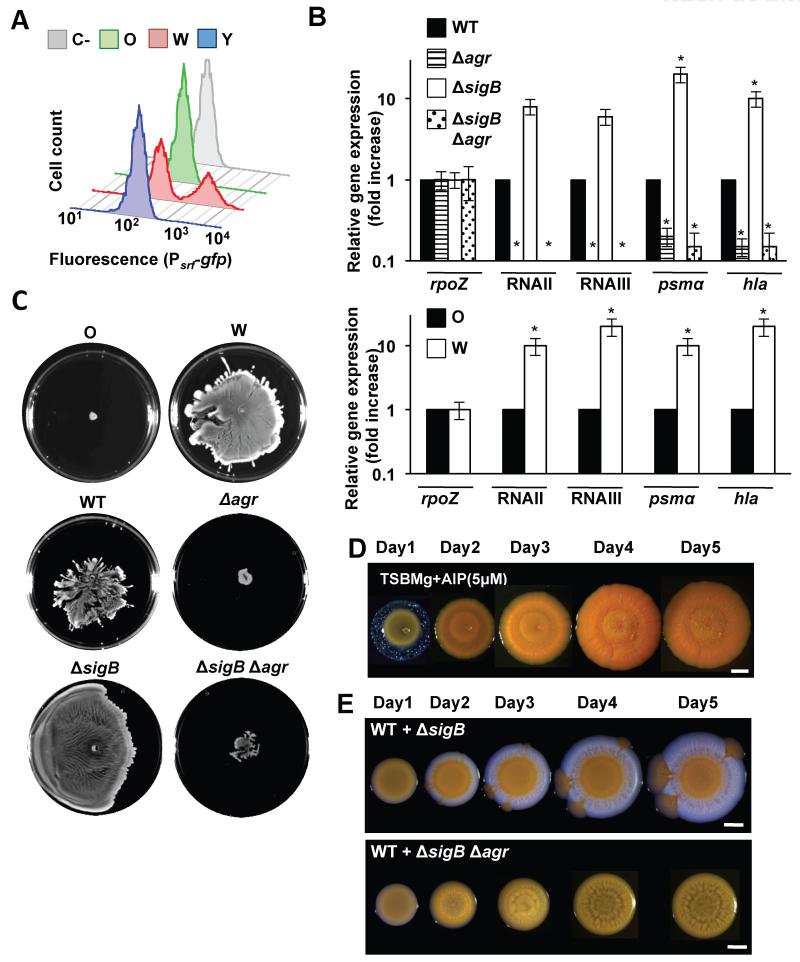
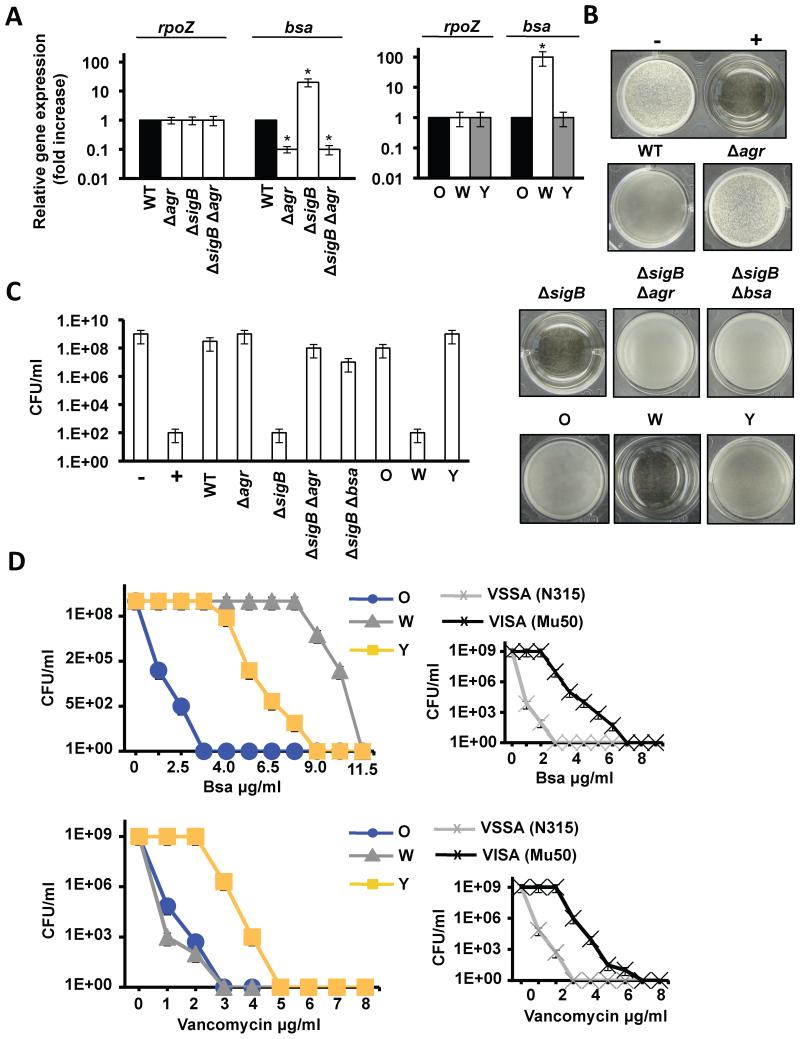
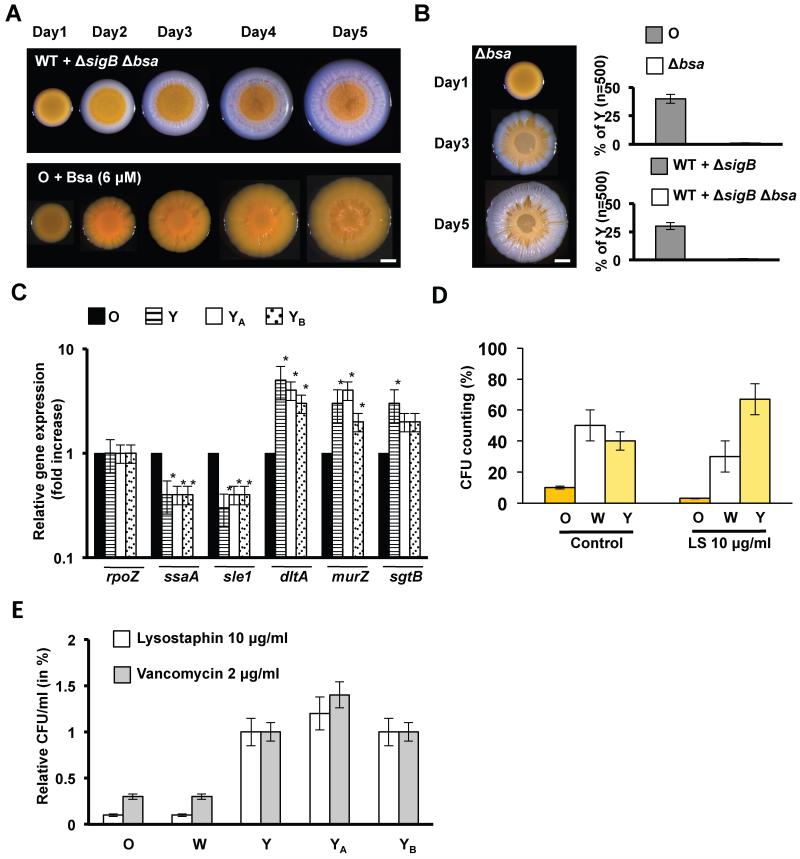
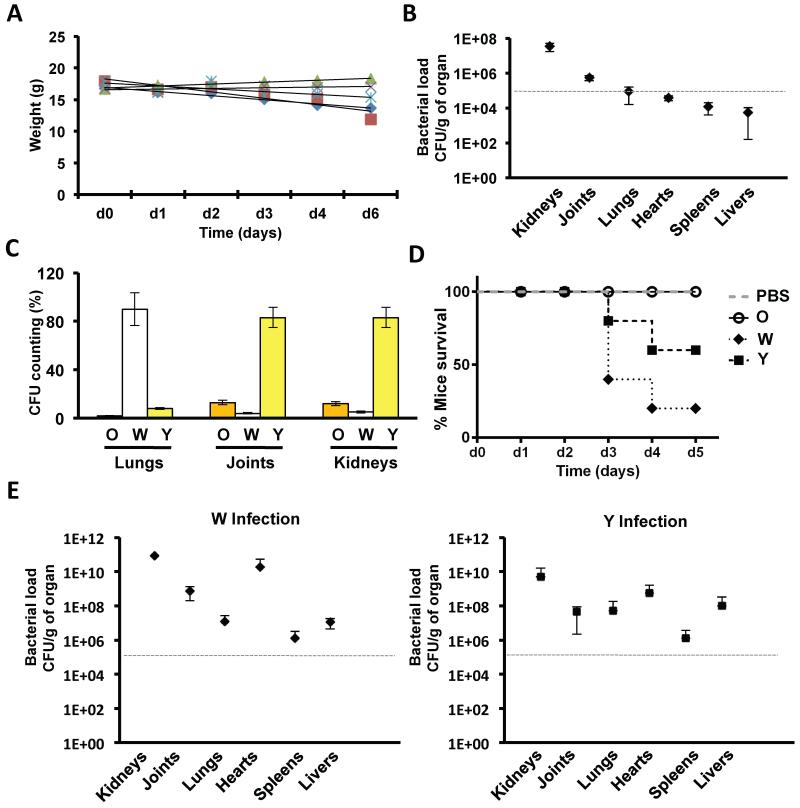
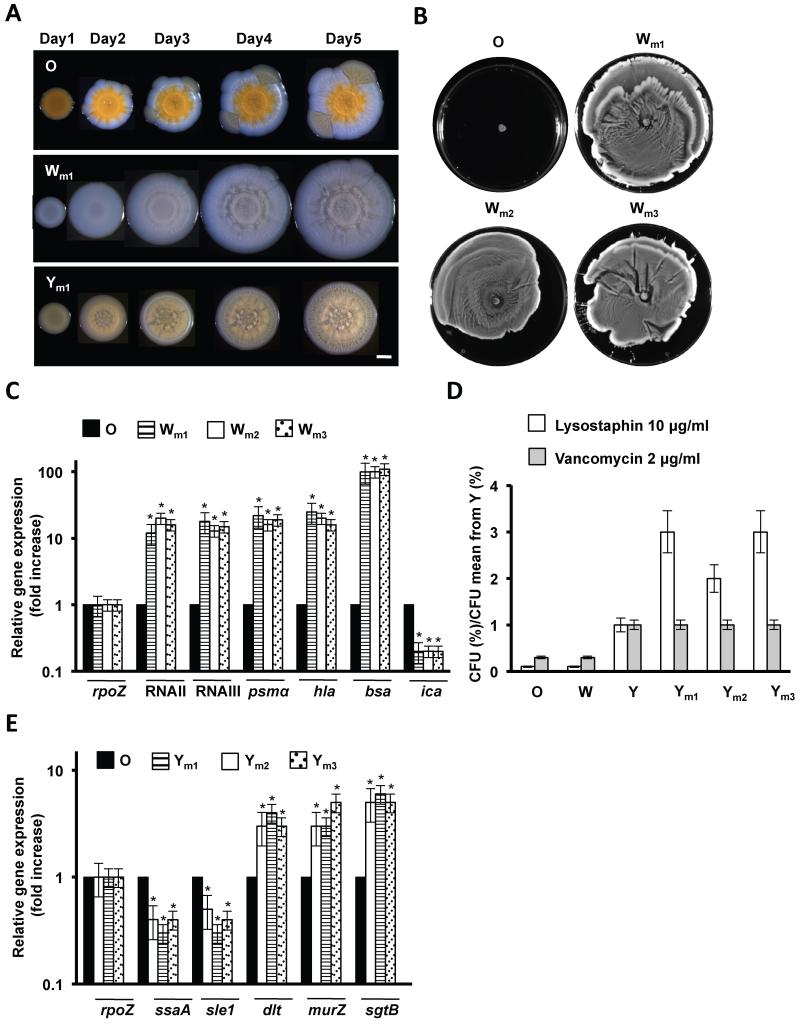
Antibiotic resistance is a key medical concern, with antibiotic use likely being an important cause. However, here we describe an alternative route to clinically relevant antibiotic resistance that occurs solely due to competitive interactions among bacterial cells. We consistently observe that isolates of Methicillin-resistant Staphylococcus aureus diversify spontaneously into two distinct, sequentially arising strains. The first evolved strain outgrows the parent strain via secretion of surfactants and a toxic bacteriocin. The second is resistant to the bacteriocin. Importantly, this second strain is also resistant to intermediate levels of vancomycin. This so-called VISA (vancomycin-intermediate S. aureus) phenotype is seen in many hard-to-treat clinical isolates. This strain diversification also occurs during in vivo infection in a mouse model, which is consistent with the fact that both coevolved phenotypes resemble strains commonly found in clinic. Our study shows how competition between coevolving bacterial strains can generate antibiotic resistance and recapitulate key clinical phenotypes.


Figures

Figure 1
Figure 1. Strain diversification in communities of S. aureus
(A) S. aureus SC01 derivative strain grown in TSB and TSBMg for 5 days at 37°C. (B) Progression of O, W and Y strains when growing in TSBMg for 5 days at 37°C. Scale bars 1 mm. (C) Measurements of Staphyloxanthin production, biofilm formation and secretion of hemolytic toxins in O, W and Y strains. C+ is LAC strain and C− is LAC ΔσB mutant. Hemolysis efficiency used LAC ΔσB mutant as a C+ and C− is LAC strain. (D) qRT-PCR of the expression staphyloxanthin production (crt), biofilm formation (ica and spa) and hemolytic toxins (hla) in O, W and Y strains in TSB and TSBMg growing media (Student’s t-test p ≤ 0.05). See figs. S1, S2.
Figure 2
Figure 2. Correlation of genome-wide gene expression levels quantified by RNA-seq
(A) Read coverage of the agr gene cluster in O, W and Y. The expression of agr in W is increased approx. 20-fold in relation to O. (B) Schematic overview of the genetic circuitry that antagonistically regulates toxin secretion and biofilm formation in S. aureus. Arrows are positive regulation and T-bars are repression. Dashed line is indirect regulation. Staphyloxanthin production is STX and GSG are general stress genes. Transcriptional activation in W is represented in green and downregulation is represented in red. (D) Read coverage of the bsa gene cluster in O, W and Y cells. The expression of the bsa in W strain is increased approx. 300-fold in relation to O strain. See fig. S3 and tables S3-5.
Figure 3
Figure 3. Adaptive abilities of the W strain
(A) Quantification of AIP in O, W and Y supernatants using a B. subtilis transducer strain and monitored by flow cytometry (n = 50,000 events). Grey profile is control with no supernatant added. (B) qRT-PCR analysis of RNAII, RNAIII and regulated genes in different genetic backgrounds (Student’s t-test p ≤ 0.05). (C) Spreading assay to monitor the ability of distinct strains to expand on solid surfaces. Samples were spotted and incubated for 24h at 37°C. (C) Muticellular communities of distinct strains growing in TSBMg for 5 days at 37°C. (D) Complementation of TSBMg with 5μM AIP. Plates were incubated at 37°C during 5 days. (E) Synthetic communities of different strain mixtures (ratio 5:1) were spotted in TSBMg and incubated at 37°C for 5 days YA strain differentiates. Scale bars are 1 mm. See figs. S3, S4, S6.
Figure 4
Figure 4. Adaptive abilities of the Y strain
(A) qRT-PCR analysis of the expression of bsa in distinct genetic backgrounds (Student’s t-test p ≤ 0.05). (B) Antimicrobial activity of filter-sterilized supernatants. 50 μl was used to supplement 1 ml cultures of B. subtilis. Growth inhibition prevented biofilm growth. Negative and positive controls (− and +) represent B. subtilis cultures without and with kanamycin 5 μM. (C) Quantification microbial survival (CFU/ml) in B. subtilis cultures conditioned with Bsa. (D) Growth curves of O, W and Y in TSB medium with different concentrations of Bsa or vancomycin (CFU/ml). Right panels show control growth curves of isogenic VSSA/VISA strains (N315/Mu50) in the presence of different concentrations of Bsa or vancomycin. See fig. S5.
Figure 5
Figure 5. Y strain is a VISA-like strain
(A) Progression of mixed LAC wild type strain + LAC ΔsigB Δbsa mutant in relation 5:1 (upper row). The communities grew in TSBMg at 37°C during 5 days. After incubation, the community failed to develop Y flares through the W sector. Progression of the O strain in TSBMg at 37°C during 5 days when supplemented with previously purified Bsa (~ 6 μM) (lower row). YB strain differentiates. Scale bar is 1mm. (B) Progression of the O strain Δbsa mutant in TSBMg at 37°C during 5 days. After incubation, the community failed to develop Y flares through the W sector. (C) qRT-PCR analysis of several VISA-related genes (ssaA, sle1, dltA murZ and sgtB) in O, Y strains and YA and YB strains derived from the artificial mixture WT+ΔsigB (fig. 3G) and Bsa supplementation (fig. 5A), respectively (Student’s t-test p ≤ 0.05). (D) Quantification of bacterial survival in response to lysostaphin treatment (LS 10 μg/ml during 15 min at 37°C). (E) Quantification of bacterial survival in response to lysostaphin and vancomycin treatment of different strains in relation to Y strain. See figs. S5, S7 and table S6.
Figure 6
Figure 6. Diversification of S. aureus communities in vivo
(A) Weight loss of infected BALB/c mice (n = 5) during the course of the infection. Mice were infected with 107 SC01 derivative previously grown in TSB medium (B) Bacterial loads in the different organs counted as CFU/g of organ. (C) Quantification of the colony forming units (CFU) of the distinct strains in the organs that showed higher bacterial load (≥ 105 CFU/g). (D) Survival curve of mice infected with O, W or Y strains. Cohorts of 5 mice were infected with 107 cells (in the case of O, W and Y infections) or PBS buffer as control. Mice were sacrificed when showing severe symptoms of infections (description of symptoms is in SI). (E) Quantification of CFU/g of W and Y strains in the organs of infected mice. A grey, dashed line defines a cut-off number of 105 CFU/g to define high and low bacterial load. See table S7.
Figure 7
Figure 7. Adaptive abilities of Wm and Ym strains diversified in vivo
(A) Progression of the O, Wm and Ym strains when growing in TSBMg for 5 days at 37°C. Scale bar is 1 mm. (B) Spreading assay of distinct Wm strains. (C) qRT-PCR of RNAII and RNAIII, RNAII- and RNAIII-regulated genes psmα and hla, bsa and repressed ica gene. (D) Quantification of bacterial survival in response to lysostaphin and vancomycin treatment of different Ym strains. Values are presented in relation to Y strain. (E) qRT-PCR analysis to monitor the differential expression of the VISA-related genes ssaA and sle1 autolysins, dltA and cell wall turnover murZ and sgtB genes (Student’s t-test p ≤ 0.05). See figs. S6, S7.

References

    1. Allen HK, Donato J, Wang HH, Cloud-Hansen KA, Davies J, Handelsman J. Call of the wild: antibiotic resistance genes in natural environments. Nature reviews Microbiology. 2010;8:251–259. - PubMed
    1. Beenken KE, Blevins JS, Smeltzer MS. Mutation of sarA in Staphylococcus aureus limits biofilm formation. Infect Immun. 2003;71:4206–4211. - PMC - PubMed
    1. Beenken KE, Dunman PM, McAleese F, Macapagal D, Murphy E, Projan SJ, Blevins JS, Smeltzer MS. Global gene expression in Staphylococcus aureus biofilms. J Bacteriol. 2004;186:4665–4684. - PMC - PubMed
    1. Benveniste R, Davies J. Aminoglycoside antibiotic-inactivating enzymes in actinomycetes similar to those present in clinical isolates of antibiotic-resistant bacteria. Proc Natl Acad Sci U S A. 1973;70:2276–2280. - PMC - PubMed
    1. Bischoff M, Dunman P, Kormanec J, Macapagal D, Murphy E, Mounts W, Berger-Bachi B, Projan S. Microarray-based analysis of the Staphylococcus aureus sigmaB regulon. J Bacteriol. 2004;186:4085–4099. - PMC - PubMed

Publication types

MeSH terms

Associated data