. 2014 Aug 28;158(5):1094-1109.
doi: 10.1016/j.cell.2014.07.032.

Dihydropyrimidine accumulation is required for the epithelial-mesenchymal transition

Affiliations

Dihydropyrimidine accumulation is required for the epithelial-mesenchymal transition

Yoav D Shaul et al. Cell. .

Abstract

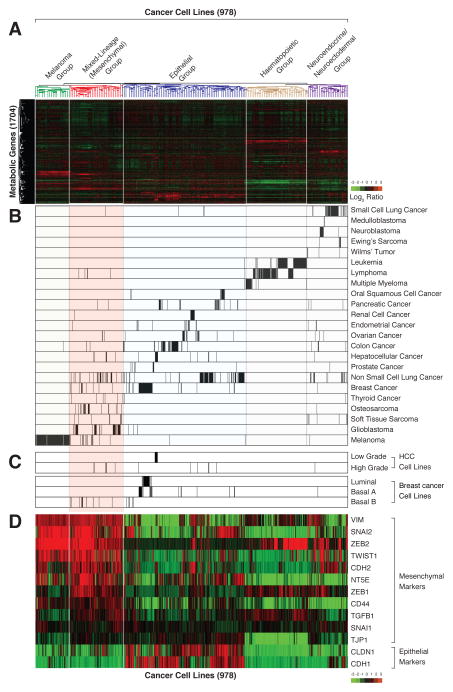
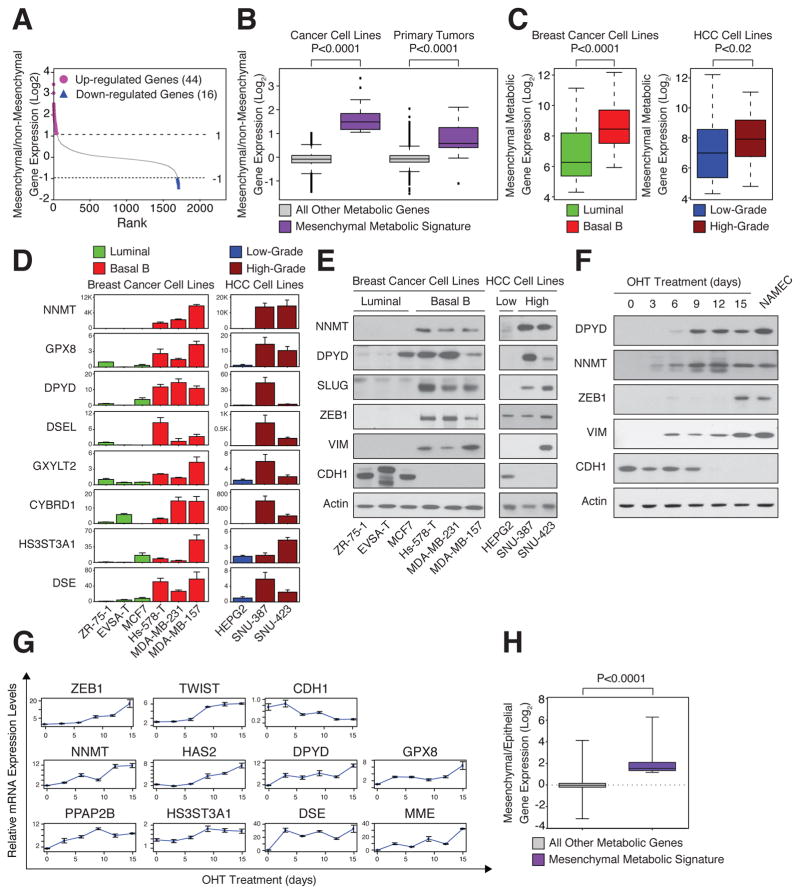
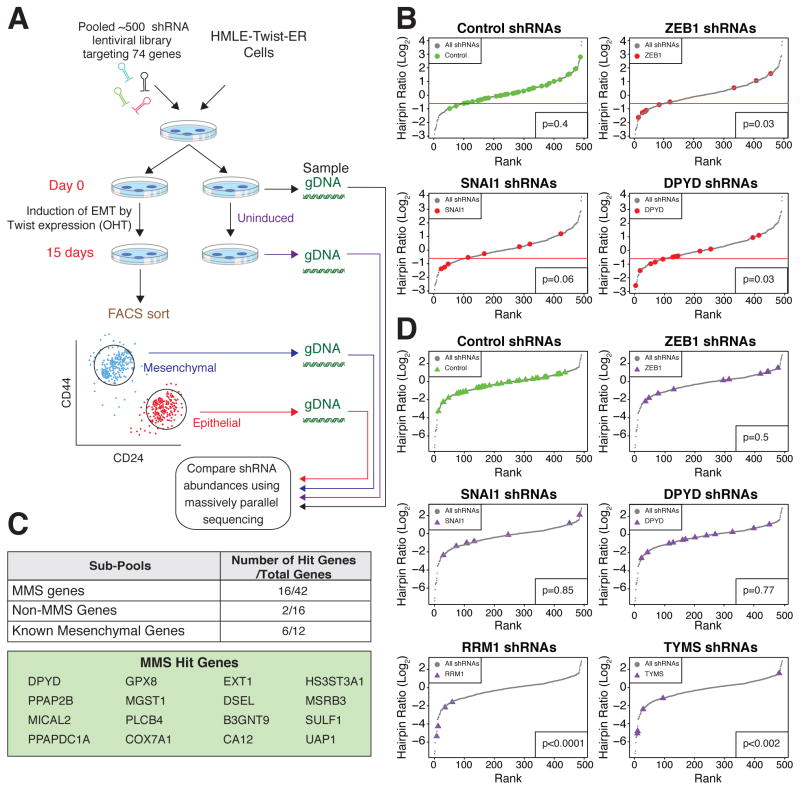
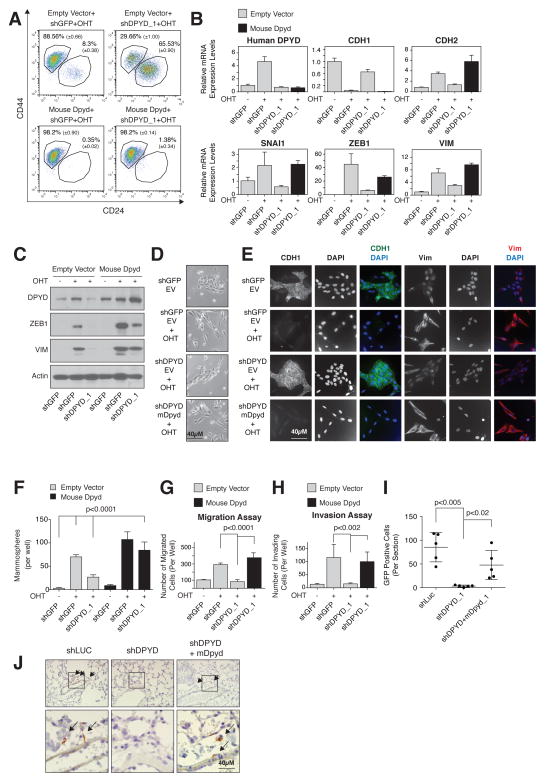
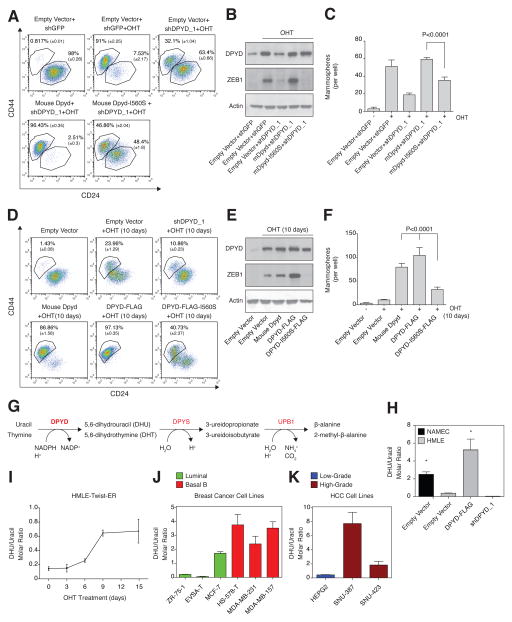
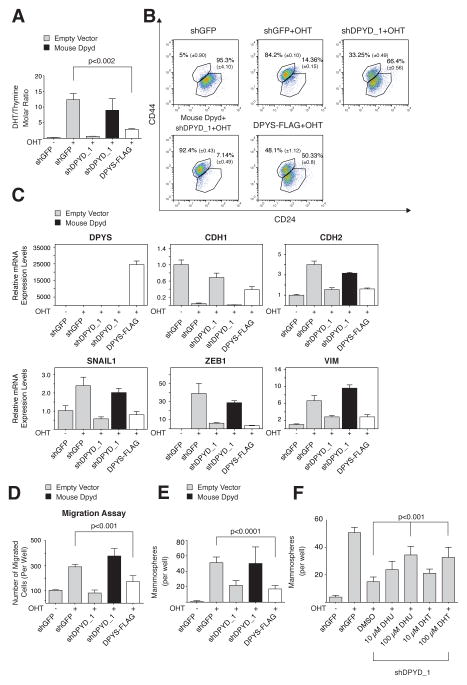
It is increasingly appreciated that oncogenic transformation alters cellular metabolism to facilitate cell proliferation, but less is known about the metabolic changes that promote cancer cell aggressiveness. Here, we analyzed metabolic gene expression in cancer cell lines and found that a set of high-grade carcinoma lines expressing mesenchymal markers share a unique 44 gene signature, designated the "mesenchymal metabolic signature" (MMS). A FACS-based shRNA screen identified several MMS genes as essential for the epithelial-mesenchymal transition (EMT), but not for cell proliferation. Dihydropyrimidine dehydrogenase (DPYD), a pyrimidine-degrading enzyme, was highly expressed upon EMT induction and was necessary for cells to acquire mesenchymal characteristics in vitro and for tumorigenic cells to extravasate into the mouse lung. This role of DPYD was mediated through its catalytic activity and enzymatic products, the dihydropyrimidines. Thus, we identify metabolic processes essential for the EMT, a program associated with the acquisition of metastatic and aggressive cancer cell traits.


Figures

Figure 1
Figure 1. Based on metabolic gene expression patterns, high-grade carcinoma cell lines co-cluster with mesenchymal cells
(A) Metabolic gene expression patterns are sufficient to cluster most, but not all, cancer cell lines based on their tissue of origin. Two-way hierarchical clustering of the expression levels of 1,704 metabolic genes in 978 different cell lines is presented as a heatmap (B) Cell lines derived from related cancer types co-cluster based on metabolic gene expression patterns. Each row shows all the cell lines in the dataset derived from the indicated cancer type. Within each row, each black line represents the position of a cell line in the cluster. (C) Most high-grade hepatocellular carcinoma (HCC) and basal B breast cancer cell lines cluster within the mesenchymal group. (D) Known mesenchymal markers are highly expressed in the mesenchymal group. Cancer cell lines were ordered as in (A).
Figure 2
Figure 2. High expression of mesenchymal metabolic signature (MMS) genes in mesenchymal cell lines
(A) Identification of the MMS. For each metabolic gene, the ratio between the mean expression level in the mesenchymal group of cell lines and in all other groups (see Figure 1) was determined and used to rank the genes. Genes that are upregulated (purple, 44 genes) or downregulated (blue, 16 genes) by at least 2-fold in mesenchymal relative to non-mesenchymal cells are highlighted. (B) Elevated MMS gene expression in mesenchymal cancer cell lines and primary tumors. Cancer cell lines and primary tumors were divided into mesenchymal and non-mesenchymal groups based on the expression of known mesenchymal markers (Figure 1D and Figure S2A). For each metabolic gene, the ratio of the mean expression level between the groups was determined. The box plots represent the log2 ratio distribution of MMS genes (purple) and all other metabolic genes (gray). (C) MMS gene expression is elevated in Basal B breast and high-grade HCC cancer cell lines. Box plots represent the expression levels of the MMS genes in the indicated breast cancer (green, luminal; red, Basal B) and HCC (blue, low-grade; brown, high-grade) subtypes. (D) Individual validation of MMS mRNA levels in breast cancer (green, luminal; red, Basal B) and HCC (blue, low-grade; brown, high-grade) cell lines by quantitative real-time PCR (qPCR). Each value represents the mean ± SEM for n=3. (E) Individual validation of MMS protein levels in the indicated breast cancer and HCC cell lines by immunoblotting. (F) MMS protein upregulation in the same cells as in (G). HMLE-Twist-ER cells were treated with hydroxytamoxifen (OHT) to induce an EMT for 15 days. Every three days, cellular proteins were isolated and subjected to immunoblotting using the indicated antibodies. NAMEC cells are mesenchymal cells derived from HMLE cells (see Experimental Procedures). (G) MMS gene upregulation in an HMLE-Twist-ER inducible EMT system. Every three days, cells were collected and mRNA isolated and subjected to qPCR using the indicated probes. Each value represents the mean ± SEM. (H) MMS genes are upregulated during the EMT. Microarray analysis for gene expression changes during EMT was described previously (GSE24202,(Taube et al., 2010)). Here the same dataset was reanalyzed for the log2 expression ratio of MMS and all other metabolic genes between HMLE-Twist-ER cells forced to express Twist and Snai1 (mesenchymal) to HMLE-Twist-ER expressing empty vector (epithelial). The box plots represent the log2 ratio expression distributions of MMS genes (purple) and all other metabolic genes (gray). The p value for the comparison between the two groups was determined using the Student’s T test.
Figure 3
Figure 3. A FACS-based pooled shRNA screen identifies DPYD as required for EMT
(A) Schematic presentation of the FACS-based pooled shRNA screen. OHT, hydroxytamoxifen; gDNA, genomic DNA. (B) DPYD knockdown (KD) inhibits the EMT. All hairpins from the screen were ranked based on the log2 ratio of their abundance in the mesenchymal relative to the epithelial population of OHT-induced HMLE-Twist-ER cells after FACS sorting (see Figure 3A). Hairpin sub-pools pictured include those targeting control genes (39 hairpins targeting RFP, GFP, luciferase, and LacZ), ZEB1 (9 hairpins), SNAI1 (8 hairpins), and DPYD (12 hairpins). One standard deviation below the mean of the distribution of the control hairpins was set as a cutoff (red line). Every hairpin with a log2 ratio below the cutoff was considered a hit. The significance of the differences in distribution between the selected genes and the other genes in the screen was quantified using the Student’s T test. (C) Several of the MMS genes are critical for the EMT. Genes with at least two hairpins scoring below the cutoff (see panel B) were classified as hit genes. The numbers in the table represent the hit genes as a fraction of the total genes in a given sub-pool. (D) DPYD KD does not affect cell viability. All hairpins were ranked based on the log2 ratio of their abundance in uninduced HMLE-Twist-ER cells on day 15 relative to day 0. The same hairpin sub-pools as in (B), with the addition of shRNAs targeting the essential genes RRM1 (4 hairpins) and TYMS (5 hairpins), are shown. The significance of the differences in distribution between the selected genes and the control genes was quantified using Student’s T test.
Figure 4
Figure 4. DPYD expression is essential for EMT induction
(A) Mouse DPYD expression rescues the effects of DPYD KD on the EMT. HMLE-Twist-ER cells were infected and treated as indicated followed by FACS analysis for the cell-surface markers CD24 and CD44. The percentage of cells in each gate is presented (mean ± SD). (B) Mouse DPYD rescues the effects of DPYD KD on mesenchymal gene expression. HMLE-Twist-ER cells were infected and treated as indicated. The expression levels of the indicated genes were measured using qPCR (mean ± SEM). (C) Mouse DPYD rescues the effects of DPYD KD on ZEB1 expression. HMLE-Twist-ER cells were infected and treated as indicated. Followed by immunoblotting with the indicated antibodies. (D) Mouse DPYD rescues the effects of DPYD KD on cell morphology. HMLE-Twist-ER cells were infected and treated as in (B) and visualized with bright-field microscopy. EV, empty vector. (E) Mouse DPYD rescues the effects of DPYD KD on cell morphology and gene expression. HMLE-Twist-ER cells were infected and treated as in (B) and the indicated proteins were visualized by immunofluorescence. (F) Mouse DPYD rescues the effects of DPYD KD on mammosphere formation. Quantification of in vitro mammosphere formation by cells treated as in (C). The data are reported as the number of mammospheres formed per 500 seeded cells; each value represents the mean ± SD for n=6. (G)Mouse DPYD rescues the effects of DPYD KD on cell migration. HMLE-Twist-ER cells were infected and treated as in (B) and their ability to migrate was measured. The data are reported as the number of migrated cells per 50,000 seeded cells; each value represents the mean ± SD for n=3. EV, empty vector. (H) Mouse DPYD rescues the effects of DPYD KD on cell invasiveness. HMLE-Twist-ER cells were infected and treated as in (B) and their ability to migrate through Matrigel was measured. The data are reported as in (G). (I) DPYD KD inhibits lung extravasation of cancer cells in vivo. HMLER-Twist-ER cells expressing the indicated hairpins and ORFs were treated with OHT for 15 days, and then injected into the mouse tail vein. After 3 days the number of GFP positive cells in each lung was determined by IHC. Each value (●) represents the average of three non-adjacent lung sections from a single mouse (5 mice per group). (J) DPYD KD inhibits lung extravasation of cancer cells in vivo. Representative GFP-positive cells from the same mouse lungs as in (I) are indicated with arrows. The bottom panels show magnifications of the boxed areas in the upper panels.
Figure 5
Figure 5. DPYD activity is essential for the EMT
(A) Mouse DPYD-I560S fails to rescue the effects of DPYD KD on the EMT. HMLE-Twist-ER cells were infected and treated as indicated followed by FACS analysis as in Figure 4A. (B) Mouse DPYD-I560S fails to rescue the effects of DPYD KD on ZEB1 expression. HMLE-Twist-ER cells were infected and treated as indicated followed by immunoblotting with the indicated antibodies. (C) The I560S mutation prevents the capacity of mDPYD to promote mammosphere formation in DPYD KD cells. Cells treated as in (B) were subjected to the in vitro mammosphere formation assay as in Figure 4F. (D) DPYD activity accelerates the EMT. HMLE-Twist-ER cells infected with the indicated constructs were either left untreated or treated with OHT for 10 days, followed by FACS analysis as in Figure 4A. The percentage of cells in each gate is presented. (E) Unlike wild-type human DPYD, overexpression of the catalytically attenuated DPYD (DPYD-I560S) does not potentiate the Twist-induced ZEB1 upregulation after 10 days of OHT treatment. Cells infected with the indicated constructs were either left untreated or treated with OHT for 10 days, followed by immunoblotting with the indicated antibodies. (F) DPYD activity enhances mammosphere formation. Cells treated as in (D) were subjected to the in vitro mammosphere formation assay as in Figure 4F. (G)Schematic presentation of the pyrimidine degradation pathway. Gene names are marked in red: DPYD, dihydropyrimidine dehydrogenase (rate-limiting step); DPYS, dihydropyrimidinase; UPB1, beta-ureidopropionase. (H) Modulation of DPYD expression affects the cellular DHU/uracil molar ratio. DHU and uracil levels were measured by liquid chromatography and mass spectrometry (LC-MS) in NAMEC or HMLE-Twist-ER cell lines expressing empty vector, DPYD-FLAG or shDPYD_1 hairpin. Each value represents the mean ± SD. (I) The cellular DHU/uracil ratio increases during EMT. HMLE-Twist-ER cells were treated with OHT for 15 days. At the indicated time points, samples were collected and subjected to LC-MS analysis to determine DHU and uracil levels. The molar concentration ratio between the two metabolites in each sample is presented. Each value represents the mean ± SD. (J) The cellular DHU/uracil ratio is elevated in Basal B relative to luminal breast cancer cell lines. The concentrations of DHU and uracil were measured in the indicated breast cancer cell lines (green, luminal; red, basal B) using LC-MS. Each value represents the mean ± SD. (K) The cellular DHU/uracil ratio is elevated in high-grade relative to low-grade HCC cell lines. Same as (D), but for HCC cell lines (blue, low-grade; brown, high-grade). Each value represents the mean ± SD for n=3.
Figure 6
Figure 6. DPYS expression inhibits the EMT program
(A) DPYS-FLAG expression reduces the cellular DHT/thymine ratio. HMLE-Twist-ER cells were infected and treated as indicated followed by liquid chromatography and mass spectrometry (LC-MS) to measure the intracellular DHT and thymine concentration. Each value represents the mean ± SD. (B) DPYS-FLAG expression inhibits the EMT program. HMLE-Twist-ER cells were infected and treated as in (A) followed by FACS analysis for the cell-surface markers CD24 and CD44. The percentage of cells in each gate is presented. (C) DPYS-FLAG expression reduces the expression level of mesenchymal genes. HMLE-Twist-ER cells were infected and treated as in (A) and the indicated gene expression levels were measured using qPCR. (D) DPYS-FLAG expression inhibits cell migration. HMLE-Twist-ER cells were infected and treated as in (A) and their ability to migrate was determined. The data are reported as in Figure 4G. (E) DPYS-FLAG expression inhibits mammosphere formation. Quantification of in vitro mammosphere formation by cells infected and treated as in (A). The data are reported as in Figure 4F. (F) DPYD products rescue the effect of DPYD KD on mammosphere formation. HMLE-Twist-ER cells expressing shDPYD_1 were treated with the indicated concentrations of DHU or DHT and subjected to the in vitro mammosphere formation assay as in (E). The data are reported as in Figure 4F.

Similar articles

Cited by

References

    1. Al-Hajj M, Wicha MS, Benito-Hernandez A, Morrison SJ, Clarke MF. Prospective identification of tumorigenic breast cancer cells. Proc Natl Acad Sci USA. 2003;100:3983–3988. - PMC - PubMed
    1. Amstutz U, Froehlich TK, Largiadèr CR. Dihydropyrimidine dehydrogenase gene as a major predictor of severe 5-fluorouracil toxicity. Pharmacogenomics. 2011;12:1321–1336. - PubMed
    1. Benesch MGK, Tang X, Maeda T, Ohhata A, Zhao YY, Kok BPC, Dewald J, Hitt M, Curtis JM, McMullen TPW, et al. Inhibition of autotaxin delays breast tumor growth and lung metastasis in mice. Faseb J. 2014;28:2655–2666. - PubMed
    1. Brabletz T. To differentiate or not — routes towards metastasis. Nat Rev Cancer. 2012;12:425–436. - PubMed
    1. Büchel B, Rhyn P, Schürch S, Bühr C, Amstutz U, Largiadèr RC. LC-MS/MS method for simultaneous analysis of uracil, 5,6-dihydrouracil, 5-fluorouracil and 5-fluoro-5,6-dihydrouracil in human plasma for therapeutic drug monitoring and toxicity prediction in cancer patients. Cancer Sci. 2012;27:7–16. - PubMed

Publication types