. 2014 Aug 28;158(5):1159-1172.
doi: 10.1016/j.cell.2014.07.001.

Axonally synthesized ATF4 transmits a neurodegenerative signal across brain regions

Affiliations

Axonally synthesized ATF4 transmits a neurodegenerative signal across brain regions

Jimena Baleriola et al. Cell. .

Abstract

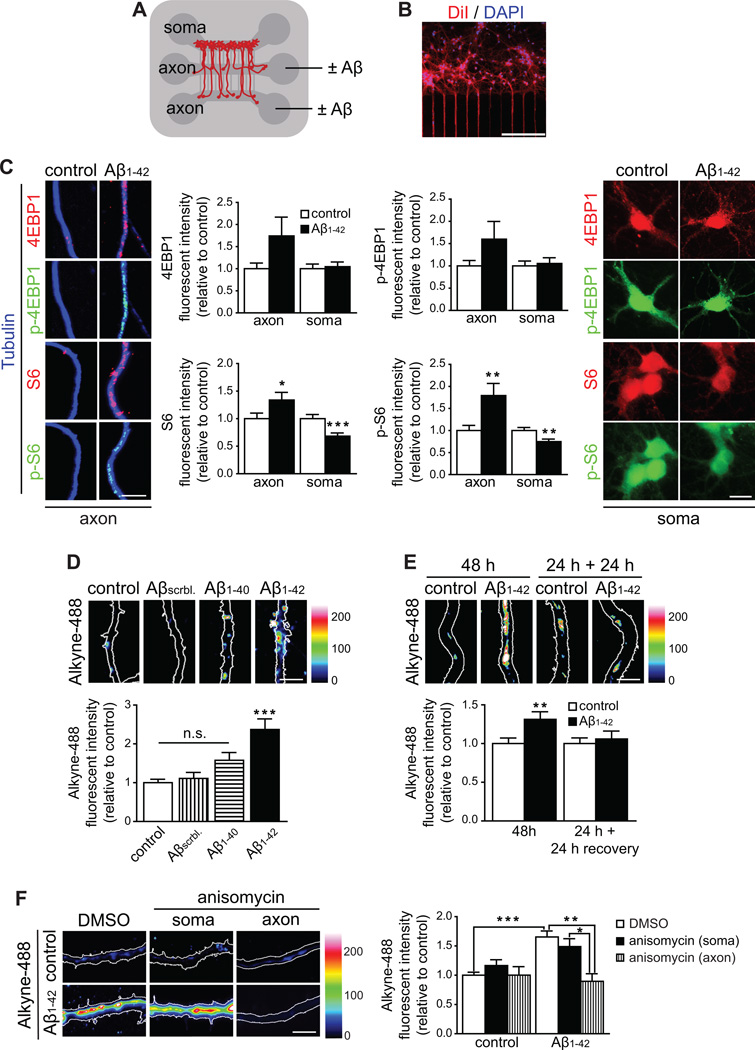
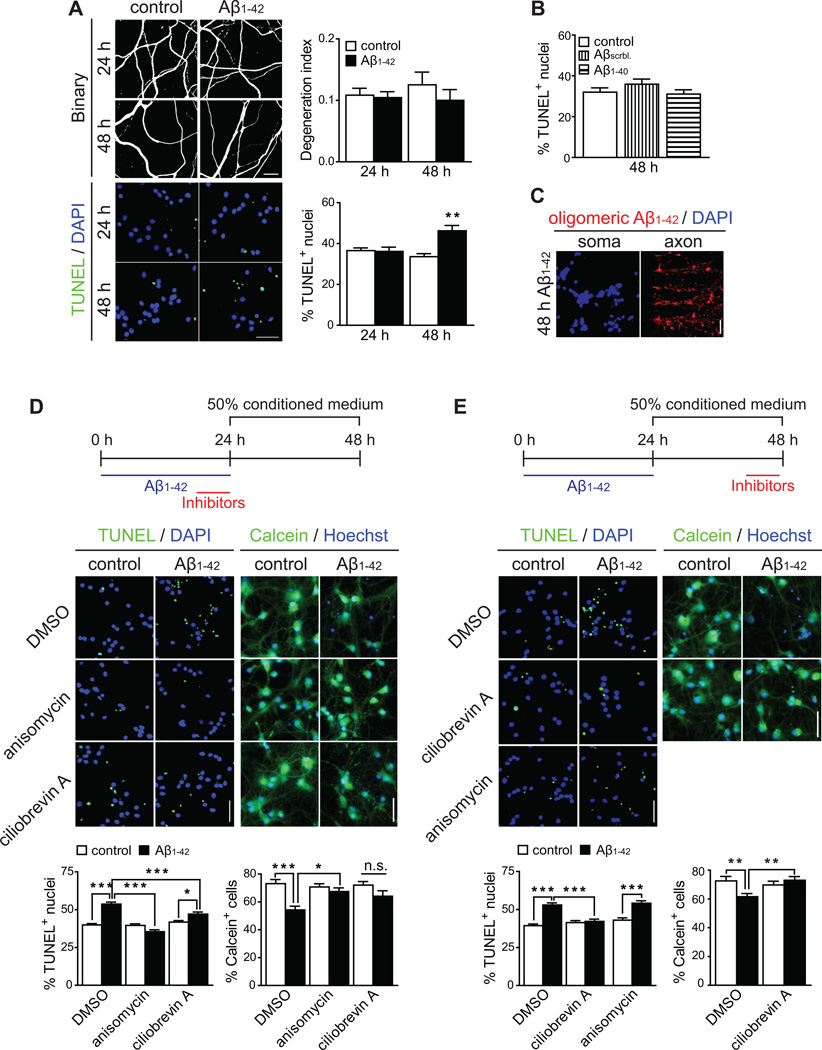
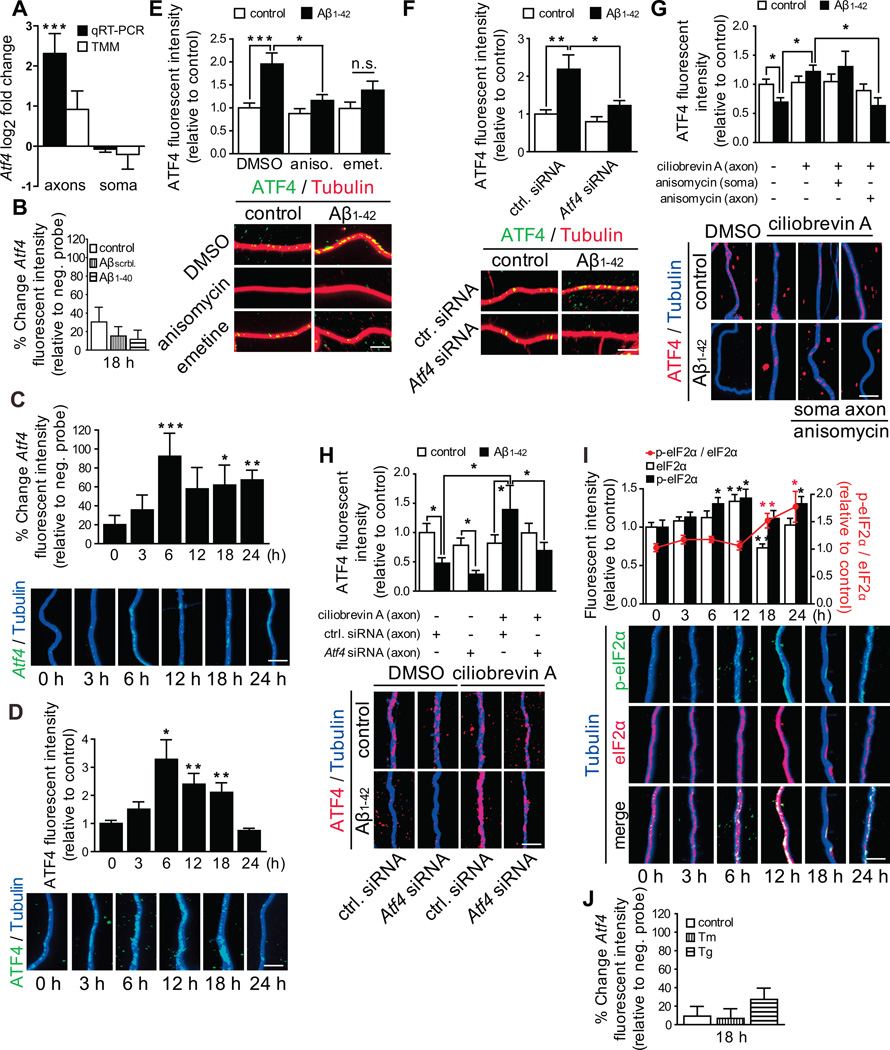
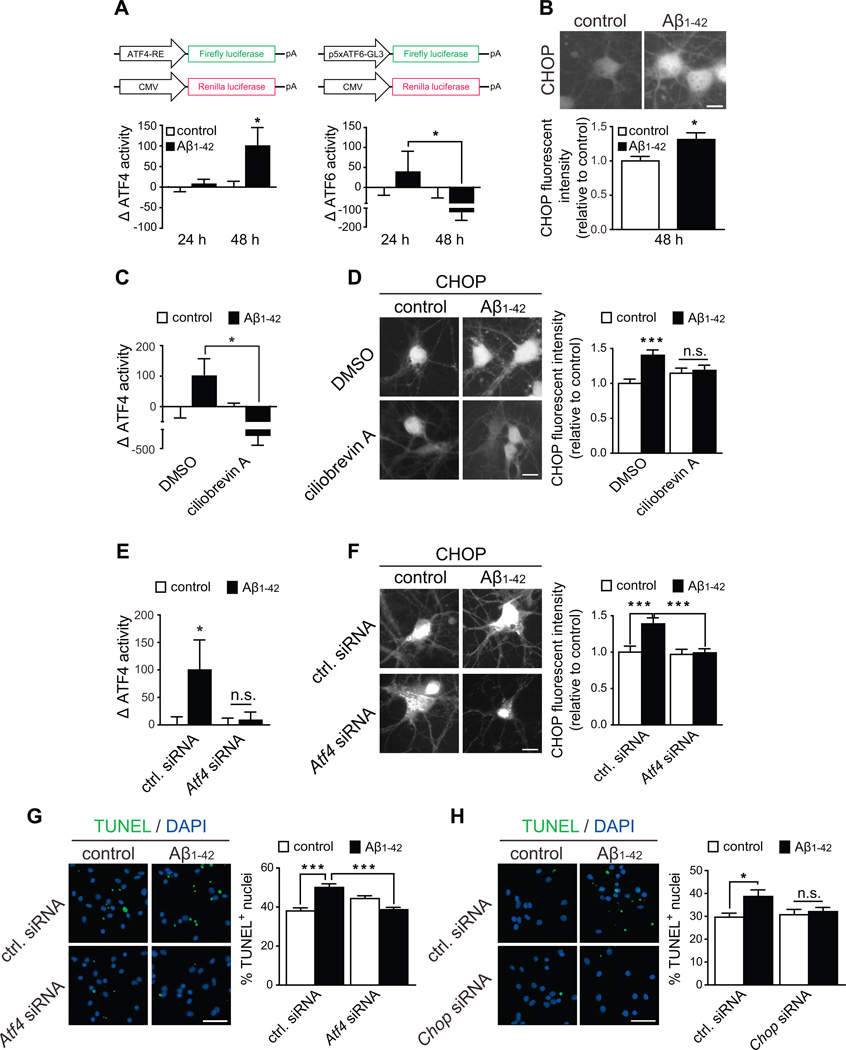
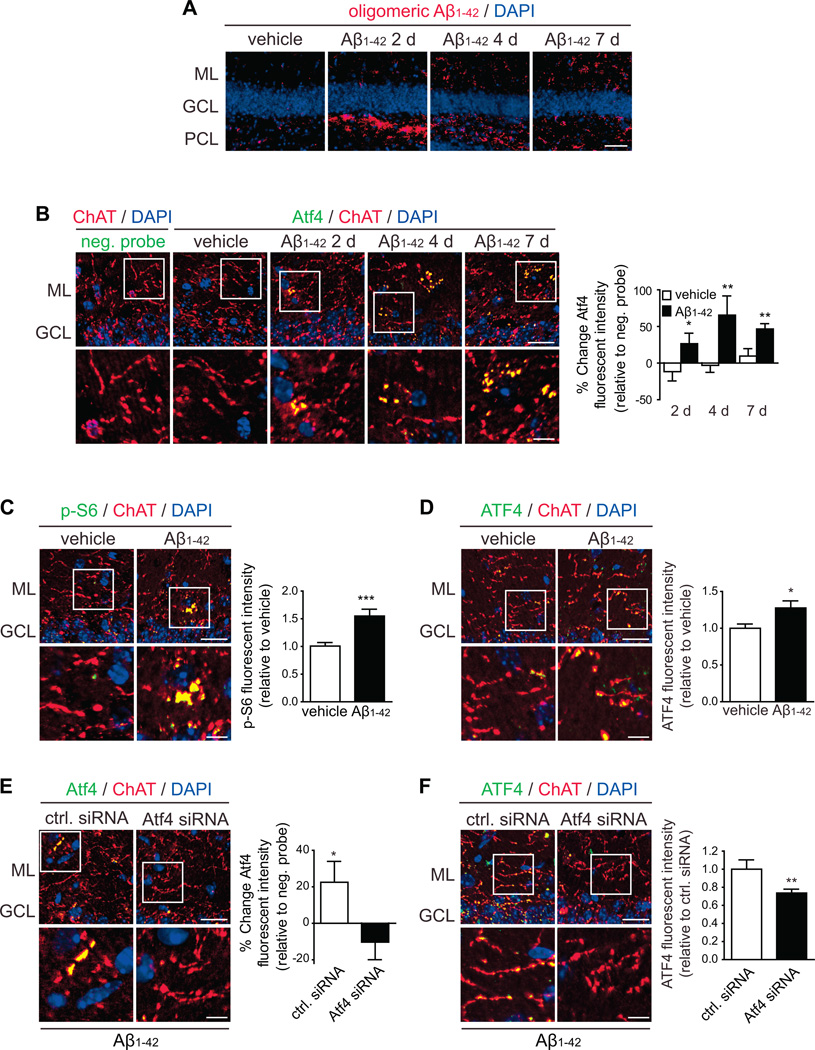
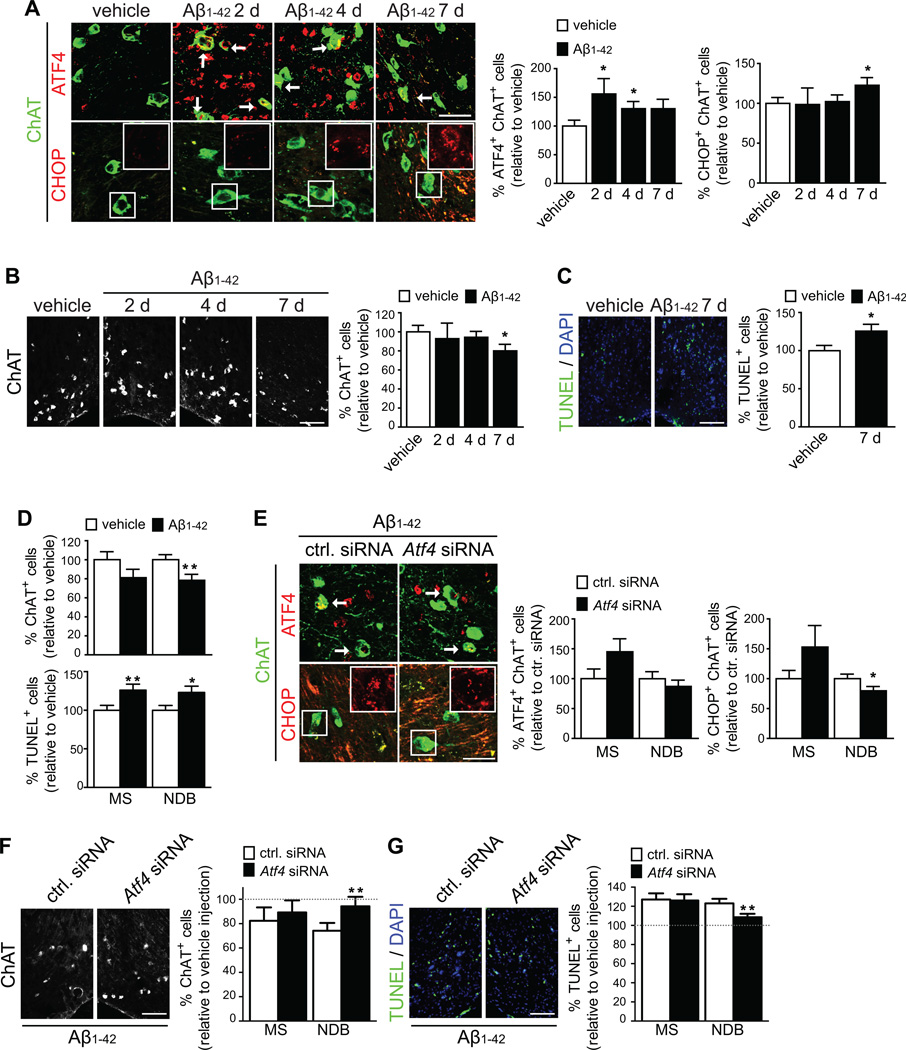
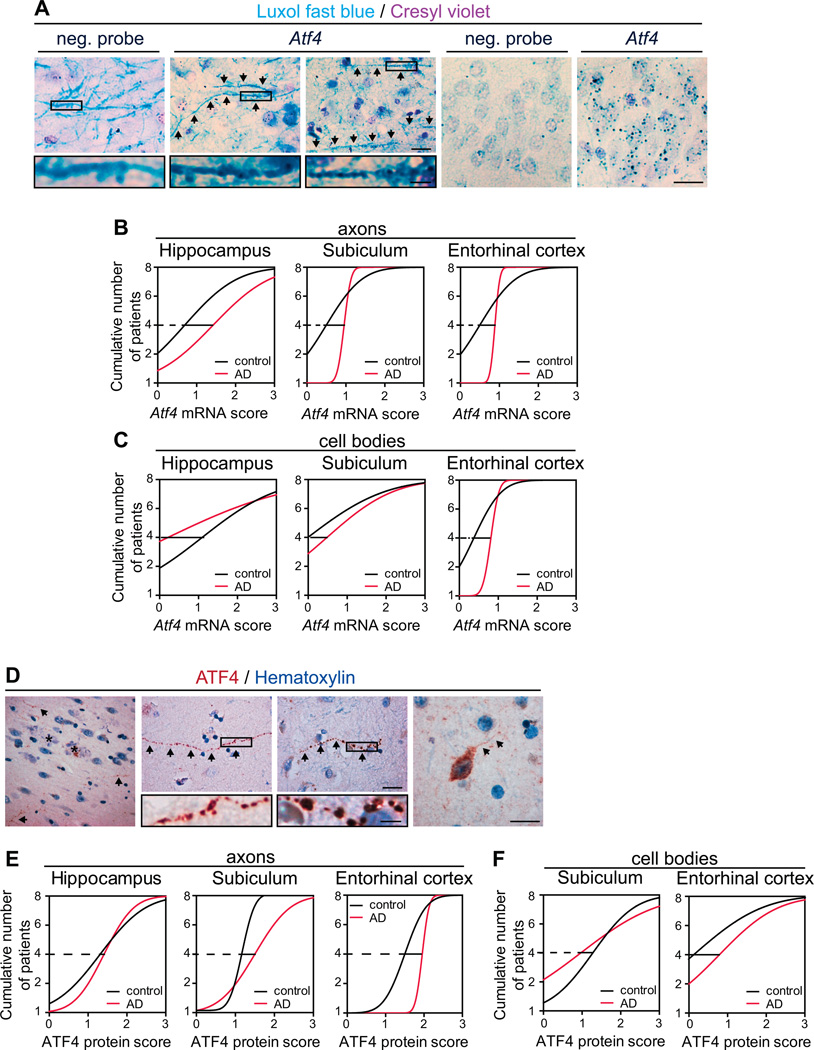
In Alzheimer's disease (AD) brain, exposure of axons to Aβ causes pathogenic changes that spread retrogradely by unknown mechanisms, affecting the entire neuron. We found that locally applied Aβ1-42 initiates axonal synthesis of a defined set of proteins including the transcription factor ATF4. Inhibition of local translation and retrograde transport or knockdown of axonal Atf4 mRNA abolished Aβ-induced ATF4 transcriptional activity and cell loss. Aβ1-42 injection into the dentate gyrus (DG) of mice caused loss of forebrain neurons whose axons project to the DG. Protein synthesis and Atf4 mRNA were upregulated in these axons, and coinjection of Atf4 siRNA into the DG reduced the effects of Aβ1-42 in the forebrain. ATF4 protein and transcripts were found with greater frequency in axons in the brain of AD patients. These results reveal an active role for intra-axonal translation in neurodegeneration and identify ATF4 as a mediator for the spread of AD pathology.


Figures

Figure 1
Figure 1. Locally applied Aβ1–42 oligomers induce intra-axonal protein synthesis
(A) Scheme of a microfluidic chamber used to isolate axons of hippocampal neurons. Neurons were cultured in the upper compartment. Axons cross through two 200-µm-long microgroove barriers into the axonal compartments. (B) Neuronal cell bodies were retrogradely labeled by applying DiI selectively to the axons. Typically between 40% (optical fields proximal to the microgrooves) and 30% (distal fields) of neurons were labeled indicating their axons had crossed the microgrooves. Scale bar, 200 µm. (C) Hippocampal neurons were cultured in microfluidic chambers for 9–10 DIV and axons were treated with vehicle or Aβ1–42 for 24 h. Axons (left micrographs) and cell bodies (right micrographs) were immunostained for 4EBP1, p-4EBP1, S6 or p-S6. Mean ±SEM of 23–25 optical fields per condition (n=5 biological replicates per group). * p<0.05; **p<0.01; ***p<0.001. Scale bars, 5 µm (left micrographs), 20 µm (right micrographs). (D) Axons were treated with vehicle, Aβscrambled,1–40 or Aβ1–42 for 24 h. 2 h prior to fixation, axons were sequentially incubated with AHA and 488-DIBO. Newly synthesized proteins were detected by the fluorescent signal (represented in pseudo color). Mean ±SEM of 25–35 optical fields per condition (n=5–7 biological replicates per group). ***p<0.001. Scale bars, 5 µm. (E) Axons were treated with vehicle or Aβ1–42 for 48 h or for 48 h replacing the oligomer-containing medium with fresh 50% conditioned medium after 24 h. 2 h prior to sample processing axons were treated as in D. Mean ±SEM of 35–45 optical fields per condition (n=7–9 biological replicates per group). **p<0.01. Scale bar, 5 µm. (F) Axons were treated with vehicle or Aβ1–42 for 24 h. 2 h and 30 min prior to fixation, axons were sequentially incubated with anisomycin or vehicle, and with AHA and 488-alkyne. Newly synthesized proteins were detected by their fluorescence signal (represented in pseudo color). Mean ±SEM of 25–65 optical fields per condition (5–13 biological replicates per group). *p<0.05; **p<0.01; ***p<0.001. Scale bar, 5 µm. See also Figure S1.
Figure 2
Figure 2. Intra-axonal protein synthesis and retrograde transport are sequentially required for Aβ1–42-induced somatic degeneration
(A) Axons were treated with vehicle or Aβ1–42 for 24 or 48 h. Fragmentation of axonal tubulin (upper micrographs) or nuclear TUNEL staining (lower micrographs) were measured. Mean ±SEM of 25–55 axonal fields per condition (upper graph, n=5–11 biological replicates per group) and 50–70 somatic fields per condition (lower graph, n=5–7 biological replicates per group). **p<0.01. (B) Axons were treated with vehicle, Aβscrambled or Aβ1–40 for 48 h. TUNEL-positive nuclei were quantified. Mean ±SEM of 25–35 optical fields per condition (n=5–7 biological replicates). (C) Immunostaining for Aβ1–42 on axons and cell bodies. (D) Inhibitors were applied to axons during the last 6 h of the 24 h Aβ1–42 treatment period. The culture medium from the axonal compartments was then replaced with 50% conditioned medium and cells were allowed to recover. Cell death (left panels) or survival (right panels), were assessed by TUNEL and Calcein staining, respectively. Mean ±SEM of 50–70 somatic fields stained for TUNEL per condition (left graph) and 25–31 somatic fields stained for Calcein (right graphs) per condition (n=5–7 biological replicates per group). *p<0.05; ***p<0.001. (E) Inhibitors were applied to axons during the last 6 h of the 48 h experimental period. Cell death and survival were assessed as before. Mean ±SEM of 50–100 somatic fields stained for TUNEL per condition (left graph) and 30 somatic fields stained for Calcein (right graphs) (n=5–10 biological replicates). *p<0.05; ***p<0.001. Scale bars, 50 µm. See also Figure S2.
Figure 3
Figure 3. Atf4mRNA is recruited into Aβ1–42-treated axons, and axonal ATF4 protein is locally synthesized and retrogradely transported
(A) Log2 fold change for Atf4 mRNA as determined by real time RT-PCR and DESeq2 (TMM). ***p<0.001. (B) Hippocampal neurons were cultured in microfluidic chamber for 9–10 DIV, axons were treated with vehicle, Aβscrambled or Aβ1–40 for 18 h, and axonal Atf4 mRNA levels were measured by quantitative FISH. Mean ±SEM of 25–30 optical fields per condition (n=5–6 biological replicates). (C) Axons were treated with Aβ1–42 for the indicated times, and axonal Atf4 mRNA levels were measured by quantitative FISH. Mean ±SEM of 25–40 axonal fields per condition (n=5–8 biological replicates per group). The background fluorescence was determined using a non-targeting probe (neg. probe) and set to zero. *p<0.05; **p<0.01; ***p<0.001. Scale bar, 5 µm. (D) Neurons were cultures and treated as in C. Axonal ATF4 protein levels were measured by quantitative immunofluorescence. Mean ±SEM of 20–40 axonal fields per condition (n=4–8 biological replicates per group). *p<0.05; **p<0.01. Scale bar, 5 µm. (E) Hippocampal neurons were cultured and treated as in B. 3 h prior to sample processing axons were treated with DMSO, anisomycin or emetine. Axonal ATF4 protein levels were determined by quantitative immunofluorescence. Mean ±SEM of 25–35 axonal fields per condition (n=5–7 biological replicates per group). ***p<0.001: *p<0.05. Scale bar, 5 µm. (F) Hippocampal neurons were cultured in microfluidic chambers for 8 DIV. Axons were transfected with a control (ctrl.) siRNA or a siRNA targeting Atf4. 24 h after transfection axons were treated with vehicle or Aβ1–42 for 18 h. ATF4 protein levels were measured by quantitative immunofluorescence. Mean ±SEM of 35–55 axonal fields per condition (n=7–11 biological replicates per group). **p<0.01: *p<0.05. (G) Axons were treated with vehicle or Aβ1–42 for 24h, in the presence or absence of ciliobrevin A for 6h. Anisomycin was added to the cell body or the axonal compartment for 3 h. Axons were immunostained for ATF4 protein. Mean ±SEM of 30–40 axonal fields per condition (n=6–8 biological replicates per group). *p<0.05. (H) Axons were transfected with a control siRNA or siRNAs targeting Atf4 mRNA and treated with Aβ1–42 and ciliobrevin A as in G. Axons were immunostained for ATF4 protein. Mean ±SEM of 30–40 axonal fields per condition (n=6–8 biological replicates per group). *p<0.05. (I) Neurons were cultured and treated as in C. eIF2α and p-eIF2α levels were determined by quantitative immunofluorescence. Mean ±SEM of 20–35 axonal fields per condition (n=4–7 biological replicates per group). (J) Neurons were cultured as in B. Axonal were treated for 18 h with tunicamycin (Tm) or thapsigargin (Tg) and Atf4 mRNA levels were determined by quantitative FISH. Mean ±SEM of 30 optical fields per condition (n=6 biological replicates). Scale bars, 5 µm. See also Figure S3 and Supplemental Table S1.
Figure 4
Figure 4. Axonally synthesized ATF4 induces ATF4-dependent gene expression in the nucleus and leads to retrograde somatic degeneration via CHOP
(A) Neurons were grown in microfluidic chambers and cell bodies were transfected with the reporter gene constructs 24 h before local exposure of axons to Aβ1–42. Luciferase activities were measured in cell lysates 24 and 48 h after axons had been treated with vehicle or Aβ1–42. Data are plotted as the ratio Firefly(RLU)/Renilla(RLU) and normalized to vehicle. The maximum increase in Firefly(RLU) activity per experiment was set to 100%. Mean ±SEM of 7–12 biological replicates per condition. *p<0.05. (B) CHOP levels were measured in cell bodies by quantitative immunofluorescence after 48 h of local application of Aβ1–42 to axons. Mean ±SEM of 30–40 microscopy fields per condition (n=6–8 biological replicates per group). *p<0.05. Scale bar, 20 µm. (C) Neurons were cultured as in A and axons were exposed to Aβ1–42 oligomers for 48 h. 6 h prior to luciferase measurement axons were exposed to vehicle or ciliobrevin A. Mean ±SEM of 6–10 biological replicates per condition. *p<0.05. (D) Axons were treated as in C. CHOP levels were measured in cell bodies by quantitative immunofluorescence. Mean ±SEM of 35–45 optical fields per condition (n=7–9 biological replicates per group). ***p<0.001. Scale bar, 20 µm. (E) Neurons were cultured as in A and axons were transfected with control or Atf4 siRNA 24 h before Aβ1–42 treatment. Luciferase activities were measured and represented as in A. Mean ±SEM of 10–12 biological replicates per condition. *p<0.05. (F) Axons were treated as in E. CHOP levels in cell bodies were measured by quantitative immunofluorescence. Mean ±SEM of 30–40 microscopy fields (n=6–8 biological replicates per group). ***p<0.001. Scale bar, 20 µm. (G) Neurons were cultured and treated as in E. Cell bodies were processed for TUNEL staining. Mean ±SEM of 70–90 microscopy fields (n=7–9 biological replicates per group). ***p<0.001. Scale bar, 50 µm. (H) Neurons were cultured as in A and cell bodies were transfected with control or Chop siRNA 24 h before Aβ1–42 treatment. Cell bodies were processed for TUNEL staining after 48 h of Aβ1–42 application to axons. Mean ±SEM of 60 microscopy fields (n=6 biological replicates per group). *p<0.05. Scale bar, 50 µm. See also Figure S4.
Figure 5
Figure 5. Intra-hippocampal injection of Aβ1–42 induces synthesis of ATF4 in BFCN axons
(A) Presence of Aβ1–42 in the DG of mice injected with vehicle and Aβ1–42 oligomers 2 to 7 DPI. 4 to 5 mice were analyzed per condition. ML, molecular layer; GCL, granule cell layer; PCL, polymorphic cell layer. Scale bar, 50 µm. (B) FISH for Atf4 mRNA in the DG of mice injected with vehicle and Aβ1–42. BFCN axons were identified by ChAT immunostaining. Cell bodies were counterstained with DAPI. Mean ±SEM of measurements performed in 3–4 brain slices per mouse (n=4 mice per group). Background fluorescence was determined non-targeting probe signal and set to zero. *p<0.05; **p<0.01. Scale bars, 20 µm, 5 µm (insets). (C) Phosphorylation levels of ribosomal protein S6 within ChAT-positive axons were measured by quantitative immunofluorescence on brain sections 7 DPI. Mean ±SEM of measurements typically performed in 4 brain slices per mouse (n=4 mice). ***p<0.001.Scale bars, 20 µm, (insets, 5 µm). (D) ATF4 protein levels within ChAT-positive axons were measured by quantitative immunofluorescence on brain sections 7 DPI. Mean ±SEM of measurements typically performed in 4 brain slices per mouse (n=4 mice). *p<0.05. Scale bars, 20 µm, (insets, 5 µm). (E) Mice were injected with Aβ1–42 oligomers in both hemispheres of the brain. The left hemisphere was co-injected with a control (ctrl.) siRNA and the right hemisphere with an Atf4 siRNA. The presence of Atf4 mRNA within ChAT-positive axons was analyzed by FISH 7 DPI. Mean ±SEM of measurements typically performed in 3 brain slices per mouse (n=3 mice). Background fluorescence was determined non-targeting probe signal and set to zero. *p<0.05. Scale bars, 20 µm, (insets, 5 µm). (F) Mice were injected as in E. ATF4 protein levels within ChAT-positive axons were measured by quantitative immunofluorescence on brain sections 7 DPI. Mean ±SEM of measurements typically performed in 4 brain slices per animal (n=4 mice). **p<0.01. Scale bars, 20 µm, (insets, 5 µm). See also Figure S5.
Figure 6
Figure 6. Intra-axonal synthesis of ATF4 leads to neurodegeneration in the adult mouse brain
(A) Mice were injected with vehicle in the left hemisphere of the brain and with Aβ1–42 in the contralateral hemisphere. Sections of the basal forebrain were immunostained for ChAT and ATF4 or CHOP 2 to 7 DPI. Mean ±SEM of positive cells relative to vehicle in ~8 brain slices per animal (n=4–5 mice per condition). *p<0.05. Scale bar, 50 µm. (B) ChAT-positive neurons in the basal forebrain of injected mice. Mean ±SEM of ChAT-positive neurons relative to the vehicle injected side in ~8 brain slices per animal (n=4–5 mice per condition). *p<0.05. Scale bar, 100 µm. (C) TUNEL-positive cells in the basal forebrain of injected mice 7 DPI. Mean ±SEM of TUNEL-positive cells relative to the vehicle injected side in ~8 brain slices per mouse (n=5 mice). *p<0.05. Scale bar, 100 µm. (D) Comparison of the effect of Aβ1–42 injection on ChAT- and TUNEL-positive cells in the MS and NDB 7 DPI. Mean ±SEM of positive cells in ~8 brain slices per mouse (n=5 mice). *p<0.05; **p<0.01. (E) Aβ1–42 injections were performed in both hemispheres of the brain. A control (ctrl.) siRNA was co-injected into the left hemisphere and an Atf4 siRNA was co-injected in the right hemisphere. Basal forebrain sections were immunostained for CHAT and ATF4 or CHOP. ATF4- and CHOP-positive cholinergic neurons were quantified in the MS and NDB. Mean ±SEM of double-positive cells relative to ctrl. siRNA in ~8 brain sections per animal (n=5 mice). *p<0.05. Scale bar, 50 µm. (F) Mice were injected as in E. ChAT-positive neurons in the basal forebrain of injected mice were quantified in the MS and NDB. Mean ±SEM of ChAT-positive neurons relative to ctrl. siRNA in ~8 brain slices per animal (n=5 mice per condition). **p<0.01. Scale bar, 100 µm. (G) TUNEL-positive cells in the forebrain of injected mice. Mean ±SEM of TUNEL-positive cells relative to ctrl. siRNA in ~8 brain slices per mouse (n=5 mice). **p<0.01. Scale bar, 100 µm. See also Figure S6 and Supplemental Table S2.
Figure 7
Figure 7. Presence of Atf4 mRNA granules and ATF4 protein in axons and axonal-like structures in the AD brain
(A) Representative micrographs of Atf4 mRNA granules in axons and cell bodies in human brain samples. Panels 1–3: axons stained with luxol fast blue and a negative probe or an Atf4-targeting probe. Atf4-containing axons are indicated with arrows. Panels 4–5: examples of granule cells stained with cresyl violet and a negative or Atf4-targeting probe. Scale bars, 20 µm (Insets, 5 µm). (B) Cumulative frequency distributions of Atf4-containing axons in the hippocampus, the subiculum, and the entorhinal cortex of control and AD cases (n=8 brains per condition). (C) Cumulative frequency distributions of Atf4-containing cell bodies in the hippocampus, the subiculum, and the entorhinal cortex of control and AD cases (n=8 brains per condition). (D) Representative micrographs of ATF4 protein in processes and cell bodies in human brain samples. First panel: an ATF4-positive process (arrows) in the vicinity of amyloid plaques (asterisks). Second panel: a relatively intact ATF4-positive process. Third panel: a beaded process. Fourth panel: A positive cell body and neurite (arrows). Scale bars, 20 µm (insets, 5 µm). (E) Cumulative frequency distributions of ATF4-positive processes axons in the hippocampus, the subiculum, and the entorhinal cortex of control and AD cases (n=8 brains per condition). (F) Cumulative frequency distributions of ATF4-positive cell bodies in the subiculum and the entorhinal cortex of control and AD cases (n=8 brains per condition).

Comment in

References

    1. Ameri K, Harris AL. Activating transcription factor 4. Int J Biochem Cell Biol. 2008;40:14–21. - PubMed
    1. Averous J, Bruhat A, Jousse C, Carraro V, Thiel G, Fafournoux P. Induction of CHOP expression by amino acid limitation requires both ATF4 expression and ATF2 phosphorylation. J Biol Chem. 2004;279:5288–5297. - PubMed
    1. Cox LJ, Hengst U, Gurskaya NG, Lukyanov KA, Jaffrey SR. Intra-axonal translation and retrograde trafficking of CREB promotes neuronal survival. Nat Cell Biol. 2008;10:149–159. - PMC - PubMed
    1. Dubacq C, Jamet S, Trembleau A. Evidence for developmentally regulated local translation of odorant receptor mRNAs in the axons of olfactory sensory neurons. J Neurosci. 2009;29:10184–10190. - PMC - PubMed
    1. Gumy LF, Yeo GS, Tung YC, Zivraj KH, Willis D, Coppola G, Lam BY, Twiss JL, Holt CE, Fawcett JW. Transcriptome analysis of embryonic and adult sensory axons reveals changes in mRNA repertoire localization. RNA. 2011;17:85–98. - PMC - PubMed

Publication types

Substances