. 2014 Aug 28;158(5):1173-1186.
doi: 10.1016/j.cell.2014.07.045.

Temporal patterning of neuroblasts controls Notch-mediated cell survival through regulation of Hid or Reaper

Affiliations

Temporal patterning of neuroblasts controls Notch-mediated cell survival through regulation of Hid or Reaper

Claire Bertet et al. Cell. .

Abstract

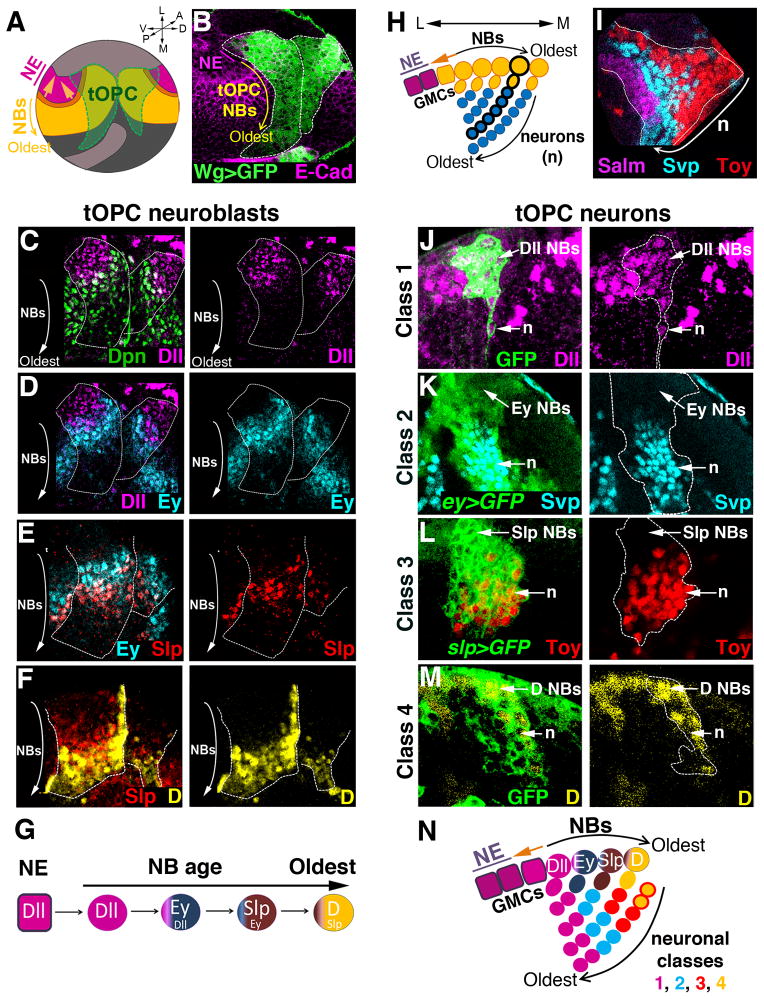
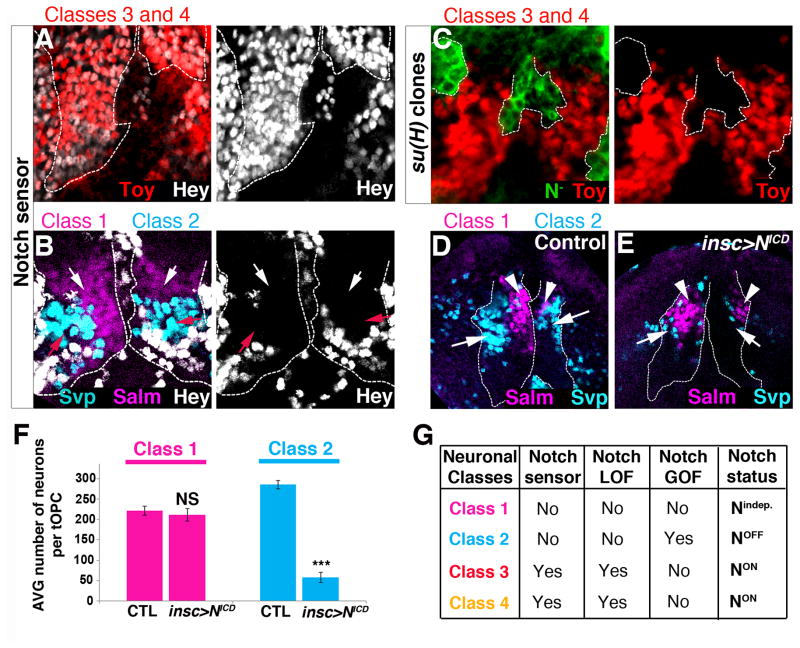
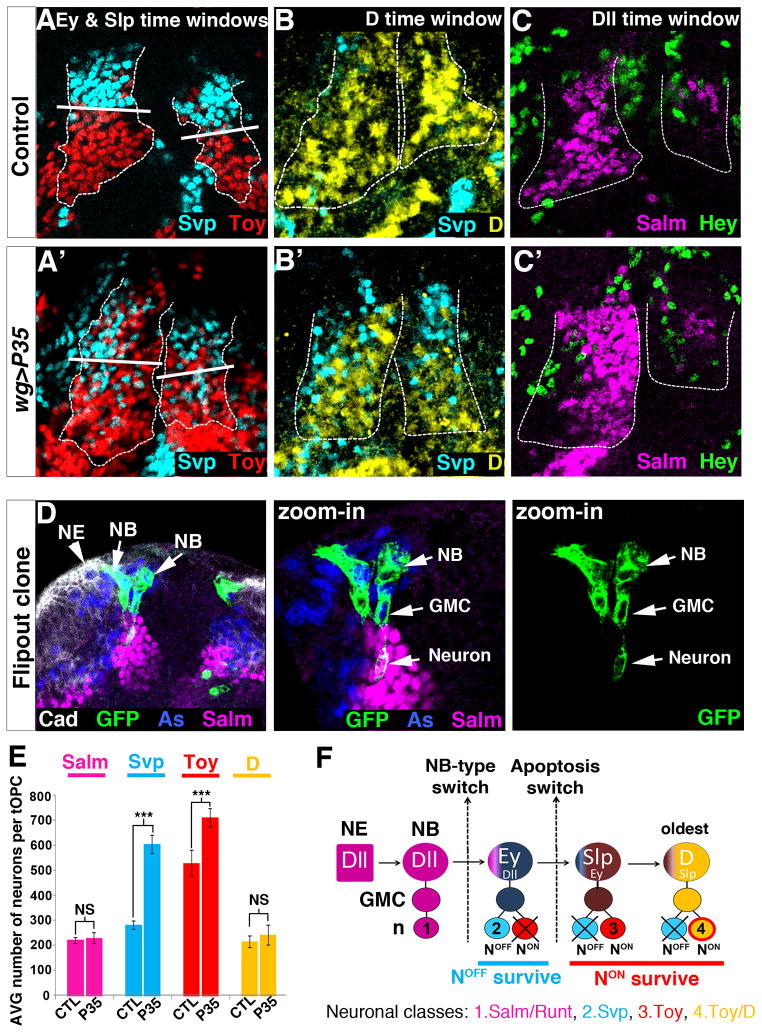
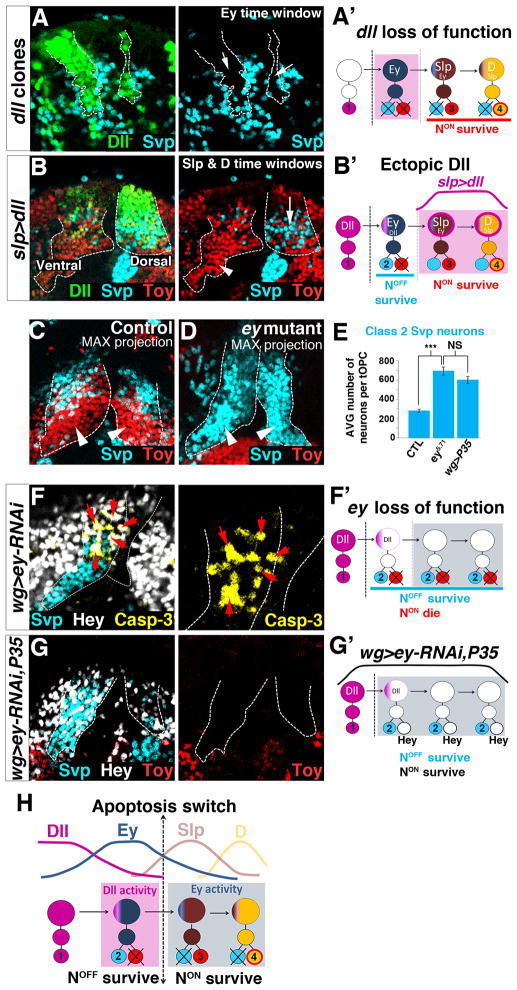
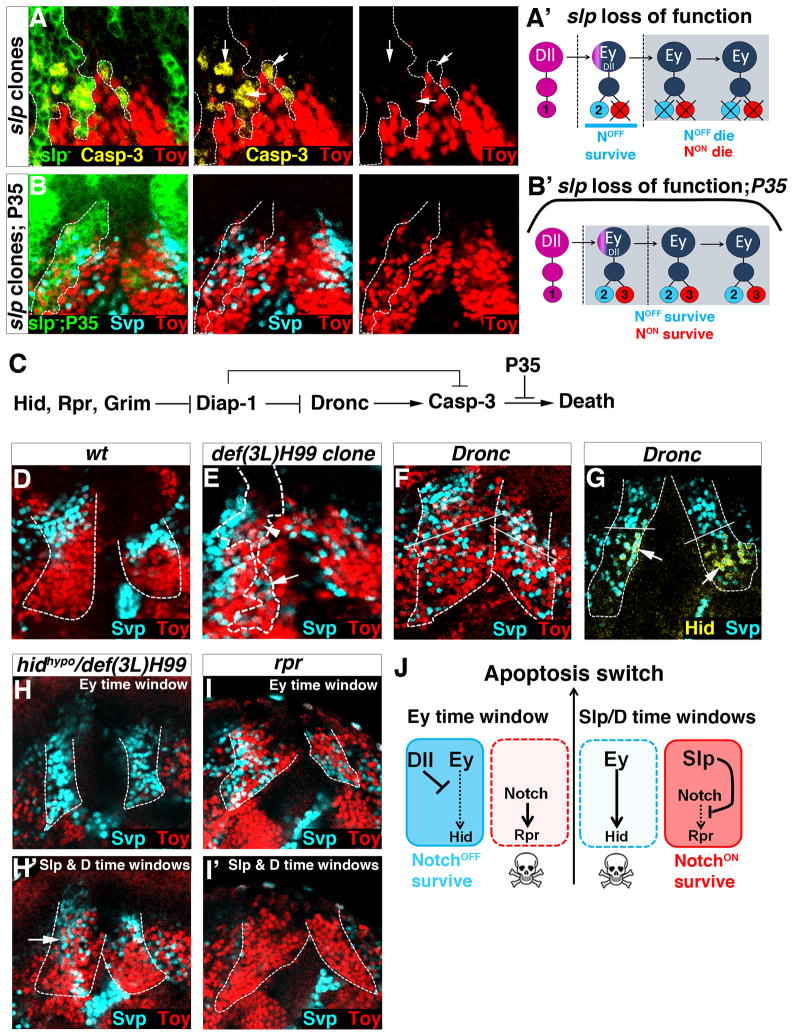
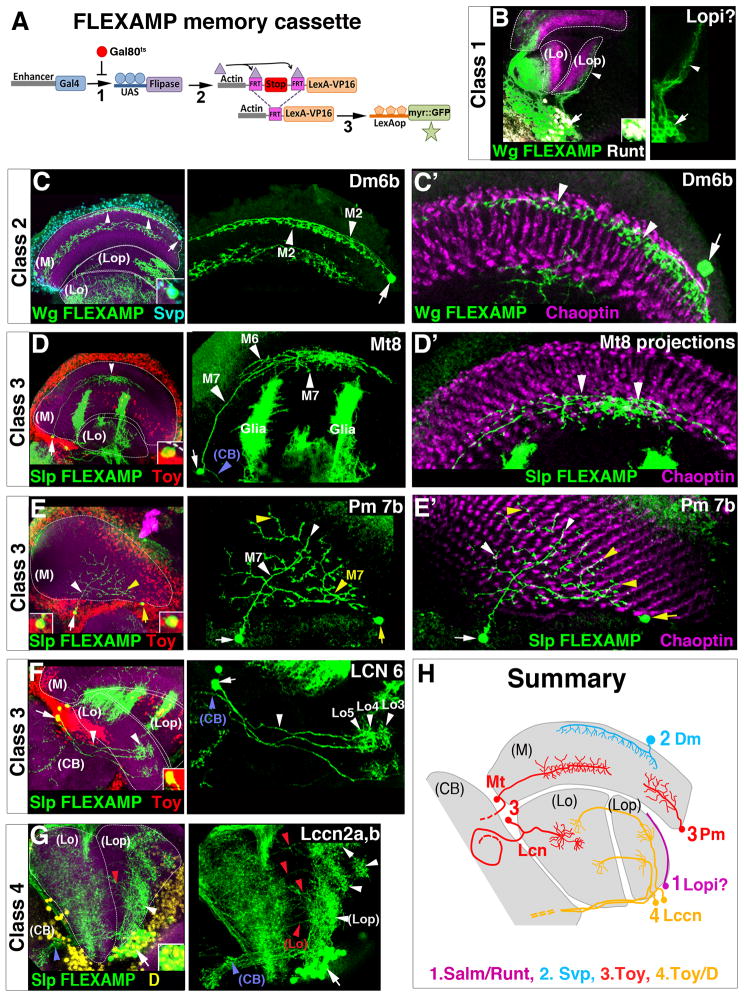
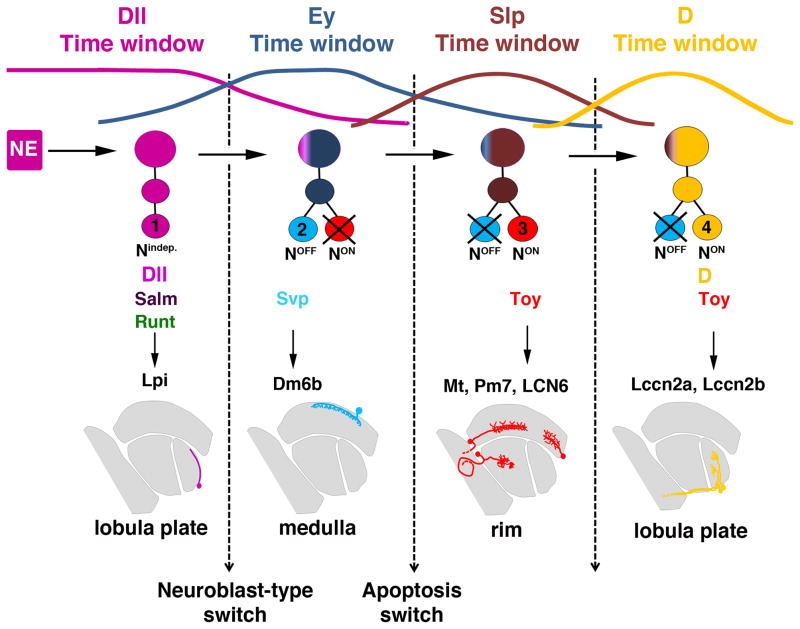
Temporal patterning of neural progenitors is one of the core mechanisms generating neuronal diversity in the central nervous system. Here, we show that, in the tips of the outer proliferation center (tOPC) of the developing Drosophila optic lobes, a unique temporal series of transcription factors not only governs the sequential production of distinct neuronal subtypes but also controls the mode of progenitor division, as well as the selective apoptosis of Notch(OFF) or Notch(ON) neurons during binary cell fate decisions. Within a single lineage, intermediate precursors initially do not divide and generate only one neuron; subsequently, precursors divide, but their Notch(ON) progeny systematically die through Reaper activity, whereas later, their Notch(OFF) progeny die through Hid activity. These mechanisms dictate how the tOPC produces neurons for three different optic ganglia. We conclude that temporal patterning generates neuronal diversity by specifying both the identity and survival/death of each unique neuronal subtype.


Figures

Figure 1
Figure 1. The tOPC temporal series sequentially produces four neuronal classes
Unless specified, all pictures are posterior views of third instar larvae (L3). A, Model of a larval optic lobe showing that a wave of neurogenesis (orange) converts OPC neuroepithelial cells (NE, purple) into neuroblasts (NBs, yellow). The tOPC is defined by wg-gal4 expression (green). A, anterior; P, posterior; V, ventral; D, dorsal; L, lateral; M, medial. B, The tOPC region (wg>GFP, green, dashed lines). E-Cad stains the neuroepithelium (purple). C–G, tOPC neuroblasts sequentially express Dll (magenta in C, D), Ey (cyan in D, E), Slp (red in E, F) and D (yellow in F). White dashed lines show the tOPC. H, Model of a cross-section showing neuroblasts (yellow circles), GMCs (yellow) and neurons (cyan). A single neuroblast clone is shown with black thick outlines. I, Cross-section view showing the clustered organization of three of the four medulla neuronal classes: Class 1 (Salm, magenta), Class 2 (Svp, cyan) and Class 3 (Toy, red). J, Cross-section view. Early neuroblast clone (GFP, dashed lines) showing that Dll (magenta) is transmitted from neuroblasts (NBs) to neurons (n). K, Perduring GFP driven by ey-gal4 (dashed lines) is expressed in almost all Svp neurons (cyan). L, GFP driven by slp-gal4 (dashed lines) is expressed in all Toy neurons (red). M, Cross section view. Late neuroblast clone (dashed lines) showing that D expression (yellow) is transmitted to the neurons. N, Schematic model of tOPC neurogenesis. Only one neuroblast/GMC is shown for each stage. See also Figure S1.
Figure 2
Figure 2. Notch status of tOPC neurons
Posterior views of L3 optic lobes. A, B, Hey (white) is expressed by Class 3 Toy and Class 4 Toy/D neurons (A) but not by Class 1 Salm/Runt (magenta, white arrows) and Class 2 Svp (cyan, red arrows) neurons (B). Dashed lines indicate the tOPC. C, Class 3 Toy and Class 4 Toy/D neurons (red) are lost in su(H) mutant clones (GFP, dashed lines). D, Control brains showing Class 1 Salm/Runt (magenta, arrowheads) and Class 2 Svp (cyan, arrows) neurons. E, Ectopic Notch signaling (insc>NICD) leads to the loss of Class 2 Svp neurons (cyan, arrows) but has no effect on Class 1 Salm/Runt neurons (magenta, arrowheads). Dashed lines indicate the tOPC. F, Average number of tOPC neurons in control and Notch gain-of-function (N=7 brains/genotype). Magenta=Class 1 Salm/Runt neurons, Cyan=Class 2 Svp neurons. All data represent mean ± s.d. NS, not significant. *** P<0.001. G, Summary. See also Figure S2.
Figure 3
Figure 3. Origin of the clustered organization of tOPC neurons
Posterior views of L3 optic lobes. A–C, P35 expression in tOPC neurons. Dashed lines show the tOPC. A, B Control brains showing the NotchOFF Class 2 Svp (cyan in A), NotchON Class 3 Toy (red in A) and NotchON Class 4 Toy/D clusters (yellow in B). In P35-expressing brains, NotchOFF Svp neurons are completely intermingled with NotchON Toy (A′) and NotchON Toy/D (B′) neurons in the Ey, Slp and D time windows. White bars in A and A′ delimitate the border between the Ey and the Slp time windows. C, Control brain stained with Hey (green) and Salm (magenta). C′ P35 expression has no effect on the Notchindep Salm/Runt cluster. D, Single neuroblast clones showing that newly specified neuroblasts generate GMCs (Asense, blue) that directly differentiate into one Class 1 neuron (Salm, magenta). Neuroepithelium (NE, arrowhead) is stained with DE-Cad (white). Asterisk indicates a newly formed neuroblast that has not produced any neuron yet. E, Average number of Salm (magenta), Svp (cyan), Toy (red) and D (yellow) neurons in control and wg>P35 (N=6 brains/genotype). All data represent mean ± s.d. NS, not significant. *** P<0.001. F, tOPC neurogenesis mode. See also Figure S3.
Figure 4
Figure 4. Dll and Ey control Notch-mediated neuronal survival
Posterior views of L3 optic lobes. Unless otherwise mentioned, dashed lines show the tOPC. A,A′, dll mutant clones (green, dashed lines). Removing dll affects Class 2 Svp neurons (cyan, arrow). B,B′, Dll over-expression. slp-gal4 is strongly expressed in the dorsal tOPC but weakly expressed in the ventral tOPC that serves as an internal control (B). Expressing Dll (green) in Slp and D neuroblasts rescues the death of Class 2 Svp neurons (cyan, compare arrow with arrowhead on control side). C, Maximal projection of a wt brain showing Class 2 (Svp, cyan) and Class 3 & 4 (Toy, red) neuronal clusters. D, Maximal projection of an ey mutant brain showing the disappearance of NotchON Class 3 and 4 neurons (red) and the expansion of NotchOFF Class 2 Svp neurons (cyan, arrowheads). E, Average number of Class 2 Svp neurons in various genotypes (N=6 brains/genotype). All data represent mean±s.d. NS, not significant. *** P<0.001. F,F′, In wg>ey-RNAi, NotchON Hey-positive neurons (white) all express the death marker cleaved Caspase-3 (yellow, arrows). G,G′, Co-expressing P35 with ey-RNAi rescues the death of NotchON Hey-positive neurons (white) and generates an intermingling between these neurons and NotchOFF Class 2 Svp neurons (cyan). The rescued NotchON neurons do not express Toy (red). H, Timing of Dll and Ey activities. See also Figure S4.
Figure 5
Figure 5. tOPC temporal factors and the cell death pathway
Posterior views of L3 optic lobes. Unless specified, dashed lines show the tOPC. A,A′, In slp mutant clones (dashed lines), NotchON Toy-expressing neurons (red) die as shown by expression of cleaved Caspase-3 (yellow, arrows). B,B′, Expressing P35 in slp clones rescues the death of NotchON Toy neurons (red). C, The cell death pathway. D, NotchOFF Class 2 (Svp, cyan) and NotchON Class 3 & 4 clusters (Toy, red) in a wild-type tOPC. E, Removing hid, rpr and grim (def(3L)H99 clones, dashed lines) rescues the death of NotchON Toy neurons (red) in the Ey time window (arrowhead), and that of NotchOFF Svp neurons (cyan) in the Slp and D time windows (arrow). F, Removing Dronc generates an intermingling between NotchOFF (Svp, cyan) and NotchON neurons (Toy, red) in the Ey, Slp and D time windows. White bars delimitate the border between the Ey and Slp time windows. G, In Dronc mutants, Hid is only expressed in the NotchOFF Svp neurons that normally die in the Slp and D time windows. H, H′, Decreasing Hid activity (hidhypomorph/def(3L)hid99) has no effect on the neurons produced during the Ey time window (H). However, this rescues the death of NotchOFF Svp neurons (cyan) in the Slp and D time windows (H′). This phenotype is more pronounced in the ventral side of the tOPC (arrow). I, I′, Removing rpr rescues the death of NotchON Toy neurons in the Ey time window (red, i) but has no effect on the neurons produced during the Slp and D time windows (I′). J, Interactions between tOPC temporal factors and cell death genes. See also Figure S5.
Figure 6
Figure 6. Neuronal subtypes produced in the tOPC
A, The FLEXAMP memory cassette. B–G, FLEXAMP memory clones in mid-pupal (B) and adult brains (C–G); In all panels, dashed lines show the neuropils stained by N-Cad (magenta). B,B′, wg>FLEXAMP clones (green) suggests that Class 1 Salm/Runt neurons (white) are Lpi neurons. C, wg>FLEXAMP clones (green). Class 2 Svp neurons (cyan) are Dm6b neurons projecting in medulla layers M2 and M3. C′, Dm6b projections seem to contact R8 photoreceptors axons (Chaoptin, magenta). D–F, slp->FLEXAMP clones (green) showing the three types of Class 3 Toy neurons (red). D, Mt8 neurons project in M7, M6 (white arrowheads) and the central brain (blue arrowhead). D′, Mt8 projections seem to contact R7 photoreceptors terminations (Chaoptin, magenta). E, Two Pm7b neurons (medium-size projections) identified with white and yellow arrows, projecting into M7 and contacting R7 projections (Chaoptin, magenta in E′). F, LCN6 neurons arborize in lobula layers Lo3, 4 and 5 (white arrowheads) and project towards the central brain (blue arrowhead,). G, slp>FLEXAMP clones (green). Class 4 Toy/D neurons (yellow) are Lccn2a,b neurons that connect the lobula plate (white arrowheads) with the lobula (red arrowheads) and the central brain (blue arrowhead). H, Neuronal subtypes produced by the tOPC (M)=Medulla, (Lo)=Lobula, (Lop)=Lobula plate, (CB)=Central Brain. See also Figure S7.
Figure 7
Figure 7. Summary of tOPC neurogenesis
The Dll, Ey, Slp and D time windows produce distinct neuronal subtypes, each localized to a specific area of the optic lobes.

References

    1. Baumgardt M, Karlsson D, Terriente J, Diaz-Benjumea FJ, Thor S. Neuronal subtype specification within a lineage by opposing temporal feed-forward loops. Cell. 2009;139:969–982. - PubMed
    1. Bello BC, Izergina N, Caussinus E, Reichert H. Amplification of neural stem cell proliferation by intermediate progenitor cells in Drosophila brain development. Neural development. 2008;3:5. - PMC - PubMed
    1. Boone JQ, Doe CQ. Identification of Drosophila type II neuroblast lineages containing transit amplifying ganglion mother cells. Developmental neurobiology. 2008;68:1185–1195. - PMC - PubMed
    1. Brody T, Odenwald WF. Programmed transformations in neuroblast gene expression during Drosophila CNS lineage development. Developmental biology. 2000;226:34–44. - PubMed
    1. Buescher M, Yeo SL, Udolph G, Zavortink M, Yang X, Tear G, Chia W. Binary sibling neuronal cell fate decisions in the Drosophila embryonic central nervous system are nonstochastic and require inscuteable-mediated asymmetry of ganglion mother cells. Genes & development. 1998;12:1858–1870. - PMC - PubMed

Publication types

MeSH terms

LinkOut - more resources