. 2014 Aug 29;3(9):850-60.
doi: 10.1242/bio.20147450.

The interaction between Shroom3 and Rho-kinase is required for neural tube morphogenesis in mice

Affiliations

The interaction between Shroom3 and Rho-kinase is required for neural tube morphogenesis in mice

Debamitra Das et al. Biol Open. .

Abstract

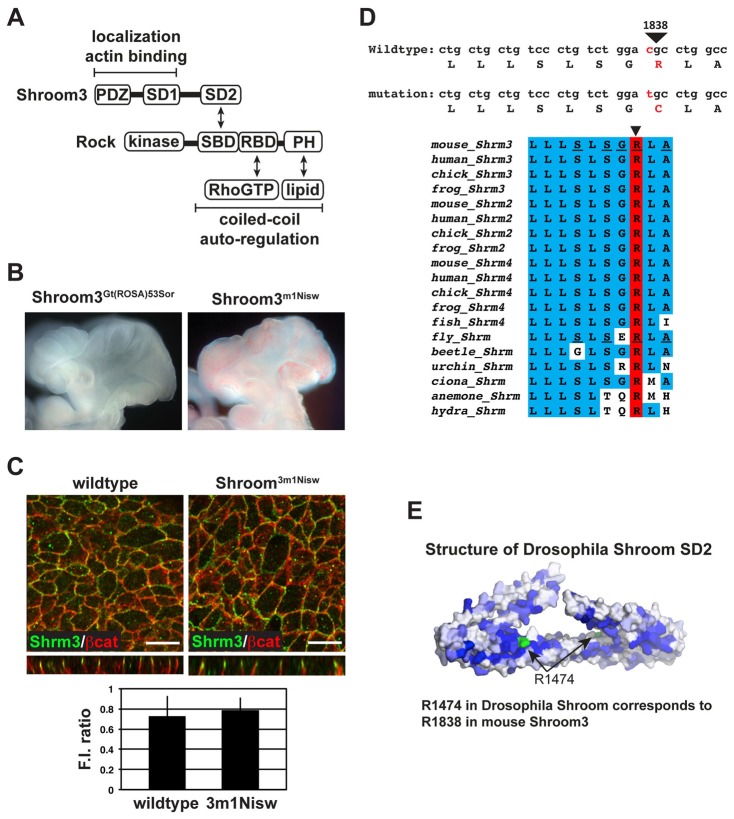
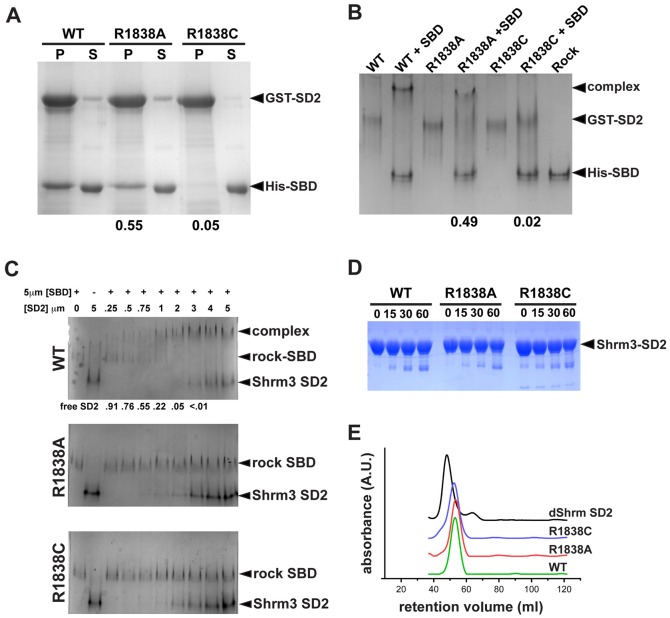
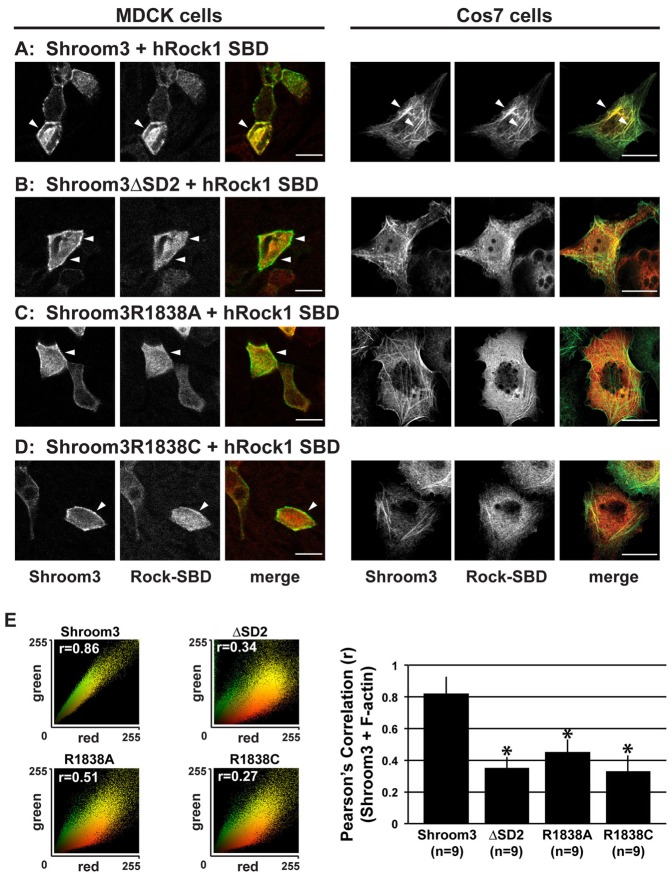
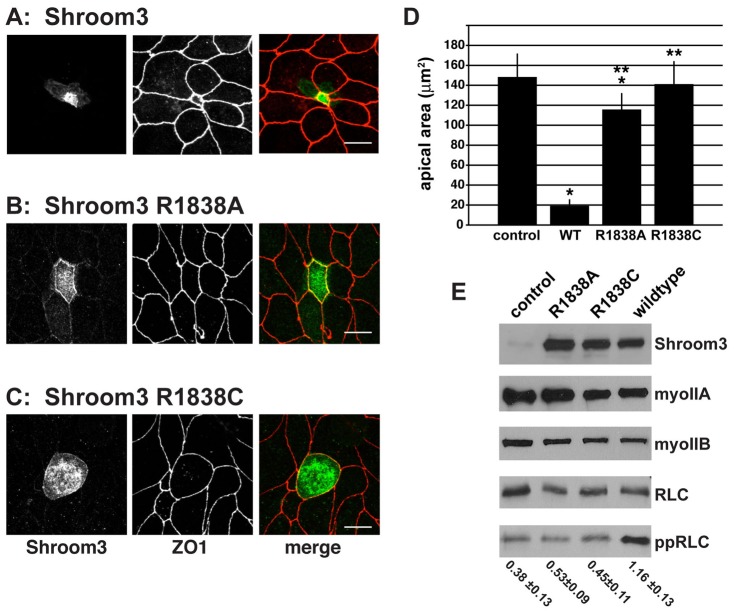
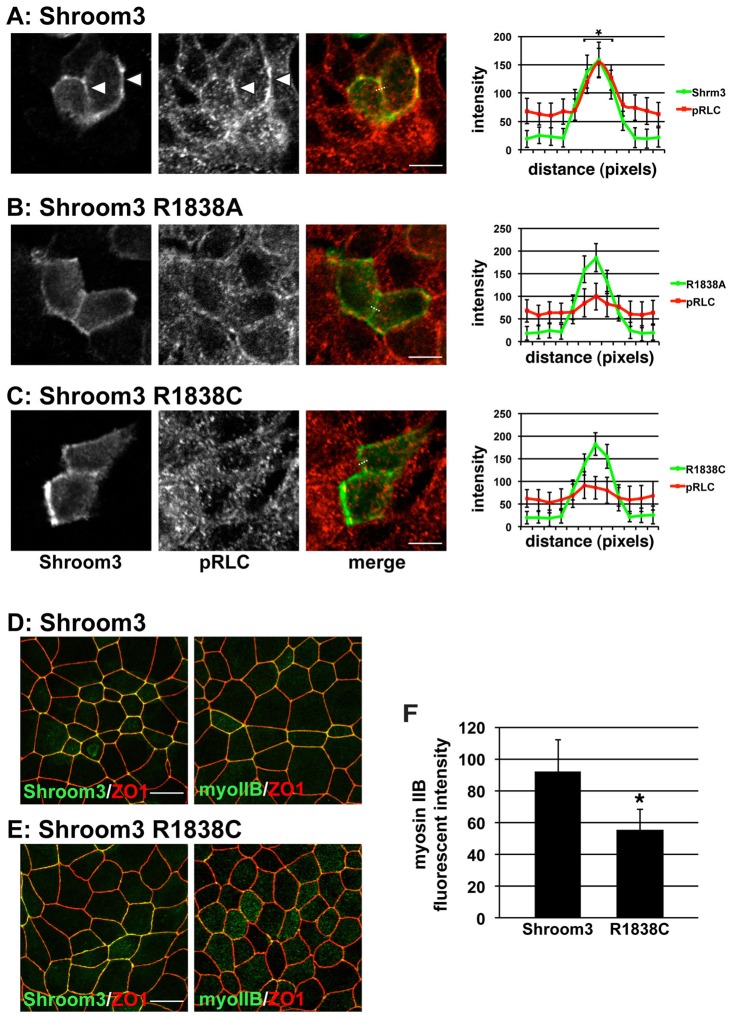
Shroom3 is an actin-associated regulator of cell morphology that is required for neural tube closure, formation of the lens placode, and gut morphogenesis in mice and has been linked to chronic kidney disease and directional heart looping in humans. Numerous studies have shown that Shroom3 likely regulates these developmental processes by directly binding to Rho-kinase and facilitating the assembly of apically positioned contractile actomyosin networks. We have characterized the molecular basis for the neural tube defects caused by an ENU-induced mutation that results in an arginine-to-cysteine amino acid substitution at position 1838 of mouse Shroom3. We show that this substitution has no effect on Shroom3 expression or localization but ablates Rock binding and renders Shroom3 non-functional for the ability to regulate cell morphology. Our results indicate that Rock is the major downstream effector of Shroom3 in the process of neural tube morphogenesis. Based on sequence conservation and biochemical analysis, we predict that the Shroom-Rock interaction is highly conserved across animal evolution and represents a signaling module that is utilized in a variety of biological processes.

Keywords: Rock; Shroom3; apical constriction; epithelial; neural tube.


Conflict of interest statement

Competing interests: The authors have no competing interests to declare.

Figures

Fig. 1.
Fig. 1.. Arginine 1838 of Shroom3 is required for neural tube closure in mice but does not regulate protein expression or localization.
(A) Schematic of the Shroom3-Rock signaling module. Arrows denote known direct interactions. SD, Shroom domain; PDZ, Psd-95/DlgA/ZO1 domain;. SBD, Shroom Binding domain of Rock; RBD, Rho binding domain; PH, pleckstrin homology domain. (B) Embryos homozygous for the Shroom3 null allele Shroom3Gt(ROSA)53Sor or the ENU allele Shroom3m1Nisw exhibit the same phenotype. (C) Expression of the Shroom3 R1838C protein. Wildtype or Shroom3m1Nisw homozygous e9.5 embryos were isolated, bisected sagittally to exposed the neural epithelium, stained in wholemount to detect Shroom3 (green) and β-catenin (red), and visualized by confocal microscopy. Z-projections are shown beneath; scale bar, 10 µm. Graph represents quantification of Shroom3 expression. Fluorescent intensity (F.I.) of Shroom3, expressed as the ratio of the average Shroom3 fluorescent intensity relative to the fluorescent intensity of β-catenin, from wildtype or Shroom3m1Nisw homozygous mutants. Error bars represent ± s.d., values are not significantly different using an unpaired t-test, n≥60 cells in two embryos per genotype; scale bar equals 10 µm. (D) The Shroom3m1Nisw mutation results in the substitution of a cysteine for a highly conserved arginine. Top panel shows the mutation while the bottom panel shows the sequence conservation of the SD2 in the vicinity of arginine 1838. Underlined amino acids constitute part of a conserved patch required for binding to Rock (Mohan et al., 2012). (E) Surface view of the Drosophila Shroom SD2 dimer as previous determined (Mohan et al., 2012) with the conserved arginine (R1474) residue in each monomer highlighted in green.
Fig. 2.
Fig. 2.. Arginine 1838 is required for the interaction between Shroom3 and Rock.
(A) In vitro pull down assays using wild type and R1838 substitution variants of GST-Shroom3 SD2 (GST-SD2) bound to glutathione beads and His-tagged hRock SBD (His-SBD) in solution. The amount of Rock SBD in the pellet, relative to wild type, is indicated under the gel. (B) Gel mobility shift assay to detect the binding of GST-Shroom3 SD2 variants to the SBD of hRock1. Purified GST-Shroom3 SD2 and SBD proteins were mixed in solution, resolved on native PAGE gels, and detected by Coomassie Blue staining. The amount of complex formed relative to wild type is indicated beneath the gel. (C) Gel mobility shift assay to detect the interaction of untagged Shroom3 SD2 variants (Shroom3-SD2, amino acids 1642–1951) and untagged hRock1 SBD (Rock-SBD, amino acids 707–946). Increasing concentrations of SD2 proteins (indicated at top) were mixed with 5 µM SBD, resolved by native PAGE, and detected by Coomassie Blue staining. Values beneath the wild-type panel indicate the relative amount of free SBD. (D) Purified, untagged SD2 proteins were exposed to Subtilisin A for 0, 15, 30, or 60 minutes, resolved on SDS-PAGE gels, and stained with Coomassie Blue. (E) Size exclusion chromatography of purified, untagged Drosophila Shroom SD2 and the indicated mouse Shroom3 SD2 substitution variants.
Fig. 3.
Fig. 3.. Shroom3 R1838 mutants fail to co-localize with the Rock SBD in vivo.
(A–D) MDCK and Cos7 cells co-expressing the hRock1 SBD and either Shroom3 (A), Shroom3 ΔSD2 (B), Shroom3 R1838A (C) or Shroom3 R1838C (D) were grown on either transwell filters (MDCK cells) or fibronectin-coated coverslips (Cos7) and stained to detect Shroom3 (green) and the myc-tagged Rock SBD (red). Scale bar, 10 µm. (E) Quantification of colocalization. Left-hand panels are representative color scatter plots and indicate the degree of overlap between Shroom3 and the Rock-SBD with Pearson's correlation (r value) indicated in each scatter plot. Overlap was further quantified by plotting the average r (± s.d.) for the indicated number of cells in separate trials. * indicates p<0.01 using one-way ANOVA and Tukey HSD.
Fig. 4.
Fig. 4.. Shroom3 R1838 variants fail to induce apical constriction in MDCK cells.
(A–C) MDCK cells transiently expressing Shroom3 (A), Shroom3 R1838A (B), or Shroom3 R1838C (C) were grown overnight on transwell filters and stained to detect Shroom3 (green) and the tight junction marker ZO-1 (red). Scale bar, 10 µm. (D) Quantification of apical constriction. Apical area was determined by measuring the area encircled by ZO1 staining of cells expressing the indicated Shroom3 protein. Error bars represent ± s.d. for at least 30 cells picked at random from three independent experiments, * indicates p<0.001 relative to untransfected control cells, ** indicates p<0.001 relative to cells expressing wildtype Shroom3 as determined by one-way Anova and Tukey HSD. (E) Lysates from cells expressing the indicated Shroom3 variant were probed by Western blot to detect Shroom3, myosin IIa, myosin IIb, RLC, and ppRLC. Representative blot is shown for ppRLC, values beneath each lane represent the average ppRLC:RLC ratio for three experiments (± s.d.) based on band intensity.
Fig. 5.
Fig. 5.. Shroom3 R1838 substitution mutations do not activate myosin II.
(A–C) MDCK cells were transiently transfected with expression vectors for hRock1 and either Shroom3 (A), Shroom3 R1838A (B), or Shroom3 R1838C (C) and stained to detect Shroom3 (green) and phosphorylated RLC (pRLC, red). Right-hand panels show quantification of fluorescent intensity of Shroom3 (green) and pRLC (red) at the adherens junctions (arrowheads), as defined by Shroom3 staining. Dotted line denotes representative ROI used to measure fluorescent intensity; scale bar, 10 µm; * denotes significant differences (p<0.01 using an unpaired t-test) in pRLC fluorescence intensity in cells expressing wildtype Shroom3 relative to cells expressing either the R1838A or R1838C variant, n≧30 cells. (D,E) MDCK cells selected for expression of either Shroom3 or Shroom3 R1838C were stained to detect Shroom3 and ZO1 or myosin IIb and ZO1. Scale bar, 10 µm. (F) Quantification of myosin IIb localization in cells expressing Shroom3 or Shroom3 R1838C. Error bars indicate ± s.d., * indicates p<0.01 relative to Shroom3-expressing cells using an unpaired t-test, n≧30 cells in 3 experiments.

Similar articles

Cited by

References

    1. Allard J., Mogilner A. (2013). Traveling waves in actin dynamics and cell motility. Curr. Opin. Cell Biol. 25, 107–115 10.1016/j.ceb.2012.08.012 - DOI - PMC - PubMed
    1. Amano M., Chihara K., Nakamura N., Kaneko T., Matsuura Y., Kaibuchi K. (1999). The COOH terminus of Rho-kinase negatively regulates rho-kinase activity. J. Biol. Chem. 274, 32418–32424 10.1074/jbc.274.45.32418 - DOI - PubMed
    1. Araki S., Ito M., Kureishi Y., Feng J., Machida H., Isaka N., Amano M., Kaibuchi K., Hartshorne D. J., Nakano T. (2001). Arachidonic acid-induced Ca2+ sensitization of smooth muscle contraction through activation of Rho-kinase. Pflugers Arch. 441, 596–603 10.1007/s004240000462 - DOI - PubMed
    1. Assef Y. A., Ozu M., Marino G. I., Galizia L., Kotsias B. A. (2011). ENaC channels in oocytes from Xenopus laevis and their regulation by xShroom1 protein. Cell. Physiol. Biochem. 28, 259–266 10.1159/000331738 - DOI - PubMed
    1. Babbin B. A., Koch S., Bachar M., Conti M. A., Parkos C. A., Adelstein R. S., Nusrat A., Ivanov A. I. (2009). Non-muscle myosin IIA differentially regulates intestinal epithelial cell restitution and matrix invasion. Am. J. Pathol. 174, 436–448 10.2353/ajpath.2009.080171 - DOI - PMC - PubMed

LinkOut - more resources