. 2014 Aug 29:3:e03125.
doi: 10.7554/eLife.03125.

Ecology and evolution of viruses infecting uncultivated SUP05 bacteria as revealed by single-cell- and meta-genomics

Affiliations

Ecology and evolution of viruses infecting uncultivated SUP05 bacteria as revealed by single-cell- and meta-genomics

Simon Roux et al. Elife. .

Abstract

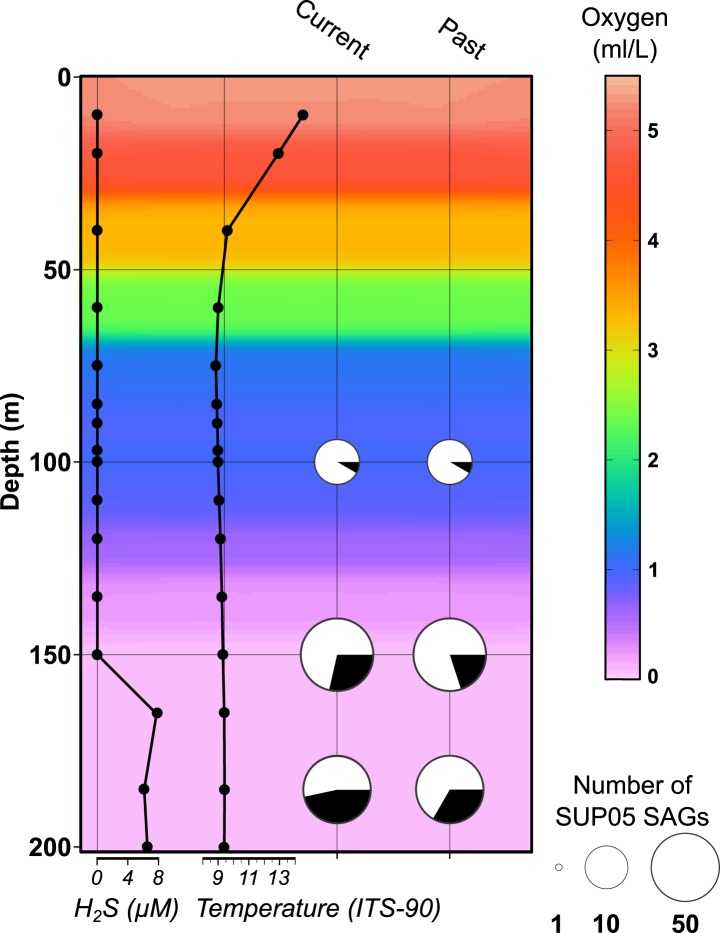
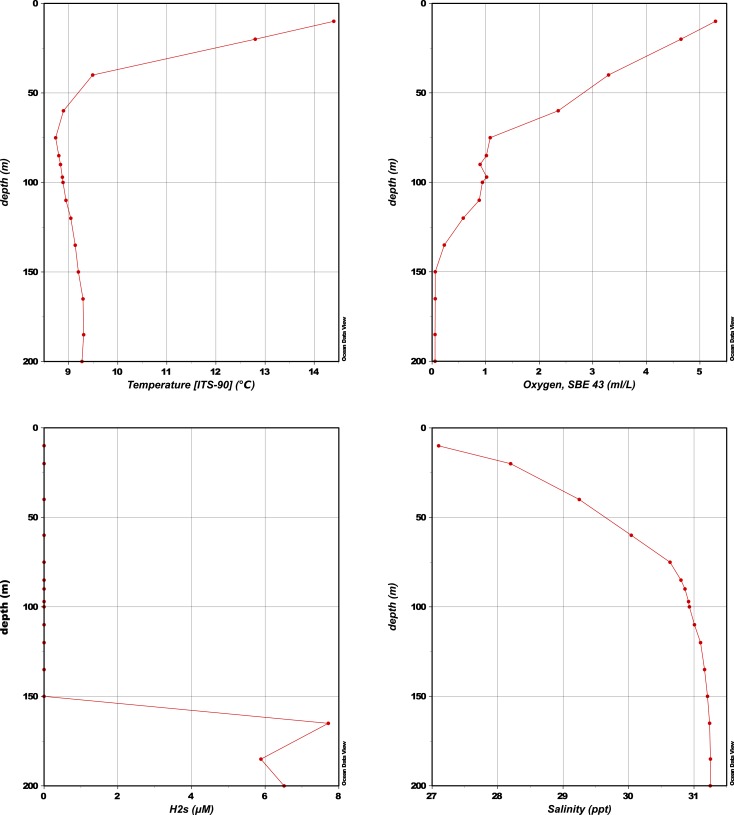
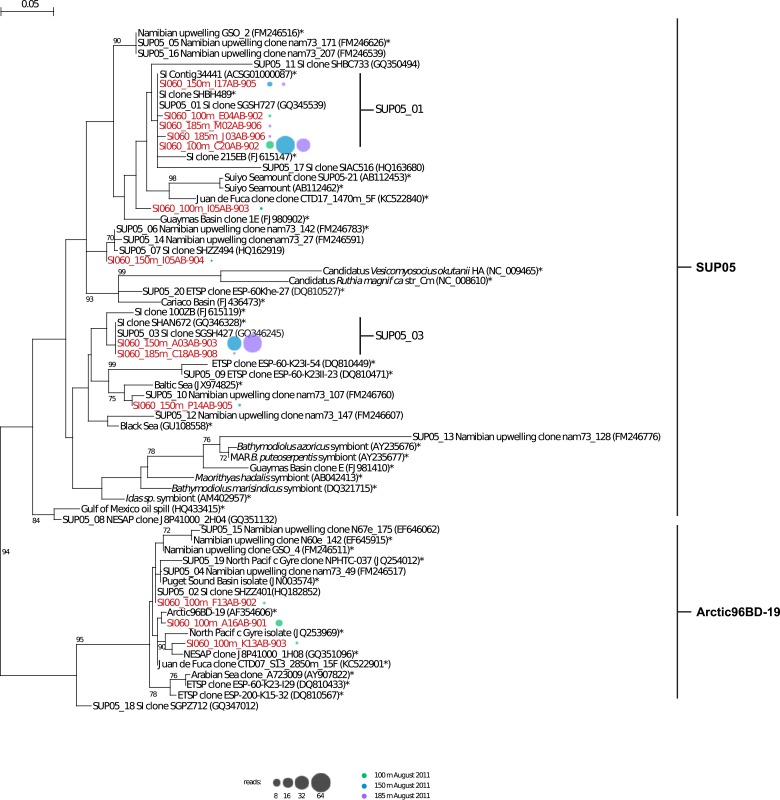
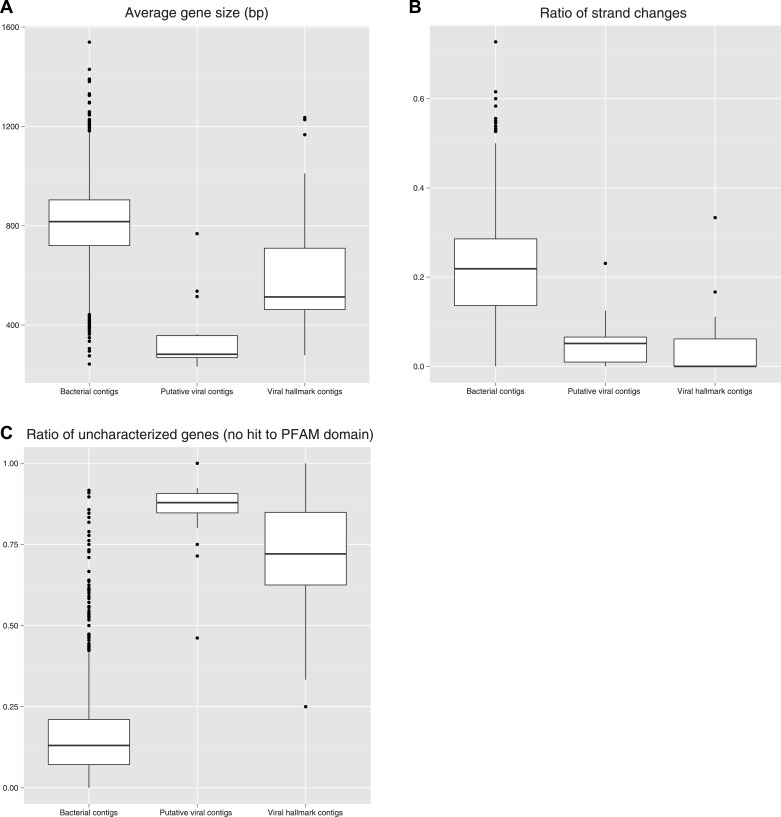
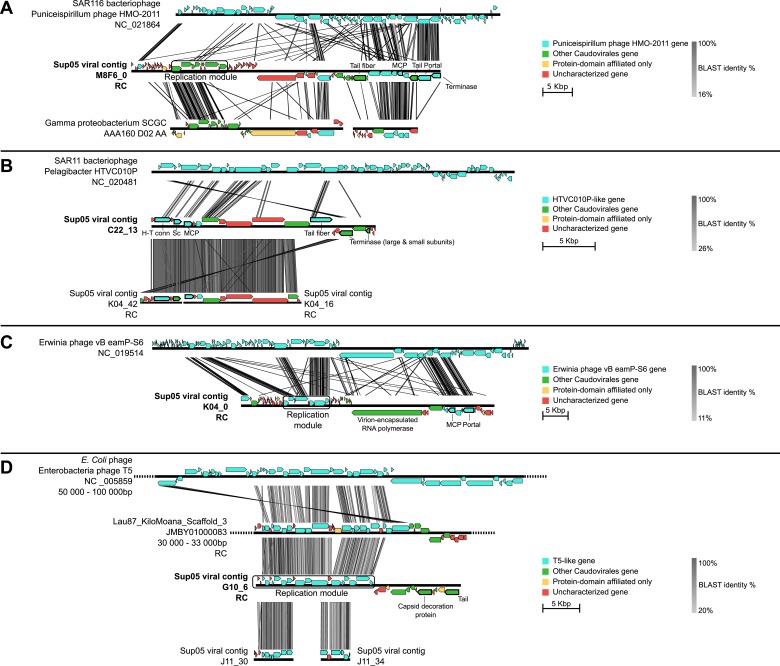
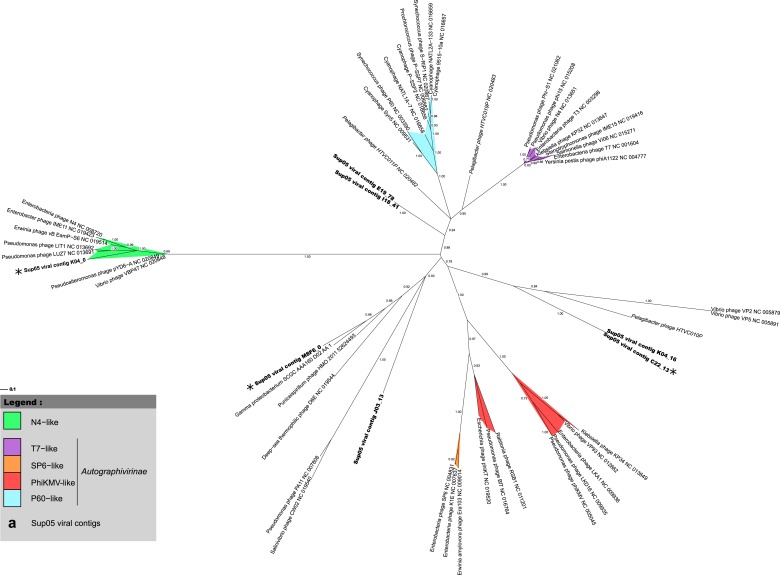
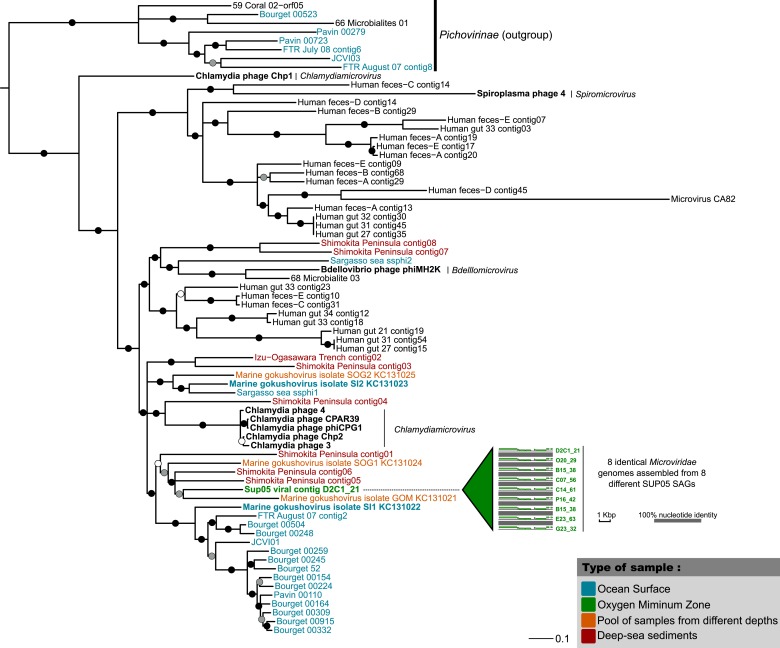
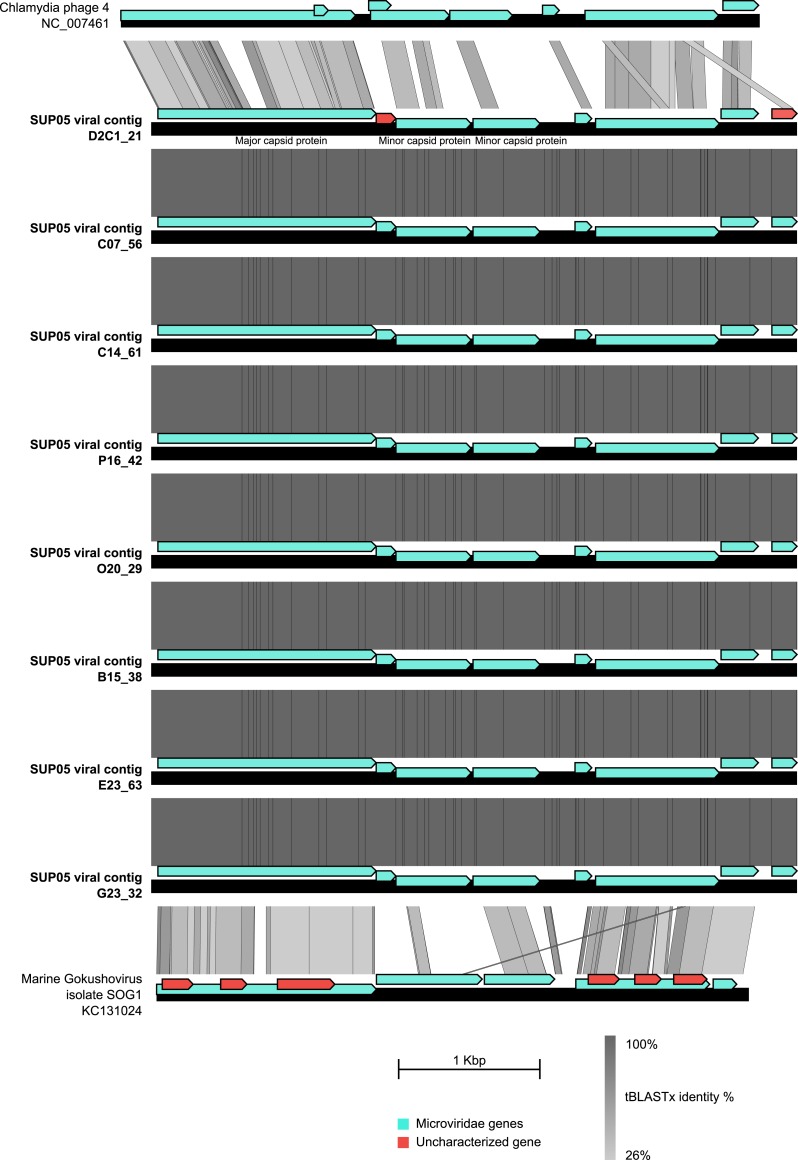
Viruses modulate microbial communities and alter ecosystem functions. However, due to cultivation bottlenecks, specific virus-host interaction dynamics remain cryptic. In this study, we examined 127 single-cell amplified genomes (SAGs) from uncultivated SUP05 bacteria isolated from a model marine oxygen minimum zone (OMZ) to identify 69 viral contigs representing five new genera within dsDNA Caudovirales and ssDNA Microviridae. Infection frequencies suggest that ∼1/3 of SUP05 bacteria is viral-infected, with higher infection frequency where oxygen-deficiency was most severe. Observed Microviridae clonality suggests recovery of bloom-terminating viruses, while systematic co-infection between dsDNA and ssDNA viruses posits previously unrecognized cooperation modes. Analyses of 186 microbial and viral metagenomes revealed that SUP05 viruses persisted for years, but remained endemic to the OMZ. Finally, identification of virus-encoded dissimilatory sulfite reductase suggests SUP05 viruses reprogram their host's energy metabolism. Together, these results demonstrate closely coupled SUP05 virus-host co-evolutionary dynamics with the potential to modulate biogeochemical cycling in climate-critical and expanding OMZs.

Keywords: SUP05; bacteriophages; ecology; infectious disease; microbiology; oxygen minimum zone; single cell genomics; viral dark matter; viruses.


Conflict of interest statement

The authors declare that no competing interests exist.

Figures

Figure 1.
Figure 1.. Saanich Inlet water column characteristics and SUP05 infection frequency on the SAG sampling date (August 2011).
Key abiotic measurements are represented as background coloring (oxygen levels) and black lined graphs at left (hydrogen sulfide and temperature). SUP05 viral infections determined from 127 SAGs are indicated at right by black slices in pie charts where current infections were delineated from intact viral contigs and past infections were inferred from identification of defective prophages and CRISPR loci. DOI: http://dx.doi.org/10.7554/eLife.03125.003
Figure 1—figure supplement 1.
Figure 1—figure supplement 1.. CTD measurements of oxygen concentration, temperature, salinity, and H2S concentration in the water column of Saanich Inlet at the time of sampling (August 2011).
DOI: http://dx.doi.org/10.7554/eLife.03125.005
Figure 1—figure supplement 2.
Figure 1—figure supplement 2.. Phylogenetic tree of SUP05 and Arctic96BD-19 lineages based on comparative SSU ribosomal RNA gene analysis.
The tree was inferred using maximum-likelihood implemented in PHYML. The percentage (≥70%) of replicates in which the associated taxa clustered together in the bootstrap test (1000 replicates) is shown next to the branches. Reference sequences for both lineages are marked with a star. Representative sequences for SUP05 and Arctic96BD-19 clusters are labeled ‘SUP05_cluster number’ followed by the name of the sequence according to NCBI. SAG representative sequences are shown in red, SAG sequences distribution with depth is represented by colored circles (100 m: green, 150 m: blue, 200 m: purple) whose circumference indicated the total number of SAG sequences (reads) within the cluster. DOI: http://dx.doi.org/10.7554/eLife.03125.006
Figure 1—figure supplement 3.
Figure 1—figure supplement 3.. Metrics measured on SUP05 SAG contigs classified as ‘Microbial’, ‘Viral hallmark contigs’ (Supplementary file 1 A, B, C) and ‘Putative viral contigs’ (Supplementary file 1 D).
For each set of contigs, the distribution of average gene size (A), ratio of strand changes (number of strand changes between two consecutive genes divided by the total number of genes on the contig, B), and ratio of uncharacterized genes (number of genes with no significant hit in PFAM database divided by the total number of genes on the contig, C) are displayed. DOI: http://dx.doi.org/10.7554/eLife.03125.007
Figure 2.
Figure 2.. Genetic map and synteny plots for the four references SUP05 Caudovirales contigs M8F6_0 (A), C22_13 (B), K04_0 (C) and G10_6 (D) (highlighted in bold).
Viral hallmark genes are underlined and identified on plots (MCP: major capsid protein, Sc: scaffolding protein, H-T conn.: head-tail connector). Sequence similarities were deduced from a tBLASTx comparison. For clarity sake, several sequences including SUP05 viral contig M8F6_0, K04_0, and G10_6 are reverse-complemented (noted RC). DOI: http://dx.doi.org/10.7554/eLife.03125.008
Figure 2—figure supplement 1.
Figure 2—figure supplement 1.. Phylogenetic tree of SUP05 Podoviridae contigs, derived from major capsid protein sequences with PhyML (maximum-likelihood tree, LG model, CAT approximation of gamma parameter).
All SUP05 contigs affiliated to the Podoviridae and harboring the major capsid protein gene are included in the tree and highlighted in bold. The three SUP05 Podoviridae reference contigs (longer than 15 kb) are noted with a star. SH-like branch supports are indicated on the tree, and all branches with a support lower than 0.5 were collapsed. DOI: http://dx.doi.org/10.7554/eLife.03125.010
Figure 2—figure supplement 2.
Figure 2—figure supplement 2.. Phylogenetic tree for the SUP05 Microviridae (major capsid protein).
Tree was computed with PhyML (maximum-likelihood tree, LG model, gamma parameter estimated with CAT approximation), and SH-like supports are indicated for each branch. All branches with support lower than 0.50 were collapsed. The tree is focused around the Gokushovirinae subfamily and includes the Pichovirinae subfamily as an outgroup. Aquatic Gokushovirinae are colored according to their type of sample, and Saanich Inlet sequences are highlighted in bold. Cultivated Gokushovirinae are noted in black and highlighted in bold, with the associated genus associated in italic. All the other sequences are non-cultivated and currently affiliated to ‘Unclassified Gokushovirinae’. DOI: http://dx.doi.org/10.7554/eLife.03125.011
Figure 2—figure supplement 3.
Figure 2—figure supplement 3.. Genetic map and synteny plots for the SUP05 Microviridae reference.
Viral hallmark genes are labeled on the plot. Associated sequence ‘Marine Gokushovirus isolate SOG1-KC131024’ was sampled from Strait of Georgia (Labonté and Suttle 2013b), on which the Saanich Inlet fjord is opening. DOI: http://dx.doi.org/10.7554/eLife.03125.012
Figure 3.
Figure 3.. Spatiotemporal dynamics of SUP05 viral reference genomes in Saanich Inlet.
(A) SUP05 viral presence in Saanich Inlet microbial metagenomes with OMZ sample names bolded. Four categories indicate the SUP05 virus was detected (>75% of viral genes detected at >80% amino-acid identity; light blue), a SUP05 viral relative was detected (>75% of viral genes detected at 60–80% amino-acid identity; light green), no SUP05 virus was detected (red) or detection was inconclusive (e.g., Microviridae in HiSeq Illumina data sets that strongly select against ssDNA sequences; gray). (B) SUP05 viral reference genomes had differing sequence conservation among recruited metagenomic reads. Upper and lower ‘hinges’ correspond to the first and third quartiles (the 25th and 75th percentiles), while outliers are displayed as points (values beyond 1.5 * Inter-Quartile Range of the hinge). (C) One SUP05 viral reference genome with low sequence conservation revealed evolution in action whereby a genomic region (see ∼21–30 kb) appears to sweep through the population. DOI: http://dx.doi.org/10.7554/eLife.03125.013
Figure 3—figure supplement 1.
Figure 3—figure supplement 1.. Recruitment and coverage plot of SUP05 viral genome fragments by Saanich Inlet datasets sampled in 2009, 2010, and 2011.
Each dot correspond to a match between a metagenome predicted gene and a gene from the SUP05 viral genome fragment, displayed according to the coordinate on the genome (x-axis) and the protein identity percentage (y-axis). For each genome, plots were only generated for data sets in which the genome was detected. Only hits with more than 80% amino-acid identity were considered. DOI: http://dx.doi.org/10.7554/eLife.03125.014
Figure 3—figure supplement 2.
Figure 3—figure supplement 2.. Heatmap of detection of SUP05 viruses in oceanic data sets.
Metagenomes are classified from left to right based on the sampling depth as ‘Above the OMZ’, ‘OMZ’, and ‘Below the OMZ’, and vertically ordered based on the geographical sampling region, from the samples closest to Saanich Inlet (on top) to the one farthest from Saanich Inlet (at the bottom). Viral metagenomes are noted with a gray capsid symbol. Each metagenome—viral genome association was classified based on the number of viral genes detected and the amino-acid percentage identity of the BLAST hits associated. The viral genome was thought to be in the sample when more than 75% of the genes were detected at more than 80% of identity in the metagenome (blue cells), when the same ratio of genes detected at lower percentage (60–80%) indicates the presence of a related but distinct virus (green cells). We considered that less than 75% of the genes detected meant that this virus was likely absent from the sample (red cells), except for the detection of the ssDNA Microviridae in HiSeq-Illumina-sequenced viromes, where the procedure used to process samples prior to sequencing is likely to select against the amplification of ssDNA templates (gray cells). Metagenomes in which the associated SUP05 host was detected are highlighted in black (>75% genes on SAG microbial contigs covered with Average Nucleotide Identity > 95%). DOI: http://dx.doi.org/10.7554/eLife.03125.015
Figure 3—figure supplement 3.
Figure 3—figure supplement 3.. Recruitment and coverage plot of SUP05 viral genomes by data sets sampled outside of Saanich Inlet fjord.
Each dot correspond to a match between a metagenome predicted gene and a gene from the SUP05 viral genome fragment, displayed according to the coordinate on the genome (x-axis) and the protein identity percentage (y-axis). For each genome, plots were only generated for data sets in which the genome was detected. Only hits with more than 80% amino-acid identity were considered. DOI: http://dx.doi.org/10.7554/eLife.03125.016
Figure 4.
Figure 4.. Uncultivated SUP05 lineage-specific virus–host ecology.
Fragment recruitment from Saanich Inlet microbial metagenomes to microbial (95% nucleotide identity) and viral (100% amino-acid identity) reference contigs normalized by contig and metagenome size was used as a proxy for abundance. Hence, the relative abundance of microbial and viral genome is indicated as number of metagenomic bases recruited by contig(s) base pairs (bp) by megabase (Mb) of metagenome. Upper and lower ‘hinges’ of the relative abundance distribution correspond to the first and third quartiles (the 25th and 75th percentiles), while outliers are displayed as points (values beyond 1.5 * Inter-Quartile Range of the hinge). A virus-to-host ratio was then calculated for each SAG (i.e., each virus-host pair) as the ratio of relative abundance of viral contigs to the relative abundance of microbial contigs from the same SAG. DOI: http://dx.doi.org/10.7554/eLife.03125.017
Figure 5.
Figure 5.. Maps of DsrC-containing contigs.
(A) Seven contigs including dsrC-like gene detected as viral based on non-reference metrics (ratio of uncharacterized genes, strand coding bias). (B) Genomic context in which dsrC-like genes are retrieved in SUP05 microbial contigs from SAG. All contigs above 50 kb containing a dsrC-like gene were selected and compared to get a summary of the different regions in which dsrC-like genes are found in SUP05 genomes. (C) Map of dsrC-containing Contigs assembled from Saanich Inlet metagenomes. One viral-like contig from SAG (020_11) is included for comparison. DOI: http://dx.doi.org/10.7554/eLife.03125.018
Figure 5—figure supplement 1.
Figure 5—figure supplement 1.. Multiple alignment of dsrC-like genes from Saanich Inlet microbial and viral contigs, hydrothermal vent phages, and microbial genomes.
Viral sequences are highlighted in red, Saanich Inlet sequences in bold. Four groups could be distinguished within this set of sequences (dsrC_1 to 4). The main residues most likely needed for the protein to function as rDsrC are colored across all groups and indicated below the alignment. The specific insertion and second C-terminal cysteine, thought to be required for the dsrC function, and only retrieved in the group dsrC_2, are highlighted with a black frame. Other conserved residues are colored within each group, except for groups 3 and 4 where too few sequences are available. DOI: http://dx.doi.org/10.7554/eLife.03125.019
Figure 5—figure supplement 2.
Figure 5—figure supplement 2.. Relative abundance of viral dsrC gene on the 3 years of sampling in Saanich Inlet compared to the concentration of H2S (left) and O2 (right).
DOI: http://dx.doi.org/10.7554/eLife.03125.020

Comment in

  • Gene swapping in the dead zone.
    Petersen J, Dubilier N. Petersen J, et al. Elife. 2014 Oct 13;3:e04600. doi: 10.7554/eLife.04600. Elife. 2014. PMID: 25310237 Free PMC article.

Similar articles

Cited by

References

    1. Abedon ST. Advances in Applied Microbiology. 1st edition. Vol. 67. Elsevier; 2009. Phage evolution and ecology. - DOI - PubMed
    1. Abrescia NG, Bamford DH, Grimes JM, Stuart DI. Structure unifies the viral universe. Annual Review of Biochemistry. 2012;81:795–822. doi: 10.1146/annurev-biochem-060910-095130. - DOI - PubMed
    1. Akhter S, Aziz RK, Edwards RA. PhiSpy: a novel algorithm for finding prophages in bacterial genomes that combines similarity- and composition-based strategies. Nucleic Acids Research. 2012;40:1–13. doi: 10.1093/nar/gks406. - DOI - PMC - PubMed
    1. Allers E, Moraru C, Duhaime MB, Beneze E, Solonenko N, Canosa JB, Amann R, Sullivan MB. Single-cell and population level viral infection dynamics revealed by phageFISH, a method to visualize intracellular and free viruses. Environmental Microbiology. 2013;15:2306–2318. doi: 10.1111/1462-2920.12100. - DOI - PMC - PubMed
    1. Altschul SF, Madden TL, Schäffer AA, Zhang J, Zhang Z, Miller W, Lipman DJ. Gapped BLAST and PSI-BLAST: a new generation of protein database search programs. Nucleic Acids Research. 1997;25:3389–3402. doi: 10.1093/nar/25.17.3389. - DOI - PMC - PubMed

Publication types

MeSH terms