CD4+ T cells and CD40 participate in selection and homeostasis of peripheral B cells
- PMID: 25172502
- PMCID: PMC4170672
- DOI: 10.4049/jimmunol.1400798
CD4+ T cells and CD40 participate in selection and homeostasis of peripheral B cells
Abstract
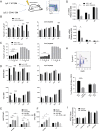
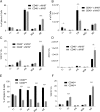
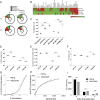
Control of peripheral B cell development and homeostasis depends critically on coordinate signals received through the BAFFRs and BCRs. The extent to which other signals contribute to this process, however, remains undefined. We present data indicating that CD4(+) T cells directly influence naive B cell development via CD40 signaling. Loss of CD4(+) T cells or CD40-CD40L interaction leads to reduced B cell homeostatic proliferation and hindered B cell reconstitution posttransplantation. Furthermore, we demonstrate that in the absence of CD40 signals, these events are modulated by BCR self-reactivity. Strikingly, murine models lacking CD40 reveal a broadly altered BCR specificity and limited diversity by both single-cell cloning and high-throughput sequencing techniques. Collectively, our results imply that any setting of T cell lymphopenia or reduced CD40 function, including B cell recovery following transplantation, will impact the naive B cell repertoire.
Copyright © 2014 by The American Association of Immunologists, Inc.
Figures


Similar articles
-
IL-21 and CD40L signals from autologous T cells can induce antigen-independent proliferation of CLL cells.Blood. 2013 Oct 24;122(17):3010-9. doi: 10.1182/blood-2012-11-467670. Epub 2013 Sep 6. Blood. 2013. PMID: 24014238
-
CD40 signaling replaces CD4+ lymphocytes and its blocking prevents chronic rejection of heart transplants.J Immunol. 2000 Dec 15;165(12):7316-22. doi: 10.4049/jimmunol.165.12.7316. J Immunol. 2000. PMID: 11120867
-
Cutting edge: CD40 engagement eliminates the need for Bruton's tyrosine kinase in B cell receptor signaling for NF-kappa B.J Immunol. 2003 Mar 15;170(6):2806-10. doi: 10.4049/jimmunol.170.6.2806. J Immunol. 2003. PMID: 12626529
-
The role of CD40 ligand in costimulation and T-cell activation.Immunol Rev. 1996 Oct;153:85-106. doi: 10.1111/j.1600-065x.1996.tb00921.x. Immunol Rev. 1996. PMID: 9010720 Review.
-
Functions of CD40 and Its Ligand, gp39 (CD40L).Crit Rev Immunol. 2017;37(2-6):371-420. doi: 10.1615/CritRevImmunol.v37.i2-6.100. Crit Rev Immunol. 2017. PMID: 29773027 Review.
Cited by
-
Altered BCR and TLR signals promote enhanced positive selection of autoreactive transitional B cells in Wiskott-Aldrich syndrome.J Exp Med. 2015 Sep 21;212(10):1663-77. doi: 10.1084/jem.20150585. Epub 2015 Sep 14. J Exp Med. 2015. PMID: 26371186 Free PMC article.
-
Altered B cell signalling in autoimmunity.Nat Rev Immunol. 2017 Jul;17(7):421-436. doi: 10.1038/nri.2017.24. Epub 2017 Apr 10. Nat Rev Immunol. 2017. PMID: 28393923 Free PMC article. Review.
-
αv Integrins regulate germinal center B cell responses through noncanonical autophagy.J Clin Invest. 2018 Aug 31;128(9):4163-4178. doi: 10.1172/JCI99597. Epub 2018 Aug 20. J Clin Invest. 2018. PMID: 29999501 Free PMC article.
-
Activated interleukin-7 receptor signaling drives B-cell acute lymphoblastic leukemia in mice.Leukemia. 2022 Jan;36(1):42-57. doi: 10.1038/s41375-021-01326-x. Epub 2021 Jun 30. Leukemia. 2022. PMID: 34193976 Free PMC article.
-
T cell-B cell thymic cross-talk: maintenance and function of thymic B cells requires cognate CD40-CD40 ligand interaction.J Immunol. 2014 Dec 1;193(11):5534-44. doi: 10.4049/jimmunol.1401655. Epub 2014 Oct 24. J Immunol. 2014. PMID: 25344473 Free PMC article.
References
-
- Murphy K., Travers P., Walport M.. 2008. Janeway's Immunobiology. Garland Science and Taylor & Francis Group, LLC, New York
-
- Allman D. M., Ferguson S. E., Lentz V. M., Cancro M. P.. 1993. Peripheral B cell maturation. II. Heat-stable antigenhi splenic B cells are an immature developmental intermediate in the production of long-lived marrow-derived B cells. J. Immunol. 151: 4431–4444 - PubMed
-
- Rolink A. G., Andersson J., Melchers F.. 1998. Characterization of immature B cells by a novel monoclonal antibody, by turnover and by mitogen reactivity. Eur. J. Immunol. 28: 3738–3748 - PubMed
Publication types
MeSH terms
Substances
Grants and funding
LinkOut - more resources
Full Text Sources
Other Literature Sources
Research Materials

