. 2014 Nov;13(11):1393-402.
doi: 10.1128/EC.00161-14. Epub 2014 Aug 29.

Sequential logic of polarity determination during the haploid-to-diploid transition in Saccharomyces cerevisiae

Affiliations

Sequential logic of polarity determination during the haploid-to-diploid transition in Saccharomyces cerevisiae

Serendipity Zapanta Rinonos et al. Eukaryot Cell. 2014 Nov.

Abstract

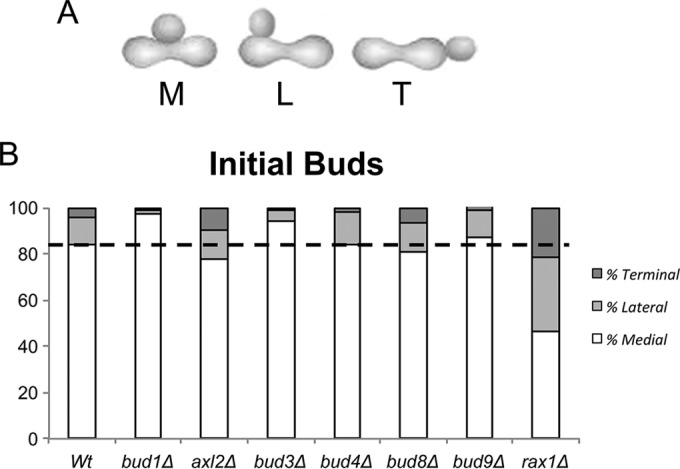
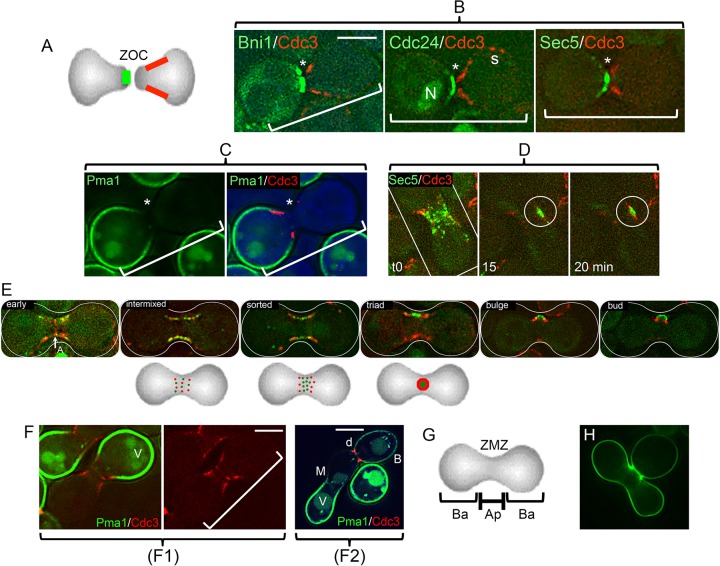
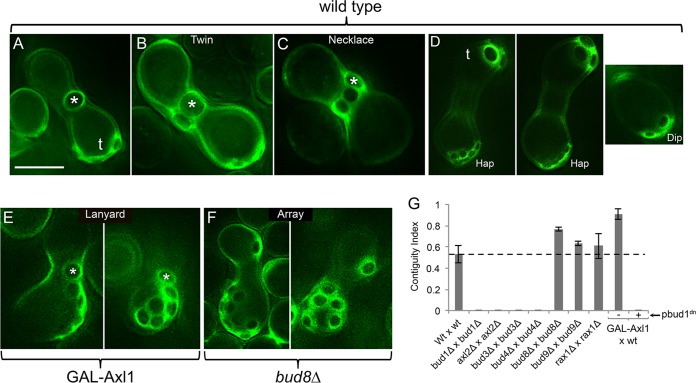
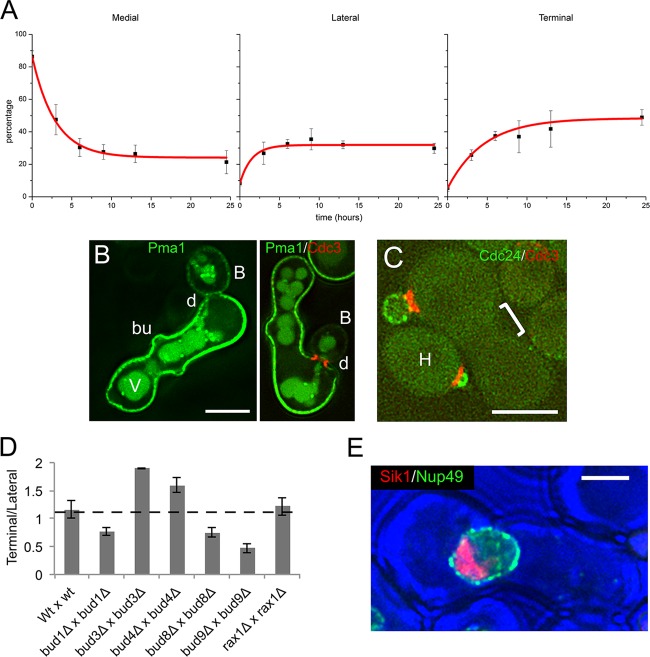
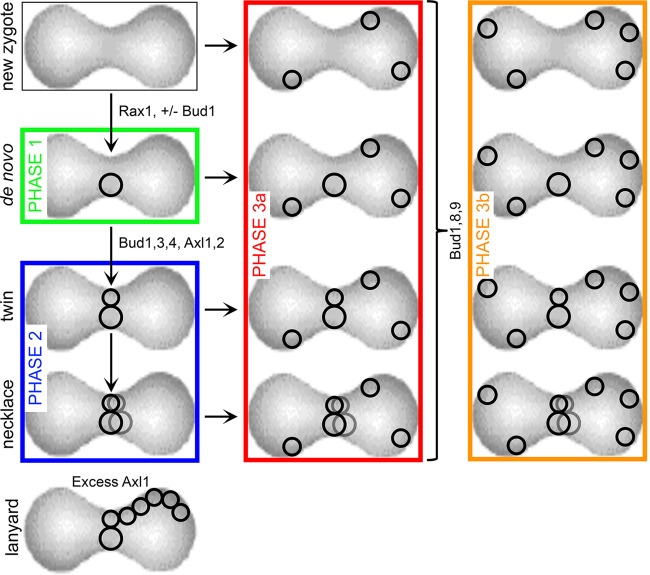
In many organisms, the geometry of encounter of haploid germ cells is arbitrary. In Saccharomyces cerevisiae, the resulting zygotes have been seen to bud asymmetrically in several directions as they produce diploid progeny. What mechanisms account for the choice of direction, and do the mechanisms directing polarity change over time? Distinct subgroups of cortical "landmark" proteins guide budding by haploid versus diploid cells, both of which require the Bud1/Rsr1 GTPase to link landmarks to actin. We observed that as mating pairs of haploid cells form zygotes, bud site specification progresses through three phases. The first phase follows disassembly and limited scattering of proteins that concentrated at the zone of cell contact, followed by their reassembly to produce a large medial bud. Bud1 is not required for medial placement of the initial bud. The second phase produces a contiguous bud(s) and depends on axial landmarks. As the titer of the Axl1 landmark diminishes, the third phase ultimately redirects budding toward terminal sites and is promoted by bipolar landmarks. Thus, following the initial random encounter that specifies medial budding, sequential spatial choices are orchestrated by the titer of a single cortical determinant that determines whether successive buds will be contiguous to their predecessors.


Figures

FIG 1
FIG 1
Sites of bud emergence. (A) Zygotes can bud either from the midzone (medial [M]), along the flanking surfaces (lateral [L]), or toward their ends (terminal [T]). The sum of L and T is referred to as “nonmedial.” (B) Landmarks needed for initial bud site specification. Homotypic crosses were conducted, fixed, and counted. Averages of the bud distributions (medial, lateral, and terminal) from at least three independent experiments are plotted in each case. The dashed horizontal line indicates the control value for medial budding as a point of reference. Quantitation is given in Table S2 in the supplemental material. Note that most budding is medial unless Rax1 has been deleted. (We were unable to examine axl1Δ crosses because Axl1 is required for mating. Since rax2Δ strains are prohibitively petite and therefore likely to be genetically unstable, we have not explored the possible significance of the protein.)
FIG 2
FIG 2
Initial bud formation and reorganization of proteins from the ZOC. (A) Diagram of typical apical and basal protein distributions. The two opposed cells have established a ZOC. They have not yet fused. Selected cortical proteins assume highly polarized distributions at this point. Two distributions are indicated: apical (green) and a subapical “collar” (red). Proteins implicated in membrane fusion, actin polarization, and secretion are in the apical group (panel B; see Fig. S2A in the supplemental material). Septins form the collar. A further group has a basal orientation (see below). (B) Examples of distributions of GFP-tagged proteins that are adjacent to the ZOC (*). In each case, a cell expressing the tagged protein in question (the formin Bni1; the guanine exchange factor for Cdc42, Cdc24; or the exocyst protein Sec5) was crossed with a cell expressing a septin (Cdc3-mCherry). Note that the septin forms a collar subapical to the ZOC (35). The example for Cdc24-GFP—some of which is in the nucleus (N)—shows that septins can also persist at cortical sites (s) that mark sites of previous cytokinesis. The brackets mark the position and orientation of the apposed pairs of cells. The strains were ATY5176 (Bni1), ATY4980 (Cdc24), ATY4312 (Sec5), and ATY5545 (Cdc3). (See Fig. S1A in the supplemental material.) (C) Example of a protein that has a basal distribution. A cell expressing both the GFP-tagged plasma membrane proton ATPase, Pma1, and the septin, Cdc3-mCherry, was crossed with a nonfluorescent cell. The left image shows only GFP. The right image shows both signals, as well as a bright-field image in blue. The strains were ATY5297 × ATY5545. (D) Scattering of an exocyst protein along the ZMZ cortex. Time lapse series of a cell expressing Sec5-GFP crossed with a cell expressing Cdc3-mCherry. Note that at time zero many foci of Sec5-GFP are beginning to be flanked by the septin. At the 15-min time point, Sec5-GFP forms a patch (circled) before completion of the septin ring to form a triad at 20 min. The strains were ATY4312 × ATY5545. (E) Stages of redistribution of the apical protein, Cdc24-GFP, and Cdc3-mCherry. After cell fusion, the nuclear pool of Cdc24-GFP vanishes, the septin annulus (A) is transiently visible, and Cdc3-mCherry and Cdc24-GFP resolve into foci that then scatter and intermix throughout the cortex of the ZMZ. Over the following 10 to 20 min, they sort so that the red foci (septin) progressively flank the green signal. This culminates in the formation of a characteristic “triad,” which subsequently bends and can be recognized as a small bud, which will further enlarge. The three diagrams beneath the micrographs illustrate the progressive morphogenesis that gives rise to the triad. To avoid photobleaching, a composite, not time lapse, series is shown. The strains were ATY4980 × ATY5545. (F) Domain separation persists after cell fusion. (F1) A cell expressing Pma1-GFP and Cdc3-mCherry was crossed with an unlabeled cell, and the two cells have fused. The red septin signal has redistributed symmetrically and shows initial stages of formation of the medial annulus. Note that septins continue to abut on Pma1-GFP, which does not invade the ZMZ. For clarity, the right-hand image includes only the red. V, vacuole. The strains were ATY5896 × ATY4373. (F2) Crosses were conducted between cells expressing Pma1-GFP and cells expressing Cdc3-mCherry. After 5 h, note the sharp discontinuity (d) of distribution of Pma1-GFP at the bud neck. Also note the lack of transfer beyond the ZMZ (M) of preexisting Pma1-GFP from the parent that contributed the lower-left portion of the zygote. B, bud. The strains were ATY5297 × ATY5545. (G) Diagram of apical (Ap) and basal (Ba) domains of early zygotes. The ZMZ is labeled. (H) Overview of the initial bud. Note the size of the nearly mature medial bud of this calcofluor white-stained zygote. It is not unusual to encounter initial buds that are even larger relative to the size of the body of the zygote. The calcofluor white signal is pseudocolored green. The strains were ATY3852 × ATY4373. Scale bars, 5 μm.
FIG 3
FIG 3
Localization of bud scars stained with calcofluor white. In each case, zygotes were formed over 5 h and then allowed to bud for an additional 15 h. The calcofluor white signal is pseudocolored green. (A) Note the large medial scar (*), as well as smaller terminal scars (t). The strains were ATY4307 × ATY4303. (B) Note the twin medial scars. The strains were ATY4307 × ATY4303. (C) Note the necklace of medial scars. As many as six encircling scars can be found. The strains were ATY4307 × ATY4303. (D) (Left two images) Size difference between the small preexisting contiguous haploid scars (Hap) and the terminal scars (t) formed by the zygote. (Right image) Diploid bud scars (Dip) imaged at the same magnification. The strains were ATY4307 × ATY4303. (E) Cross between a wt strain and a strain in which excess Axl1 can be induced. The cells were shifted from raffinose to galactose medium for 3 h before mixing. They were then crossed for 5 h and reincubated for 15 h in the presence of galactose. Note the lanyards that extend from the ZMZ. The strains were ATY3328 × ATY6125. (F) Cross between two strains that lack Bud8. Note the arrays of scars that lie adjacent to each other but are not generally contiguous. Comparable observations were made in crosses between strains that lack Bud9. The strains were ATY5884 × ATY6284. (G) Quantitation of contiguity. Pairs of cells were crossed for 5 h and reincubated for 15 h, as described in the text. The mating mixtures were then stained with calcofluor white and examined. To calculate the contiguity index, the number of zygotes that showed medial contiguity was divided by the total number of zygotes that had a medial scar. The penultimate bar describes a cross (in galactose) between a wt cell and a cell carrying galactose-inducible Axl1. The final bar pertains to a cross identical to wt × GAL-Axl1, with the inclusion of [pbud1dn] in both partners. The data are presented as averages ± standard deviations. The dashed horizontal line indicates the control value for medial budding. In comparison to the wild-type cross, the data for crosses of bud8Δ strains and bud9Δ strains and the GAL-Axl1 cross are significant, with P values of <0.05. The strains were wt × wt (ATY3207 × ATY4303), bud1Δ × bud1Δ (ATY402 × ATY4907), axl2Δ × axl2Δ (ATY5881 × ATY5860), bud3Δ × bud3Δ (ATY5882 × ATY5861), bud4Δ × bud4Δ (ATY5883 × ATY5862), bud8 Δ × bud8Δ (ATY5884 × ATY5863), bud9Δ × bud9Δ (ATY5885 × ATY5864), rax1Δ × rax1Δ (ATY5052 × ATY5477), wt × GAL-Axl1 (ATY3328 × ATY6125), and wt [pbud1dn] × GAL-Axl1 [pbud1dn] (ATY5056 × ATY6179). All crosses were in the presence of glucose, except for the last two, which were in galactose-inducing medium. Scale bar, 5 μm.
FIG 4
FIG 4
Impact of repeated budding. (A) Population-based time course of budding. After 4 h, crosses were transferred to doubly selective medium and then were sampled at a succession of time points before fixation and counting to tabulate the abundance of medial, lateral, and terminal buds. Note the progressive decline in the frequency of medial budding with time and the reciprocal increase in lateral and terminal buds. Shown are averages of three experiments ± SD. The strains were ATY4307 × ATY4303. (B) Shapes of zygotes and their buds. After allowing zygote formation for 5 h between cells that express Pma1-GFP and cells that express Cdc3-mCherry, the mating mixture was transferred to doubly selective medium for 15 h. A variety of unusually shaped zygotes is seen, often with a medial bulge (bu) or a terminal curve, as on the right. The discontinuity (d) of distribution of Pma1-GFP at the bud neck is evident. B, bud; V, vacuole. The strains were ATY5297 × ATY5545. (C) The zygote midzone after overnight culture. Crosses of cells expressing Cdc24-GFP and cells expressing Cdc3-mCherry were transferred to doubly selective medium after 5 h, cultured overnight, and then examined. Note that the midzone of the zygotes (bracket) shows no sign of persistence of the two labeled proteins. When no bud is present, Cdc24-GFP is not obviously localized. H, haploid. The strains were ATY5001 × ATY5545. (D) Lateral versus terminal distribution of bud scars. Isogenic pairs of cells were crossed for 5 h and then reincubated for 15 h before staining with calcofluor white to localize bud scars and calculate the ratio of terminal to lateral scars. The data are presented as averages ± standard deviations. The dashed horizontal line indicates the control value for medial budding. In comparison to the wild-type cross, the P values for the other crosses (bud1Δ, bud3Δ, bud4Δ, bud8Δ, and bud9Δ) are significant, with P values of <0.05. The strains were as in the legend to Fig. 3G. (E) Lack of disorganization of the nucleolus with age. In the illustrated zygote, one of the parental cells expresses a tagged nucleolar protein, Sik1-mRFP, and the tagged nucleoporin, Nup49-GFP. The cross was allowed to proceed for 5 h and was then cultured for an additional 15 h in medium that allows zygotes to bud but limits growth of the parental haploid cells. Note the compact appearance of the large nucleolus, as in our previous studies of initial budding (64). The strains were ATY4066 × ATY4373. Scale bars, 5 μm.
FIG 5
FIG 5
Model of sequential-budding options for zygotes. An unbudded zygote (new zygote) is at the upper left. (Phase 1) The first bud (de novo) is medial for ∼ 85% of zygotes. This step does not require Bud1. It becomes less frequent in the absence of Rax1. (Phase 2) After the initial medial bud—if Axl1 is still sufficiently abundant and the other axial landmarks are present—further contiguous budding occurs. These events generate the pattern labeled “twin” and, subsequently, that labeled “necklace.” Judging from the distribution of bud scars after overnight budding, 42% of the initial zygotes have a single medial bud, while 31% have twins and 13% have a necklace. In the presence of excess Axl1, contiguous chains of scars (lanyards) extend from the midzone along the lateral flank of the zygote (bottom left). (Phase 3) Regardless of whether medial buds are present, both lateral and terminal buds can emerge (3a). In the presence of Bud8 and Bud9, the relative amount of terminal budding increases (3b).

References

    1. Byers B, Goetsch L. 1974. Duplication of spindle plaques and integration of the yeast cell cycle. Cold Spring Harbor Symp. Quant. Biol. 38:123–131. 10.1101/SQB.1974.038.01.016. - DOI - PubMed
    1. Aufderheide KJ. 1975. Cytoplasmic inheritance in Saccharomyces cerevisiae: comparison of first zygotic budsite to mitochondrial inheritance patterns. Mol. Gen. Genet. 140:231–241. 10.1007/BF00334268. - DOI - PubMed
    1. Muller I. 1985. Parental age and the life-span of zygotes of Saccharomyces cerevisiae. Antonie Van Leeuwenhoek 51:1–10. 10.1007/BF00444223. - DOI - PubMed
    1. Birky CW., Jr 1978. Transmission genetics of mitochondria and chloroplasts. Annu. Rev. Genet. 12:471–512. 10.1146/annurev.ge.12.120178.002351. - DOI - PubMed
    1. Zernicka-Goetz M. 2005. Cleavage pattern and emerging asymmetry of the mouse embryo. Nat. Rev. Mol. Cell Biol. 6:919–928. 10.1038/nrm1782. - DOI - PubMed

Publication types

MeSH terms

LinkOut - more resources