. 2014 Nov 15;74(22):6419-29.
doi: 10.1158/0008-5472.CAN-13-3212. Epub 2014 Aug 29.

CXM: a new tool for mapping breast cancer risk in the tumor microenvironment

Affiliations

CXM: a new tool for mapping breast cancer risk in the tumor microenvironment

Michael J Flister et al. Cancer Res. .

Abstract

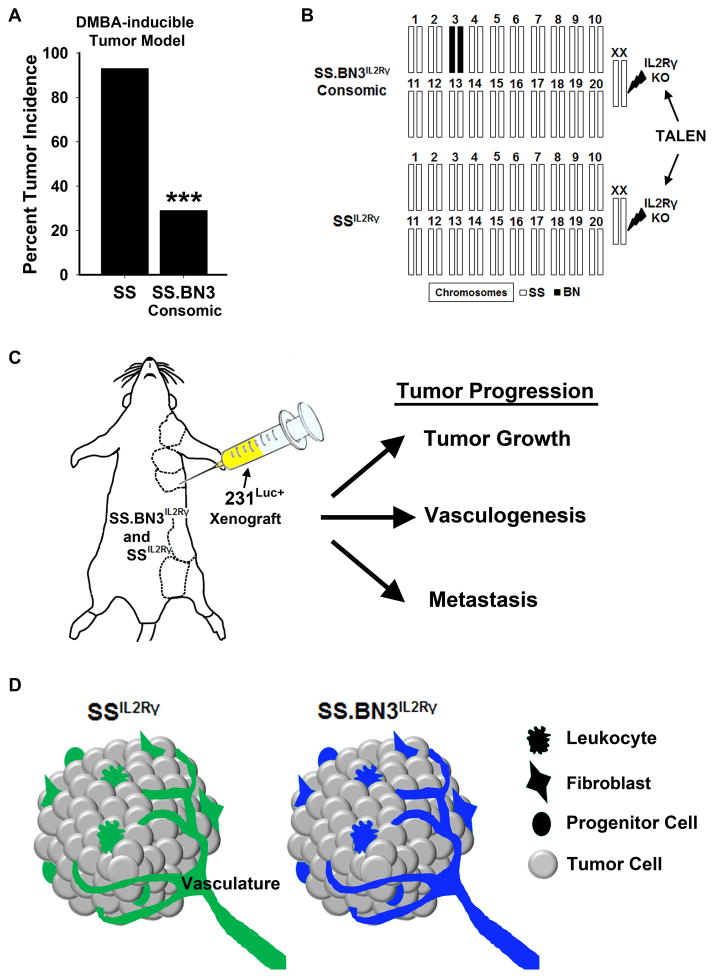
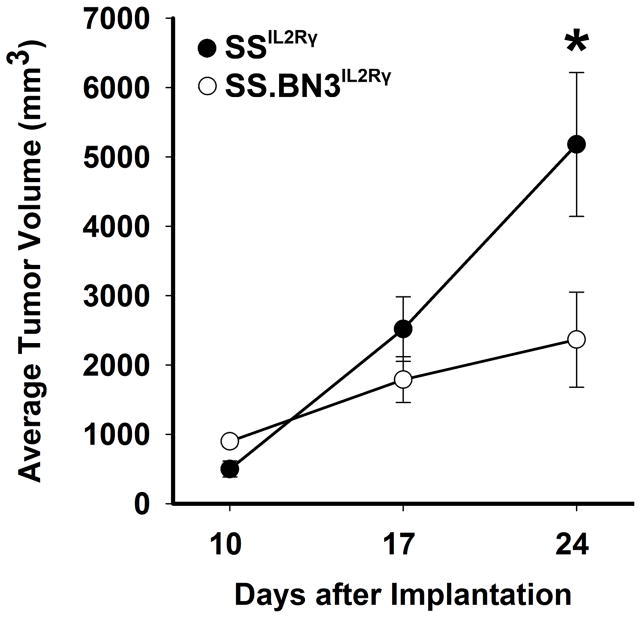
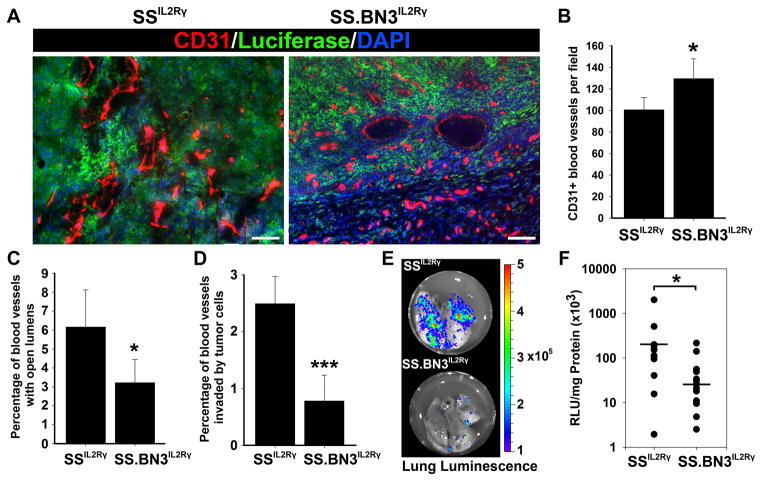
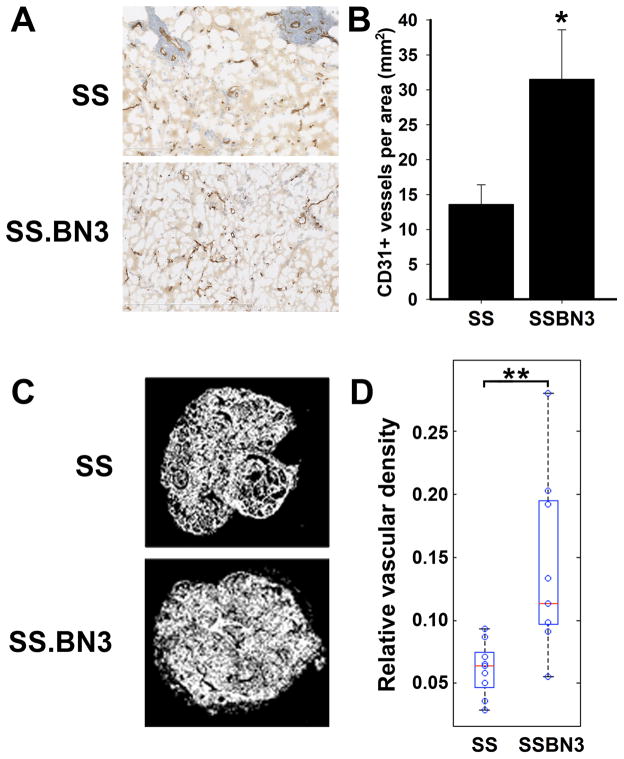
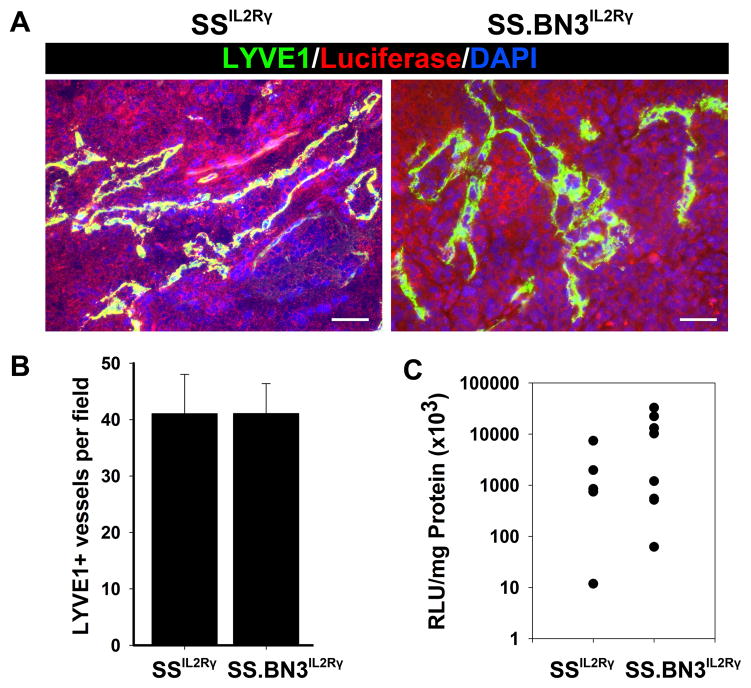
The majority of causative variants in familial breast cancer remain unknown. Of the known risk variants, most are tumor cell autonomous, and little attention has been paid yet to germline variants that may affect the tumor microenvironment. In this study, we developed a system called the Consomic Xenograft Model (CXM) to map germline variants that affect only the tumor microenvironment. In CXM, human breast cancer cells are orthotopically implanted into immunodeficient consomic strains and tumor metrics are quantified (e.g., growth, vasculogenesis, and metastasis). Because the strain backgrounds vary, whereas the malignant tumor cells do not, any observed changes in tumor progression are due to genetic differences in the nonmalignant microenvironment. Using CXM, we defined genetic variants on rat chromosome 3 that reduced relative tumor growth and hematogenous metastasis in the SS.BN3(IL2Rγ) consomic model compared with the SS(IL2Rγ) parental strain. Paradoxically, these effects occurred despite an increase in the density of tumor-associated blood vessels. In contrast, lymphatic vasculature and lymphogenous metastasis were unaffected by the SS.BN3(IL2Rγ) background. Through comparative mapping and whole-genome sequence analysis, we narrowed candidate variants on rat chromosome 3 to six genes with a priority for future analysis. Collectively, our results establish the utility of CXM to localize genetic variants affecting the tumor microenvironment that underlie differences in breast cancer risk.


Conflict of interest statement

Conflict of Interest: Recombinetics, Inc. is a leader in developing genetically modified livestock and has no commercial interest in the reported rat models that were generated as part of an academic collaboration. As such, the authors declare no financial conflict of interest.

Figures

Figure 1
Figure 1
Overview of the Consomic Xenograft Model (CXM). (A) Reduced susceptibility to mammary tumors (DMBA-induced) in SS.BN3 consomic rats (n = 14) compared with SS (n = 40), as reported previously by Adamovic et al (16). ***P<0.001 as determined by Fisher’s exact test using Bootstrap.(B) Schematic representation of the SS and SS.BN3 genomes that were modified by TALEN-mediated editing of the IL2Rγ gene. The numbered bars represent chromosomes that are derived from SS (white) or BN (black). Note that the only genetic differences between SSIL2Rγ and SS.BN3IL2Rγ are the inheritance of chromosome 3 from the SS or BN rats. (C) The transgenically labeled human 231Luc+ breast cancer cells were orthotopically implanted in the MFP (indicated by dashed lines) of SSIL2Rγ and SS.BN3IL2Rγ rats. Tumor progression (e.g., growth, vasculogenesis, and metastasis) were tracked over the duration of the experiment. (D) Because the 231Luc+ tumor cells are the same between strains (gray), any differences in tumor progression can be attributed to differences in the SSIL2Rγ (green) and SS.BN3IL2Rγ (blue) microenvironments.
Figure 2
Figure 2
Growth curve of 231Luc+ breast carcinoma cells implanted in SS.BN3IL2Rγ and SSIL2Rγ rats. The growth of 231Luc+ tumors was monitored by caliper measurement at 10, 17, and 24 days post-implantation in SS.BN3IL2Rγ (n=19) and SSIL2Rγ(n=11) rats. Data are presented as mean tumor volume ± SEM. *P<0.05 as determined by Student unpaired t test.
Figure 3
Figure 3
Characterization of tumor-associated blood vessels and hematogenous metastasis in 231Luc+ tumors implanted in SS.BN3IL2Rγ and SSIL2Rγ rats at 24 days post-implantation. (A) Visualization of tumor-associated blood vessels at using anti-CD31 staining of 231Luc+ tumors implanted in SS.BN3IL2Rγ and SSIL2Rγ rats. Images were acquired at 100X magnification. Scale bar represents 100 μm. (B) Mean blood vessel density in 231Luc+ tumors implanted in SS.BN3IL2Rγ and SSIL2Rγ was calculated from three images per tumor (n= 5–6 tumors per strain) acquired at 100X magnification. Data are presented as the mean vascular density per 100X field ± SEM. *P<0.05 as determined by Student unpaired t test.(C) Percentage of open lumens in 231Luc+ tumors implanted in SS.BN3IL2Rγ and SSIL2Rγ was calculated from three images per tumor (n= 5–6 per strain) acquired at 100X magnification. Data are presented as the percentage of CD31+ vessels with open lumens per 100X field ± SEM. *P<0.05 as determined by Student unpaired t test. (D) Percentage of CD31+ vessels invaded by 231Luc+ cells in tumors implanted in SS.BN3IL2Rγ and SSIL2Rγ was calculated from three images per tumor (n= 5–6 tumors per strain) acquired at 100X magnification. Data are presented as the percentage of CD31+ vessels with open lumens per 100X field ± SEM. ***P<0.001 as determined by Student unpaired t test. (E) Representative luminescent imaging of lungs from tumor-bearing SSIL2Rγ and SS.BN3IL2Rγ rats. (F) Hematogenous metastatic burden in was measured by luciferase activity normalized to total milligrams of protein in lung lysates from SSIL2Rγ (n = 12) and SS.BN3IL2Rγ (n = 16) rats. Metastatic burden of individual rats are represented by the dots and the black bars indicate the average metastatic burden per strain. *P<0.05 as determined by Student unpaired t test.
Figure 4
Figure 4
Increased angiogenic potential in SS.BN3 consomic rats. (A) Density of CD31+ blood vessels in matrigel plugs implanted in SS (n = 20) and SS.BN3 (n = 10) consomic rats. (B) Mean CD31+ blood vessel density in matrigel plugs implanted in SS and SS.BN3 consomic rats was calculated from the entire matrigel plug cross-section. Data are presented as the mean vascular density per mm2 ± SEM. *P<0.05 as determined by Student unpaired t test. (C) Density of SH2B3+ blood vessels in DMBA-induced tumors of SS (n = 9) and SS.BN3 (n = 9) consomic rats. (D) Mean density of SH2B3+ blood vessels was calculated from 400X images of the entire tumor cross-section that were acquired using an automated microscope. Data are presented as the mean vascular density per area ± SEM. **P<0.01 as determined by Student unpaired t test.
Figure 5
Figure 5
Characterization of tumor-associated lymphatic vessels and lymphogenous metastasis in 231Luc+ tumors implanted in SS.BN3IL2Rγ and SSIL2Rγ rats at 24 days post-implantation.(A) Visualization of tumor-associated lymphatic vessels at using anti-LYVE-1 staining of 231Luc+ tumors implanted in SS.BN3IL2Rγ and SSIL2Rγ rats. Scale bar represents 100 μm. (B) Mean lymphatic vessel density in 231Luc+ tumors implanted in SS.BN3IL2Rγ and SSIL2Rγ was calculated from three images per tumor (n= 5–6 per strain) acquired at 100X magnification. Data are presented as the mean vascular density per 100X field ± SEM. (C) Lymphogenous metastatic burden was measured by luciferase activity normalized to total milligrams of protein in axillary LN lysates from SS.BN3IL2Rγ (n = 5) and SSIL2Rγ (n = 8) rats. Metastatic burden of individual rats are represented by the dots and the black bars indicate the average metastatic burden per strain. For (B) and (C), statistical analysis of data was performed by Student unpaired t test.
Figure 6
Figure 6
Sequence analysis of cosegregating alleles and comparative mapping of rat chromosome 3. (A) Venn diagram of sequence comparison the entire rat chromosome 3 between variants shared by the cancer-resistant BN/NHsdMcwi and Cop/Crl strains versus the cancer-susceptible strains ACI/Eur, F344/N, and SS/JrHsdMcwi. (B) Density mapping of variants shared by the cancer-resistant BN/NHsdMcwi and Cop/Crl strains versus the cancer-susceptible strains ACI/Eur, F344/N, and SS/JrHsdMcwi. Data are presented as the number of variants per 1 Mb bin. Note the highest density of cosegregating variants overlap with three breast cancer QTLs (labeled brackets). (C) Venn diagram of sequence comparison the shared QTL region of chromosome 3 (50.5–88.0 Mb) between variants shared by the cancer-resistant BN/NHsdMcwi and Cop/Crl strains versus the cancer-susceptible strains ACI/Eur, F344/N, and SS/JrHsdMcwi. (D) Schematic representation of the overlapping cancer QTLs on rat chromosome 3 and the orthologous regions in human. The overlapping human breast cancer loci indicated on the figure.

References

    1. Peto J, Mack TM. High constant incidence in twins and other relatives of women with breast cancer. Nat Genet. 2000;26:411–414. - PubMed
    1. Rosman DS, Kaklamani V, Pasche B. New insights into breast cancer genetics and impact on patient management. Curr Treat Options Oncol. 2007;8:61–73. - PMC - PubMed
    1. Pharoah PD, Antoniou A, Bobrow M, Zimmern RL, Easton DF, Ponder BA. Polygenic susceptibility to breast cancer and implications for prevention. Nat Genet. 2002;31:33–36. - PubMed
    1. Hartman M, Lindstrom L, Dickman PW, Adami HO, Hall P, Czene K. Is breast cancer prognosis inherited? Breast Cancer Res. 2007;9:R39. - PMC - PubMed
    1. Michailidou K, Hall P, Gonzalez-Neira A, Ghoussaini M, Dennis J, Milne RL, Schmidt MK, Chang-Claude J, Bojesen SE, Bolla MK, et al. Large-scale genotyping identifies 41 new loci associated with breast cancer risk. Nat Genet. 2013;45:353–361. 361e351–352. - PMC - PubMed

Publication types

Substances