. 2014 Oct 15;592(20):4431-46.
doi: 10.1113/jphysiol.2014.276733. Epub 2014 Aug 28.

Fluorescence recovery after photobleaching reveals regulation and distribution of connexin36 gap junction coupling within mouse islets of Langerhans

Affiliations

Fluorescence recovery after photobleaching reveals regulation and distribution of connexin36 gap junction coupling within mouse islets of Langerhans

Nikki L Farnsworth et al. J Physiol. .

Erratum in

  • Corrigenda.
    [No authors listed] [No authors listed] J Physiol. 2015 Jul 15;593(14):3223. doi: 10.1113/JP270942. Epub 2015 Jun 19. J Physiol. 2015. PMID: 26176422 Free PMC article. No abstract available.

Abstract

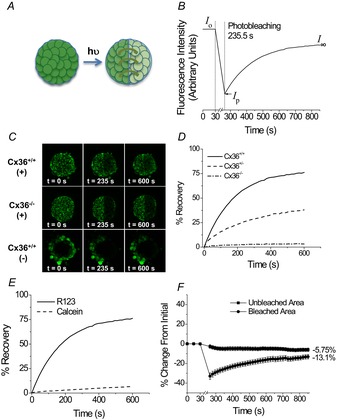
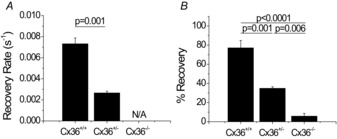
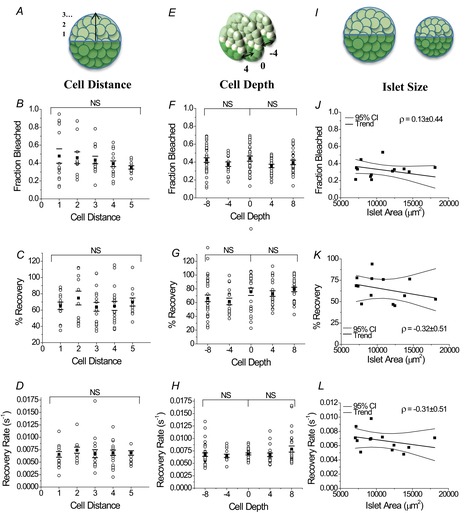
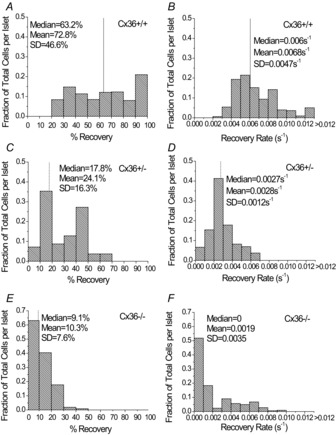
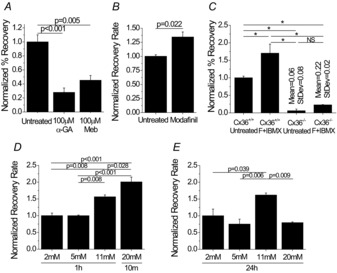
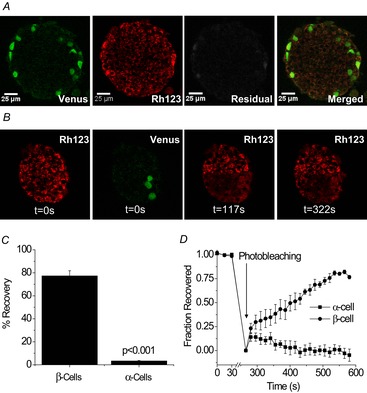
The pancreatic islets are central to the maintenance of glucose homeostasis through insulin secretion. Glucose‐stimulated insulin secretion is tightly linked to electrical activity in β cells within the islet. Gap junctions, composed of connexin36 (Cx36), form intercellular channels between β cells, synchronizing electrical activity and insulin secretion. Loss of gap junction coupling leads to altered insulin secretion dynamics and disrupted glucose homeostasis. Gap junction coupling is known to be disrupted in mouse models of pre‐diabetes. Although approaches to measure gap junction coupling have been devised, they either lack cell specificity, suitable quantification of coupling or spatial resolution, or are invasive. The purpose of this study was to develop fluorescence recovery after photobleaching (FRAP) as a technique to accurately and robustly measure gap junction coupling in the islet. The cationic dye Rhodamine 123 was used with FRAP to quantify dye diffusion between islet β cells as a measure of Cx36 gap junction coupling. Measurements in islets with reduced Cx36 verified the accuracy of this technique in distinguishing between distinct levels of gap junction coupling. Analysis of individual cells revealed that the distribution of coupling across the islet is highly heterogeneous. Analysis of several modulators of gap junction coupling revealed glucose‐ and cAMP‐dependent modulation of gap junction coupling in islets. Finally, FRAP was used to determine cell population specific coupling, where no functional gap junction coupling was observed between α cells and β cells in the islet. The results of this study show FRAP to be a robust technique which provides the cellular resolution to quantify the distribution and regulation of Cx36 gap junction coupling in specific cell populations within the islet. Future studies utilizing this technique may elucidate the role of gap junction coupling in the progression of diabetes and identify mechanisms of gap junction regulation for potential therapies.


Figures

Figure 1
Figure 1. Fluorescence recovery after photobleaching (FRAP) with Rhodamine 123 (Rh123) measures diffusion across connexion36 (Cx36) gap junctions in the islet
A, schematic of FRAP experiments. Islets were stained with Rh123, half the islet was photobleached, and the diffusion of dye into the bleached region was quantified according to the intensity of fluorescence. B, representative data for fluorescence recovery as measured in the photobleached region of an islet, where Rh123 was photobleached for 235.5 s. Cx36 gap junction coupling is characterized by the kinetics of fluorescence recovery, where initial fluorescence (Io), fluorescence immediately after photobleaching (Ip), and final fluorescence (I) are used to calculate the amount of bleaching, percentage recovery and recovery rate. C, representative images of Rh123 fluorescence before photobleaching (0 s), immediately after photobleaching (235 s), and after fluorescence recovery (600 s) in Cx36 wild-type (Cx36+/+) and homozygous knockout (Cx36−/−) islets stained with Rh123 (+), as well as Cx36+/+ islets stained with calcein AM (−). D, representative recovery curves for Cx36+/+, heterozygous knockout Cx36+/− and homozygous knockout Cx36−/− islets. Data represent the mean ± s.e.m. over 10 islets (from three mice) for each time-point with the average final percentage change indicated for each condition. E, representative recovery curves for Cx36+/+ islets stained with Rh123 or calcein AM. F, percentage change from the initial fluorescence intensity in the bleached or unbleached area of a Cx36+/+ islet stained with Rh123.
Figure 2
Figure 2. Specific levels of connexion36 (Cx36) gap junction coupling revealed using fluorescence recovery after photobleaching (FRAP)
Recovery rate (A) and percentage recovery (B) in Cx36+/+, Cx36+/− and Cx36−/− islets as determined by analysis of FRAP data. Data are presented as the mean ± s.e.m. averaged over three or four mice per condition with two or three islets per mouse. N/A represents conditions at which recovery rates could not be calculated as a result of little or no fluorescence recovery.
Figure 3
Figure 3. Changes in bleaching time, laser power and the percentage of islet area bleached correlate with changes in fraction bleached, but fraction bleached does not affect recovery rate
Fraction decrease of total fluorescence intensity after photobleaching with respect to bleaching time (A), laser intensity (B), and percentage of the islet area bleached (C). D, fraction decrease of total fluorescence after photobleaching as a function of measured recovery rate. Each point represents the average fraction bleached over one or two islets from one mouse, where three mice were used per condition. The Pearson linear correlation coefficient (ρ) ± 95% confidence interval (95% CI) is displayed in the top right corner for each dataset. Linear regression trends and 95% CIs for the trends are also presented.
Figure 4
Figure 4. No differences emerged in fraction bleached and recovery characteristics with distance from bleaching area, depth above and below the bleaching plane, or islet area
Fraction decrease of total fluorescence intensity after photobleaching, percentage recovery and recovery rate as a function of cell layer distance from the centre edge of the bleaching plane (AD) and as a function of cell layer depth above and below the bleaching plane (EH). Data represent fluorescence recovery kinetics for individual cells (○), where the average over three mice (▪) and s.e.m. (–) are presented for each cell layer, with each data point averaged over one or two islets per mouse. NS signifies no significant difference (P < 0.05) between conditions indicated in the brackets. IL, fraction decrease of total fluorescence intensity, percentage recovery and recovery rate after photobleaching as a function of islet area, represented by the surface area of the plane selected for bleaching. Each point represents the average fraction bleached over 13 islets from three mice. The Pearson linear correlation coefficient (ρ) ± 95% confidence interval (95% CI) is displayed in the top right corner for each dataset. Linear regression trends and 95% CIs for the trends are also presented.
Figure 5
Figure 5. Fluorescence recovery after photobleaching (FRAP) reveals the distribution of recovery characteristics in connexion36 (Cx36)+/+, Cx36+/− and Cx36−/− islets
Fraction of total cells per islet stained with Rh123, with a given percentage recovery in Cx36+/+ islets (A), Cx36+/− islets (C) and Cx36−/− islets (E), and recovery rates in Cx36+/+ islets (B), Cx36+/− islets (D) and Cx36−/− islets (F). Data represent the average fraction of total cells weighted over three mice, with data averaged over two islets per mouse for Cx36+/+ mice and one or two islets per mouse for Cx36+/− mice, and one to three islets per mouse for Cx36−/− mice. The median, mean and s.d. of the percentage recovery or recovery rate over 173 cells for Cx36+/+ mice, 48 cells for Cx36+/− mice and 116 cells for Cx36−/− mice are shown for cells from one or two islets per mouse with a total of three mice per coupling condition. The dotted line in each panel represents the location on the x-axis of the median value for each measurement.
Figure 6
Figure 6. Fluorescence recovery after photobleaching (FRAP) quantification of modulation of connexion36 (Cx36) gap junction coupling
A, percentage recovery in islets treated with 100 μm 18-α-glycyrrhetinic acid (α-GA) or 100 μm mebeverine (Meb) normalized to untreated Cx36+/+ islets. Data represent the mean ± s.e.m. over three mice, with each data point averaged over one to three islets per mouse. B, recovery rate in Cx36+/+ islets either untreated or treated with 50 μm modafinil for 1 h, normalized to untreated islets. Data represent the mean ± s.e.m. over three mice, with each data point averaged over one to three islets per mouse. C, percentage recovery in Cx36+/+ and Cx36−/− islets either untreated or treated with 100 μm 3-isobutyl-1-methylxanthine (IBMX) with 50 μm forskolin (F + IBMX) normalized to untreated Cx36+/+ islets. Data represent the mean ± s.e.m. over three or four mice, with each data point averaged over three or four islets per mouse. For Cx36−/− islets, the mean and s.d. are also presented above the respective data columns. D, recovery rate in C57BL/6 islets cultured in 2 mm, 5 mm or 11 mm glucose for 1 h or 20 mm glucose for 10 min, normalized to recovery rate at 2 mm glucose. Data represent the mean ± s.e.m. over three mice, with each data point averaged over two or three islets per mouse. E, recovery rate in C57BL/6 islets cultured in 2 mm, 5 mm, 11 mm or 20 mm glucose for 24 h, normalized to recovery rate at 2 mm glucose. Data represent the mean ± s.e.m. over three mice, with each data point averaged over two to three islets per mouse. *P < 0.001. NS, no significant difference between conditions.
Figure 7
Figure 7. No functional connexion36 (Cx36) gap junction coupling between α cells and β cells in GLU-Venus islets
A, representative images of unmixed fluorescence for (left to right) Venus, Rhodamine 123 (Rh123), unmixing residuals and the merged final image. Spectra for Rh123 and Venus fluorophores were obtained from Rh123-stained C57BL/6 islets and unstained GLU-Venus islets, respectively. B, representative unmixed images of Rh123 before photobleaching (0 s), Venus expressing α cells before photobleaching, Rh123 immediately after photobleaching (117 s) and Rh123 after fluorescence recovery (322 s) in a GLU-Venus islet. C, percentage fluorescence recovery in α and β cells in a GLU-Venus islet. Data represent the mean ± s.e.m. over three mice, with each data point averaged over four to 24 cells from three to six islets per mouse. D, fraction of total fluorescence intensity recovered in α and β cells of a GLU-Venus islet. Data represent the mean ± s.e.m. fraction over three mice for each time-point, with each data point averaged over four to nine cells from three or four islets per mouse.

Similar articles

Cited by

References

    1. Abbaci M, Barberi-Heyob M, Blondel W, Guillemin F, Dideldon J. Advantages and limitations of commonly used methods to assay the molecular permeability of gap junctional intercellular communication. BioTechniques. 2008;45:33–62. - PubMed
    1. Allagnat F, Martin D, Condorelli DF, Waeber G, Haefliger J-A. Glucose represses connexin36 in insulin-secreting cells. J Cell Sci. 2005;118:5335–5344. - PubMed
    1. Bavamian S, Pontes H, Cancela J, Charollais A, Startchik S, Ville DVD, Meda P. The intercellular synchronization of Ca2+ oscillations evaluates Cx36-dependent coupling. PLoS ONE. 2012;7:e41535. - PMC - PubMed
    1. Benninger RKP, Head WS, Zhang M, Satin LS, Piston DW. Gap junctions and other mechanisms of cell–cell communication regulate basal insulin secretion in the pancreatic islet. J Physiol. 2011;589:5453–5466. - PMC - PubMed
    1. Benninger RKP, Piston DW. Two-photon excitation microscopy for the study of living cells and tissues. Curr Protoc Cell Biol. 2013;4:1–24. - PMC - PubMed

Publication types

LinkOut - more resources