Review
. 2014 Nov 15;592(22):4809-23.
doi: 10.1113/jphysiol.2014.277228. Epub 2014 Aug 28.

Wiring patterns in the mouse retina: collecting evidence across the connectome, physiology and light microscopy

Affiliations
Review

Wiring patterns in the mouse retina: collecting evidence across the connectome, physiology and light microscopy

Felice A Dunn et al. J Physiol. .

Abstract

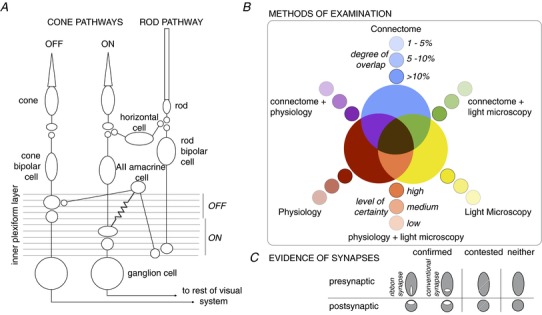
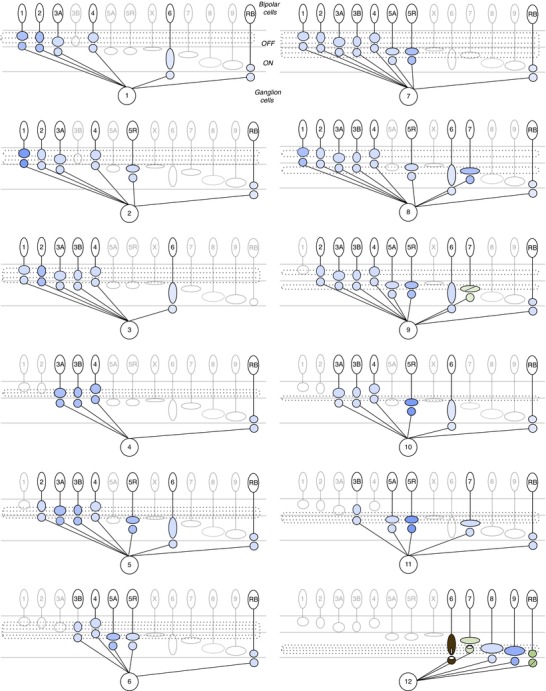
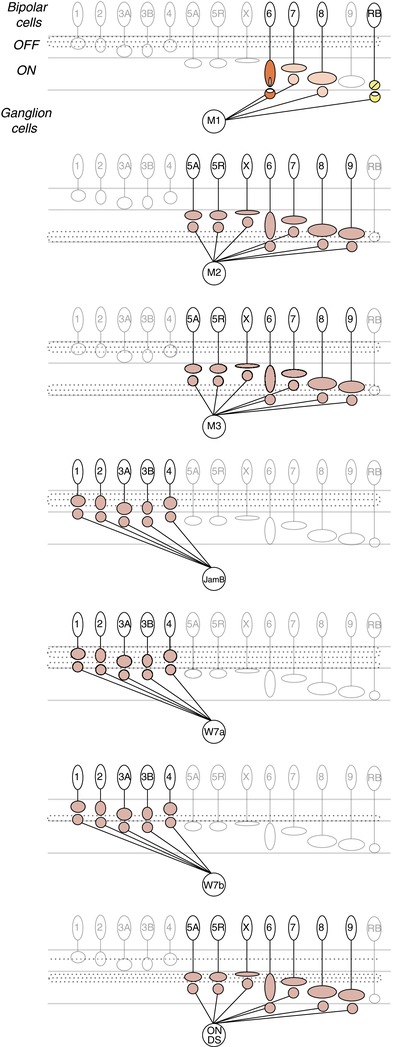
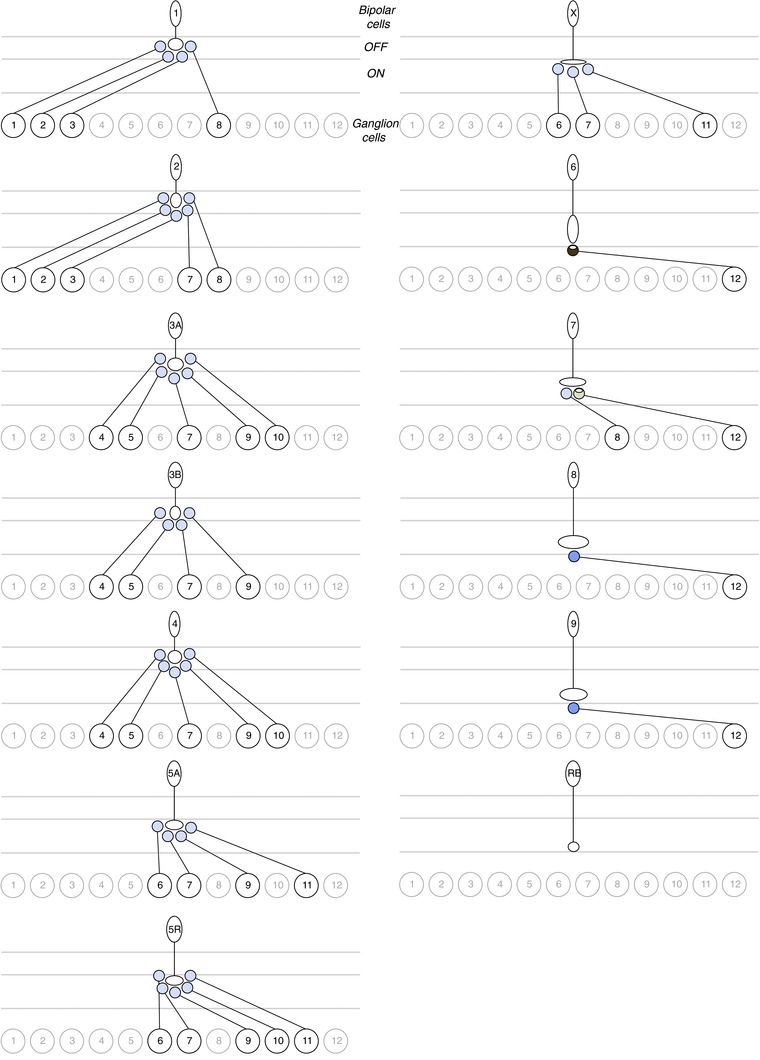
The visual system has often been thought of as a parallel processor because distinct regions of the brain process different features of visual information. However, increasing evidence for convergence and divergence of circuit connections, even at the level of the retina where visual information is first processed, chips away at a model of dedicated and distinct pathways for parallel information flow. Instead, our current understanding is that parallel channels may emerge, not from exclusive microcircuits for each channel, but from unique combinations of microcircuits. This review depicts diagrammatically the current knowledge and remaining puzzles about the retinal circuit with a focus on the mouse retina. Advances in techniques for labelling cells and genetic manipulations have popularized the use of transgenic mice. We summarize evidence gained from serial electron microscopy, electrophysiology and light microscopy to illustrate the wiring patterns in mouse retina. We emphasize the need to explore proposed retinal connectivity using multiple methods to verify circuits both structurally and functionally.


Figures

Figure 1
Figure 1. Basic retinal wiring diagram colouring book and palette
A, basic wiring diagram of the mouse retina. Signals from cones traverse the retina either through ON or OFF cone bipolar cells and ganglion cells. Synaptic connections between OFF bipolar and ganglion cells are predominantly found in the upper 0–40% of the inner plexiform layer, whereas synaptic connections between ON bipolar and ganglion cells are predominantly found in the lower 41–100% of the inner plexiform layer. Horizontal cells provide feedback to photoreceptors. Signals from rods traverse the retina through the rod bipolar pathway, which involves the rod bipolar, AII amacrine cell, electrical synapses with ON cone bipolar cells (symbolized by a resistor), chemical synapses with OFF cone bipolar cells (symbolized by 2 circles in close proximity), and respective connections with ON and OFF ganglion cells. B, colour code of methods used to examine connections. The primary methods include: the connectome, which is the serial reconstruction of electron micrographs (blue); physiological evidence (red); and light microscopy used to determine appositions (yellow). Combinations of methods are indicated by secondary colours: connectome + physiology (purple), physiology + light microscopy (orange), and connectome + light microscopy (green). Finally, in the case of all three methods of examination, connectome + physiology + light microscopy, the terminal is coloured brown. The saturation of colours indicates either the degree of overlap between cells, as determined in the connectome, or the level of certainty for the other methods of examination. C, evidence for the presence of synaptic marker proteins, either by ultrastructure or light microscopy, is indicated by white ovals within the pre- and/or postsynaptic terminals. Shape of the presynaptic oval represents either a ribbon synapse (vertical) or conventional synapse (horizontal). Contested synapses are indicated by a diagonal line through the terminal. If synaptic markers have not been examined, the terminal is left a solid colour to indicate that only pre- and postynaptic cell fills were used. These colours and symbols are consistently used throughout the figures.
Figure 2
Figure 2. Convergence of bipolar cell types onto individual ganglion cells
Putative connections between bipolar cell types and each ganglion cell described in the connectome. Presynaptic bipolar cell axonal stratification level represented by location of oval in the inner plexiform layer, and approximate axonal size represented by different sized ovals. Potential contacts of postsynaptic ganglion cells are represented by a circle near the bipolar presynaptic terminal. Circles representing contacts may fall outside the dendritic stratification level of the ganglion cells. The identity of the ganglion cells (GC) 1–12 corresponds to the nomenclature used in Helmstaedter et al. (2013). Refer to Table1 for the potential correlates of this ganglion cell typing scheme to those of other studies. Dotted lines in the inner plexiform layer correspond to the dendritic stratification of each ganglion cell. Connections between the type 7 bipolar cells and GC 9, which corresponds to the ON–OFF direction selective ganglion cell, have been examined by presynaptic markers (Lin & Masland, 2005) and the connectome (Helmstaedter et al. 2013). Connections with the A-type ON sustained ganglion cell (GC 12) have been examined by all methods for the type 6 bipolar cell (Schwartz et al. 2012), by synaptic markers and the connectome for the type 7 cone bipolar cells and rod bipolar cells (Morgan et al. 2011). For individual pairs of A-type ON ganglion cells and rod bipolar cells, synaptic markers were present during development but disappeared by postnatal day 21. For all other ganglion cell types, the connectome is the only method so far that has suggested connections between bipolar cell and ganglion cell types. The amount of overlap between each pair is normalized by each ganglion cell's total connectivity.
Figure 3
Figure 3. Circuit diagrams of ganglion cells not identified in the connectome
Ganglion cell types missing from the connectome include the melanopsin-expressing ganglion cells, M1, M2, M3; JamB; W7a; W7b; and the ON direction selective (ON DS) ganglion cells. Evidence from physiology and synaptic markers indicates inputs from ON cone bipolar cells to the M1 melanopsin ganglion cell (orange). En passant synapses from either the type 6, 7, or 8 ON cone bipolar cells have been speculated by Dumitrescu et al. (2009). Both the M2 and M3 melanopsin ganglion cells receive excitatory ON input (Schmidt & Kofuji, ; Schmidt et al. ,b2011b); however, the bipolar cell type providing input remains unknown, hence we indicate a low level of certainty from physiology (red). The JamB, W7a and W7b ganglion cells described by Kim et al. (2010) depolarize to light decrements in their receptive field centres, suggesting that these cells may receive inputs from OFF cone bipolar cells. These synapses are coloured by the lowest level of certainty for the method of physiology (red). The majority of ON direction selective ganglion cell dendrites stratify in the ON sublamina of the inner plexiform layer and their membrane potential depolarizes to light increments, suggesting inputs from ON cone bipolar cells (Dhande et al. 2013). However, a particular type has not been implicated, thus the level of certainty for each type is low.
Figure 4
Figure 4. Divergence of bipolar cell output to ganglion cell types
Putative connections between each bipolar cell type and the ganglion cell types described in the connectome (Helmstaedter et al. 2013). Type 6, 7, 8 and 9 ON cone bipolar cells have major connections with the GC 12 A-type ON ganglion cell. All other bipolar cell types diverge to multiple ganglion cell types. The rod bipolar cell does not have connections exceeding 1% with any of the ganglion cells. The amount of overlap between each pair is normalized by each bipolar cell type's total connectivity.
Figure 5
Figure 5. Direction selective circuits
Bipolar cell types which have ≥1% overlap with the OFF (A) and ON (B) starburst amacrine cells’ (SAC) total connectivity. C, ganglion cells which receive ≥1% of total connections from the starburst amacrine cells or which have physiological evidence for direction selectivity, in the cases of the JamB and ON DS ganglion cells (Kim et al. ; Dhande et al. 2013). The GC 9 is the ON–OFF direction selective ganglion cell, whose connections with starburst amacrine cells have been confirmed by all methods (Wei et al. ; Briggman et al. 2011). The GC 6 is hypothesized to be motion or direction sensitive according to the connectome (Helmstaedter et al. 2013). Dotted lines in the inner plexiform layer represent the dendritic stratification of the starburst amacrine cells. The amount of overlap between each pair is normalized by each ganglion cell type's total connectivity.
Figure 6
Figure 6. Basic rod pathways wiring diagram and AII amacrine connectivity
A, circuit diagram illustrating the multiple pathways for rod signals to traverse the retina. The primary rod pathway (1) involves a glutamatergic synapse between the rod and rod bipolar cell, glutamatergic synapse between rod bipolar cell and AII amacrine cell, electrical synapse between the AII amacrine cell and ON cone bipolar cell, glycinergic synapse between AII amacrine cell and OFF cone bipolar cell, and glutamatergic synapses between the ON cone bipolar and ON ganglion cell as well as between the OFF cone bipolar cell and OFF ganglion cell (Feigenspan et al. ; Tsukamoto et al. ; Deans et al. ; Veruki & Hartveit, in rat; Haverkamp et al. 2003). The secondary rod pathway (2) involves electrical synapses between rods and cones and subsequent reliance on cone pathways (Tsukamoto et al. ; Deans et al. ; but see Pang et al. 2010). The tertiary rod pathway (3) begins with either direct input from rods to OFF cone bipolar cells (Soucy et al. ; Hack et al. ; Tsukamoto et al. ; Mataruga et al. ; Haverkamp et al. 2008) or to ON cone bipolar cells (Tsukamoto et al. ; Pang et al. 2010). Finally, Pang et al. (2010) reported physiological evidence for direct inputs from cones to rod bipolar cells. B and C, connections between the AII amacrine cell and each bipolar cell type either normalized by the connections of all bipolar cell contacts (B), or by the connections of all AII amacrine cell contacts (C). Physiological evidence bolsters a subset of connections (Veruki & Hartveit, ; Mazade & Eggers, 2013), and fluorescence of pre- and postsynaptic markers bolsters connections of type 1 and 2 OFF cone bipolar cells with the AII amacrine cell (Sassoè-Pognetto et al. in rat; Haverkamp et al. 2003). Ultrastructural evidence for synaptic proteins provides evidence for AII amacrine cell input to the type 4, but not to the type 3 OFF cone bipolar cells (Tsukamoto et al. 2001). In the case of physiological evidence for electrical coupling between the AII amacrine and type 5 cone bipolar cells in rat (Veruki & Hartveit, 2002), we show that either of the subtypes (5A and 5R) could be coupled with the AII amacrine cell. D, putative direct connections between the AII amacrine cell and ganglion cell types described in the connectome. Several studies have supported direct input between AII amacrine cells and the A-type OFF ganglion cells (GC 1). The amount of overlap with the AII amacrine cell is normalized by each ganglion cell's total connectivity.

References

    1. Arman AC, Sampath AP. Dark-adapted response threshold of OFF ganglion cells is not set by OFF bipolar cells in the mouse retina. J Neurophysiol. 2012;107:2649–2659. &. - PMC - PubMed
    1. Asari H, Meister M. Divergence of visual channels in the inner retina. Nat Neurosci. 2012;15:1581–1589. &. - PMC - PubMed
    1. Beier KT, Borghuis BG, El-Danaf RN, Huberman AD, Demb JB, Cepko CL. Transsynaptic tracing with vesicular stomatitis virus reveals novel retinal circuitry. J Neurosci. 2013;33:35–51. &. - PMC - PubMed
    1. Bleckert A, Parker ED, Kang Y, Pancaroglu R, Soto F, Lewis R, Craig AM, Wong ROL. Spatial relationships between gabaergic and glutamatergic synapses on the dendrites of distinct types of mouse retinal ganglion cells across development. PLoS One. 2013;8:e69612. &. - PMC - PubMed
    1. Bleckert A, Schwartz GW, Turner MH, Rieke F, Wong ROL. Visual space is represented by nonmatching topographies of distinct mouse retinal ganglion cell types. Curr Biol. 2014;24:310–315. &. - PMC - PubMed

Publication types

LinkOut - more resources