

Standing genetic variation drives repeatable experimental evolution in outcrossing populations of Saccharomyces cerevisiae
- PMID: 25172959
- PMCID: PMC4245818
- DOI: 10.1093/molbev/msu256
Standing genetic variation drives repeatable experimental evolution in outcrossing populations of Saccharomyces cerevisiae
Abstract
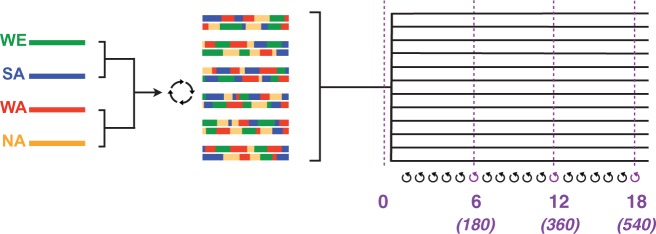
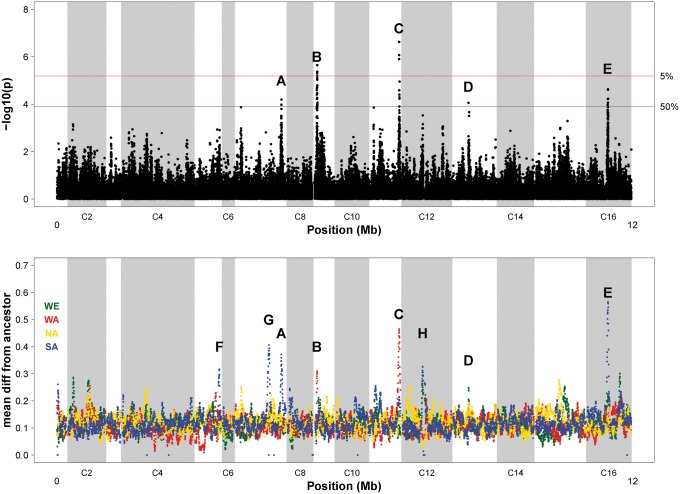
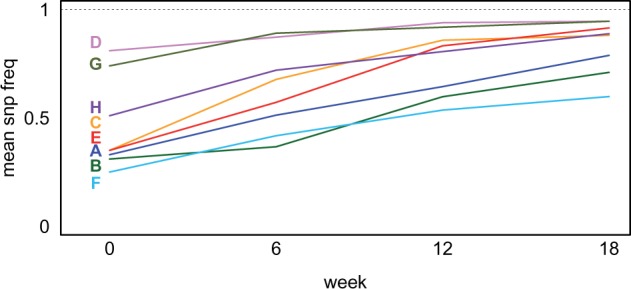
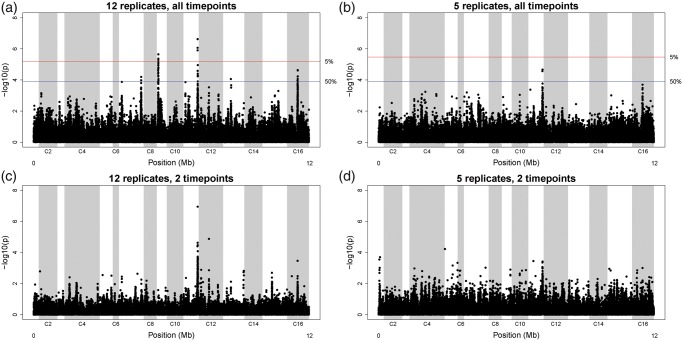
In "evolve-and-resequence" (E&R) experiments, whole-genome sequence data from laboratory-evolved populations can potentially uncover mechanisms of adaptive change. E&R experiments with initially isogenic, asexually reproducing microbes have repeatedly shown that beneficial de novo mutations drive adaptation, and these mutations are not shared among independently evolving replicate populations. Recent E&R experiments with higher eukaryotes that maintain genetic variation via sexual reproduction implicate largely different mechanisms; adaptation may act primarily on pre-existing genetic variation and occur in parallel among independent populations. But this is currently a debated topic, and generalizing these conclusions is problematic because E&R experiments with sexual species are difficult to implement and important elements of experimental design suffer for practical reasons. We circumvent potentially confounding limitations with a yeast model capable of shuffling genotypes via sexual recombination. Our starting population consisted of a highly intercrossed diploid Saccharomyces cerevisiae initiated from four wild haplotypes. We imposed a laboratory domestication treatment on 12 independent replicate populations for 18 weeks, where each week included 2 days as diploids in liquid culture and a forced recombination/mating event. We then sequenced pooled population samples at weeks 0, 6, 12, and 18. We show that adaptation is highly parallel among replicate populations, and can be localized to a modest number of genomic regions. We also demonstrate that despite hundreds of generations of evolution and large effective population sizes, de novo beneficial mutations do not play a large role in this adaptation. Further, we have high power to detect the signal of change in these populations but show how this power is dramatically reduced when fewer timepoints are sampled, or fewer replicate populations are analyzed. As ours is the most highly replicated and sampled E&R study in a sexual species to date, this evokes important considerations for past and future experiments.
Keywords: experimental evolution; population genomics; quantitative trait loci.
© The Author 2014. Published by Oxford University Press on behalf of the Society for Molecular Biology and Evolution. All rights reserved. For permissions, please e-mail: journals.permissions@oup.com.
Figures
Similar articles
-
Adaptation in Outbred Sexual Yeast is Repeatable, Polygenic and Favors Rare Haplotypes.Mol Biol Evol. 2022 Dec 5;39(12):msac248. doi: 10.1093/molbev/msac248. Mol Biol Evol. 2022. PMID: 36366952 Free PMC article.
-
Recombination Alters the Dynamics of Adaptation on Standing Variation in Laboratory Yeast Populations.Mol Biol Evol. 2018 Jan 1;35(1):180-201. doi: 10.1093/molbev/msx278. Mol Biol Evol. 2018. PMID: 29069452 Free PMC article.
-
The power to detect quantitative trait loci using resequenced, experimentally evolved populations of diploid, sexual organisms.Mol Biol Evol. 2014 Apr;31(4):1040-55. doi: 10.1093/molbev/msu048. Epub 2014 Jan 18. Mol Biol Evol. 2014. PMID: 24441104 Free PMC article.
-
How does adaptation sweep through the genome? Insights from long-term selection experiments.Proc Biol Sci. 2012 Dec 22;279(1749):5029-38. doi: 10.1098/rspb.2012.0799. Epub 2012 Jul 25. Proc Biol Sci. 2012. PMID: 22833271 Free PMC article. Review.
-
Embracing Complexity: Yeast Evolution Experiments Featuring Standing Genetic Variation.J Mol Evol. 2023 Jun;91(3):281-292. doi: 10.1007/s00239-023-10094-4. Epub 2023 Feb 8. J Mol Evol. 2023. PMID: 36752827 Free PMC article. Review.
Cited by
-
Uncovering the genetic signature of quantitative trait evolution with replicated time series data.Heredity (Edinb). 2017 Jan;118(1):42-51. doi: 10.1038/hdy.2016.98. Epub 2016 Nov 16. Heredity (Edinb). 2017. PMID: 27848948 Free PMC article.
-
Ancestral population reconstitution from isofemale lines as a tool for experimental evolution.Ecol Evol. 2016 Aug 30;6(20):7169-7175. doi: 10.1002/ece3.2402. eCollection 2016 Oct. Ecol Evol. 2016. PMID: 27895897 Free PMC article.
-
Powerful, efficient QTL mapping in Drosophila melanogaster using bulked phenotyping and pooled sequencing.Genetics. 2022 Mar 3;220(3):iyab238. doi: 10.1093/genetics/iyab238. Genetics. 2022. PMID: 35100395 Free PMC article.
-
Effects of evolutionary history on genome wide and phenotypic convergence in Drosophila populations.BMC Genomics. 2018 Oct 11;19(1):743. doi: 10.1186/s12864-018-5118-7. BMC Genomics. 2018. PMID: 30305018 Free PMC article.
-
An ancient origin of the naked grains of maize.Proc Natl Acad Sci U S A. 2025 Jun 24;122(25):e2503748122. doi: 10.1073/pnas.2503748122. Epub 2025 Jun 17. Proc Natl Acad Sci U S A. 2025. PMID: 40526715
References
-
- Bahalul M, Kaneti G, Kashi Y. Ether-zymolyase ascospore isolation procedure: an efficient protocol for ascospores isolation in Saccharomyces cerevisiae yeast. Yeast. 2010;27:999–1003. - PubMed
-
- Barrick JE, Yu DS, Yoon SH, Jeong H, Oh TK, Schneider D, Lenski RE, Kim JF. Genome evolution and adaptation in a long-term experiment with Escherichia coli. Nature. 2009;461:1243–1274. - PubMed
-
- Broman KW, Sen S. A guide to QTL mapping with R-qtl. New York: Springer; 2009.
Publication types
MeSH terms
Grants and funding
LinkOut - more resources
Full Text Sources
Other Literature Sources
Molecular Biology Databases
Research Materials
Miscellaneous
