Comparative Study
. 2014 Sep;6(9):2301-20.
doi: 10.1093/gbe/evu184.

Evidence for deep regulatory similarities in early developmental programs across highly diverged insects

Affiliations
Comparative Study

Evidence for deep regulatory similarities in early developmental programs across highly diverged insects

Majid Kazemian et al. Genome Biol Evol. 2014 Sep.

Abstract

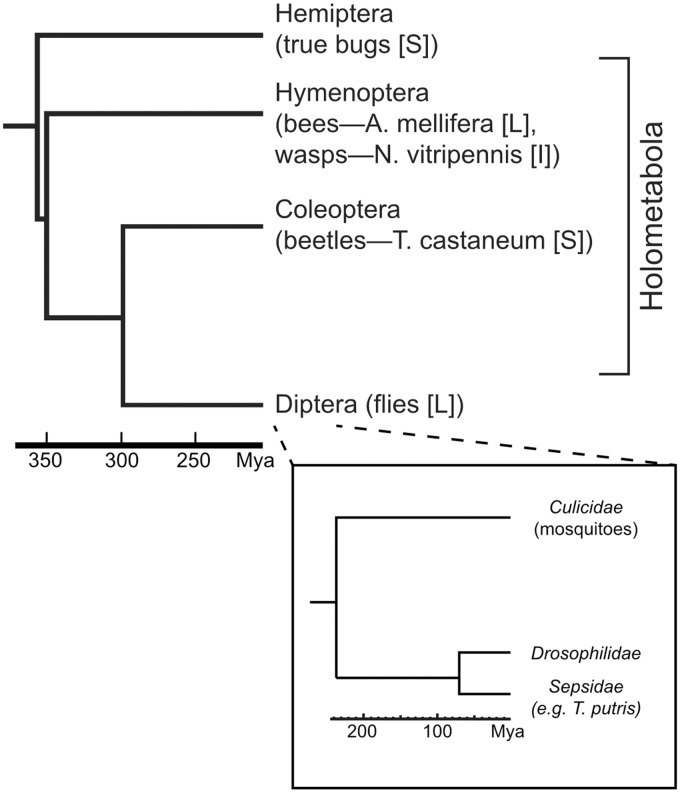
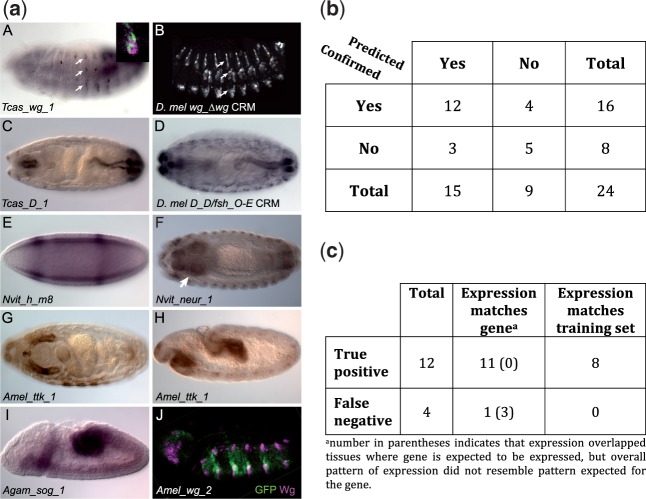
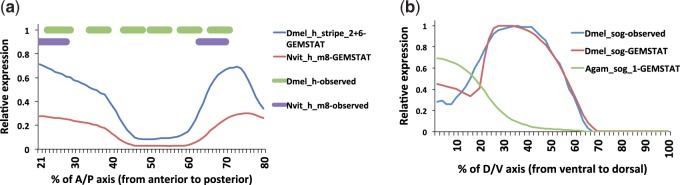
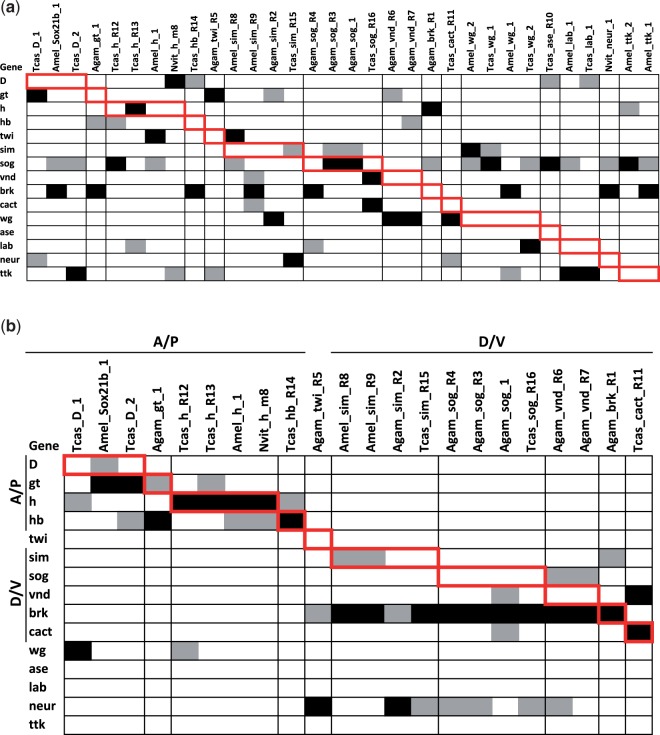
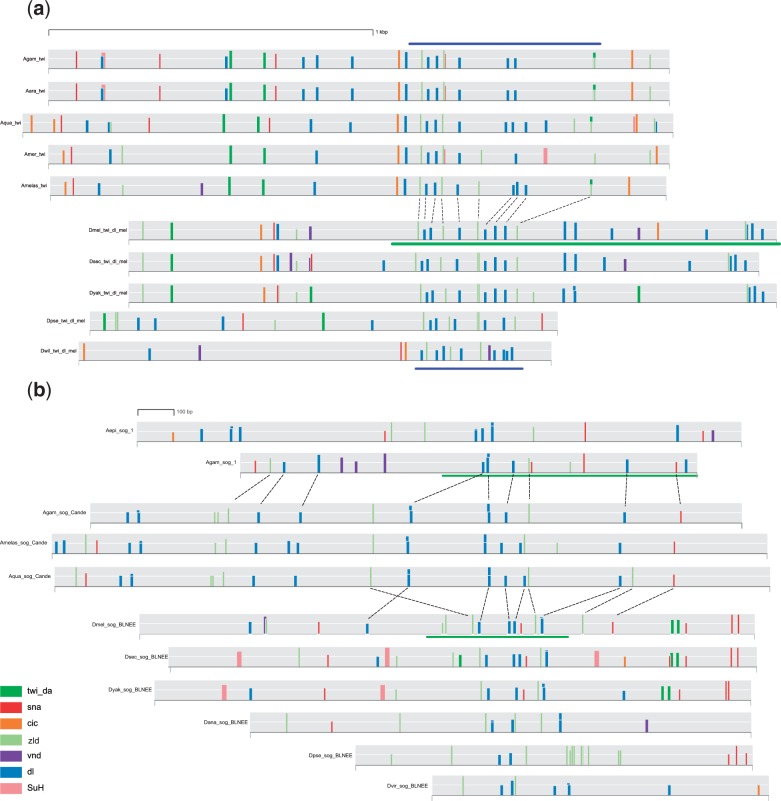
Many genes familiar from Drosophila development, such as the so-called gap, pair-rule, and segment polarity genes, play important roles in the development of other insects and in many cases appear to be deployed in a similar fashion, despite the fact that Drosophila-like "long germband" development is highly derived and confined to a subset of insect families. Whether or not these similarities extend to the regulatory level is unknown. Identification of regulatory regions beyond the well-studied Drosophila has been challenging as even within the Diptera (flies, including mosquitoes) regulatory sequences have diverged past the point of recognition by standard alignment methods. Here, we demonstrate that methods we previously developed for computational cis-regulatory module (CRM) discovery in Drosophila can be used effectively in highly diverged (250-350 Myr) insect species including Anopheles gambiae, Tribolium castaneum, Apis mellifera, and Nasonia vitripennis. In Drosophila, we have successfully used small sets of known CRMs as "training data" to guide the search for other CRMs with related function. We show here that although species-specific CRM training data do not exist, training sets from Drosophila can facilitate CRM discovery in diverged insects. We validate in vivo over a dozen new CRMs, roughly doubling the number of known CRMs in the four non-Drosophila species. Given the growing wealth of Drosophila CRM annotation, these results suggest that extensive regulatory sequence annotation will be possible in newly sequenced insects without recourse to costly and labor-intensive genome-scale experiments. We develop a new method, Regulus, which computes a probabilistic score of similarity based on binding site composition (despite the absence of nucleotide-level sequence alignment), and demonstrate similarity between functionally related CRMs from orthologous loci. Our work represents an important step toward being able to trace the evolutionary history of gene regulatory networks and defining the mechanisms underlying insect evolution.

Keywords: alignment free enhancer prediction; cross species enhancer discovery; regulatory modules in diverged insects.


Figures

F<sc>ig</sc>. 1.—
Fig. 1.—
Phylogeny and evolutionary divergence of the Holometabola. For clarity, only species used in this study are shown, along with the closest nonholometabolous insect order, the Hemiptera. Inset shows the Dipteran (fly) radiation. Letters in brackets indicate mode of development for the indicated species: S, short germband; L, long germband; I, intermediate (mix of short and long characteristics). Divergence times are from Wiegmann et al. (2011) for the Diptera and from Wiegmann et al. (2009) for the other orders.
F<sc>ig</sc>. 2.—
Fig. 2.—
Schematic of enhancer evolution modes. Homologous pair of enhancers derived by direct descent (a) from a common ancestral enhancer or by convergent evolution (b) from different sequences in the ancestor. Black arrows show evolutionary relationships. Red arrows indicate expression driven by the CRM in an idealized fly embryo, with green indicating activity. Each shape (rectangle, oval, hexagon) indicates binding sites of a different TF. (b) CRM in the ancestral genome diverges in terms of the arrangement of binding sites but conservation of site composition ensures that the regulatory output is conserved. (b) Two different sequences in the ancestral genome convergently evolve to extant CRMs with different site compositions but similar expression readouts. In either case, the two derived CRMs are unlikely to be alignable at the nucleotide level, in one case (a) due to contrasting arrangements of similar binding sites and in the other case (b) due to different site compositions. Note: Evolution modes shown here are only two toy examples representing a broad spectrum of possibilities.
F<sc>ig</sc>. 3.—
Fig. 3.—
Alignment of intergenic regions of developmental genes between diverged species. Examples in this figure are from the even skipped (eve) locus; see supplementary figure S1, Supplementary Material online, for examples from other loci. (a) Dotplot alignment of Drosophila mojavensis and D. melanogaster (∼60 Ma) downstream intergenic regions shows clear alignment (diagonal) between the two species. (b) The more diverged Sepsid fly Themira putris (∼75 Ma) lies near the edge of noncoding alignment (weak diagonal) as previously reported by Crocker and Erives (2008) and Hare et al. (2008). Neither mosquitoes (c) nor beetles (d) show recognizable alignment, as can be seen from the absence of a visible diagonal and similarity to alignment with randomized sequence (e). The dotplot results are confirmed by BLAST analysis (f), which shows that only D. mojavensis and T. putris have a BLAST score distribution with scores exceeding those obtained from randomized sequence (for D. mel–T. putris vs. D. mel–randomized T. putris, P < 0.024, uncorrected one-sided Student’s t-test).
F<sc>ig</sc>. 4.—
Fig. 4.—
(a) Pipeline for cross-species supervised CRM prediction. Top: A set of CRMs that regulate similar gene expression patterns is selected as a training set. Expression driven by CRMs from the blastoderm (left) and CNS (right) training sets are pictured. Note that there is a range of related but nonidentical patterns. (Blastoderm embryo pictures are adapted from Schroeder et al. [2004] under the terms of the CC-BY license.) A statistical model is then trained on k-mers in this training set of CRMs as well as non-CRM sequences from Drosophila. Separately, an “expression gene set” is defined as Drosophila genes with expression patterns matching the training set. Middle: The trained model is used to scan a non-Drosophila target genome, and score every 500-bp window in the genome for similarity to the training set in Drosophila. Highest scoring windows (marked with asterisks) are predicted to be CRMs. Bottom: The expression gene set in Drosophila is mapped through homology to a gene set (in the target genome) whose expression is expected to be similar to that of predicted CRMs. Genes near predicted CRMs are tested for enrichment in this gene set, providing a preliminary statistical assessment (evaluation P value) of the predictions. *Additional data sets amenable to supervised CRM prediction in Drosophila are shown in supplementary table S2, Supplementary Material online. (b) Data sets amenable to cross-species supervised CRM prediction. Shown are the data sets where an evaluation P value ≤ 1E-5 was observed for at least one statistical model, in at least one non-Drosophila species. Color intensity of a cell is proportional to the negative logarithm of the evaluation P value, with any P value ≥ 1E-5 being represented as a white cell. The last row in top panel reports the total number of amenable data sets in each species. The bottom three rows show the number of data sets amenable to cross-species supervised CRM prediction (at the 1E-5 threshold) for each statistical model and each species. More detailed results are shown in supplementary table S2 and figure S2, Supplementary Material online. (c) Evaluation of three statistical models on known CRMs in An. gam, A. mel, and T. cas. For each CRM, the local rank over a 100-kb region (430 windows on average) surrounding the relevant gene, under each statistical model, is provided. Cases where local rank is ≤2 are highlighted. The given evaluation P value is the best from among the three statistical models. Global ranks for all three models are provided in supplementary table S5, Supplementary Material online.
F<sc>ig</sc>. 5.—
Fig. 5.—
(a) Experimentally validated enhancers from diverged arthropods. Predicted CRM sequences were used to drive reporter gene expression in transgenic Drosophila. Expression was visualized using immunohistochemistry (A, B, C, D, F, G, H, J) or in situ hybridization (E, I). All embryos are shown with anterior to the left. Panels (A), (B), (E), (H), (I), and (J) are lateral views with dorsal to the top; (C), (D), (F), and (G) are dorsal views. (A) A predicted T. cas wg CRM regulates gene expression in a pattern similar to that of the (B) Drosophila wg_Δwg enhancer (Von Ohlen and Hooper 1997) (compare arrows in [A] and [B]; panel B courtesy of Scott Barolo). Inset in (A) shows colocalization of GFP (green) and Wg (magenta) protein expression. (C) A predicted CRM for the T. cas Dichaete ortholog regulates gene expression in late-stage embryos identical to what is seen with the Drosophila Dichaete D_D/fsh_O-E enhancer (panel D; Ochoa-Espinosa et al. 2005). GFP expression in the anal ring (partially out of focus in C) likely represents perdurance of GFP protein from earlier stages as it is not observed using in situ hybridization. (E) A predicted early embryonic stripe CRM for the N. vit hairy ortholog gives a two-stripe pattern similar to that of a Drosophila hairy CRM (Howard and Struhl 1990) (see also fig. 6a). (F) A CRM for the N. vit neuralized gene drives expression in the central and peripheral nervous systems; arrow denotes the brain (see also supplementary fig. S3, Supplementary Material online). (G) A CRM for the ttk gene from A. mel regulates expression in the salivary gland and (H) the developing midgut; additional expression is shown in supplementary figure S3, Supplementary Material online. (I) A CRM predicted for An. gam sog regulates expression in the mesoderm during germ band extension. (J) A “false negative” result is obtained when a sequence not predicted to be a CRM, here from the A. mel wg locus, drives patterned gene expression (GFP expression, green). Note that unlike what we see with our predicted T. cas wg CRM (panel C), reporter gene expression in this case is not confined to Wg-expressing cells (magenta). (b) Summary of results from in vivo testing of 24 segments. Each segment is characterized as being a predicted CRM or not, and whether reporter activity was confirmed or not. (c) Summary of lines with positive expression. Shown are the numbers of lines with expression pattern matching to the gene or covered by one or more high scoring training sets.
F<sc>ig</sc>. 6.—
Fig. 6.—
(a) Modeled gene expression regulated by hairy CRMs in D. mel (“Dmel_h_stripe_2+6,” construct ET15 of Howard and Struhl [1990]) and N. vit (“Nvit_h_m8,” this study). Expression mediated by the N. vit hairy CRM (Nvit_h_m8-observed) has an anterior stripe that starts slightly anterior to the endogenous D. mel h stripe 1 (“Dmel_h-observed,” leftmost green bar) and ends just before the posterior margin of the stripe, whereas the posterior stripe begins immediately posterior to the endogenous stripe 5 and extends almost to the posterior margin of stripe 6 (“Dmel_h-observed,” rightmost green bar). The GEMSTAT model predicts similar expression profiles for both CRMs (Dmel_h_stripe_2+6-GEMSTAT, Nvit_h_m8-GEMSTAT), with a posterior stripe overlapping the endogenous hairy stripe 6 and a broad anterior domain that straddles endogenous D. mel stripes 1 and 2. (b) Modeled gene expression regulated by sog CRMs in D. mel (“Dmel_sog_shadow”; Hong et al. 2008) and An. gam (“An. gam_sog_1,” this study). The endogenous expression pattern of sog in D. mel is ectodermal (blue) and agrees with the GEMSTAT-predicted profile (red) for the Dmel_sog_shadow CRM. The same model predicts a mesodermal expression pattern as output of the Agam_sog_1 CRM as reported in this work.
F<sc>ig</sc>. 7.—
Fig. 7.—
Measures of sequence and motif similarity between CRMs. (a) Absence of alignment-based similarity. For each non-Drosophila CRM (columns) and each Drosophila gene locus (rows), defined as 20 kb on either side of the gene plus introns, we recorded the best LASTZ HSP score between the CRM and the gene. The two highest scoring genes for each CRM are shown in black and gray. For each CRM (column), the Drosophila ortholog of the regulatory target of the CRM is indicated by red borders. Note that only 4 of 32 CRMs are mapped by LASTZ to the expected gene locus (shaded cells with red border, Binomial test P value = 0.63). CRMs identified in this study are named as in supplementary table S6, Supplementary Material online. Previously known CRMs are named ending in _Rn, where “n” refers to the row number of the corresponding CRM in fig. 4c. (b) Evidence for similarity of motif composition. Each non-Drosophila CRM is scored by its best matching sequence window in each Drosophila gene locus, defined as in panel (a), using the Regulus similarity score. Only CRMs related to A/P or D/V patterning were examined as many of the relevant motifs are known for these. The two highest scoring genes for each enhancer are shown in black and gray, and a red border indicates the gene expected to harbor a homologous CRM. Note that 11 of 22 enhancers are mapped by Regulus to the expected gene locus (Binomial test P value = 4 × 10⁻⁵). CRM names are as in panel (a).
F<sc>ig</sc>. 8.—
Fig. 8.—
TF binding site motifs in functionally related CRM pairs. Binding site motifs are indicated by vertical colored bars, with bar heights correlating to degree of match to the motif. Horizontal green bars indicate the extent of the sequences tested in vivo. Dashed lines indicate motif similarities among nonorthologous CRMs or CRMs from different genera. For clarity, only a subset of conserved motifs are marked. (a) Motif alignment of the D. meltwi_dl_meltwi CRM and the orthologous sequence from four other Drosophilids with the An. gam twi CRM from Cande, Goltsev, et al. (2009). Blue bars highlight the similar “core” motif arrangement of sites for DORSAL lying between sites for ZELDA. Note the conserved arrangement of motifs as evidenced by lack of crossing of the dashed lines. (b) sog CRMs from Drosophila and Anopheles. The An. gam sog CRM from Cande, Goltsev, et al. (2009) is shown in the middle, aligned with two orthologous Anopheles sequences. The entire pictured sequence was confirmed in vivo. Aligned sequences from the Drosophila sog_broad_lateral_ectodermal_enhancer (BLNEE) are shown at the bottom. Alignments at the top represent the An. gam_sog_1 CRM (this study, fig. 5I) from An. gam and An. epiroticus. Close motif alignment can be observed between all three sets of CRMs, and for the CRM from Cande, Goltsev, et al. (2009) and its Drosophila counterparts in particular. Species abbreviations: Agam, Anopheles gambiae; Aara, An. arabiensis; Aepi, An. eprioticus; Aqua, An. quadriannulatus; Amer, An. merus; Amelas, An. melas; Dmel, Drosophila melanogaster; Dsec, D. sechellia; Dyak, D. yakuba; Dpse, D. pseudoobscura; Dana, D. ananassae; Dwil, D. willistoni; Dvir, D. virilis.

Similar articles

Cited by

References

    1. Aranda M, Marques-Souza H, Bayer T, Tautz D. The role of the segmentation gene hairy in Tribolium. Dev Genes Evol. 2008;218:465–477. - PMC - PubMed
    1. Arnold CD, et al. Genome-wide quantitative enhancer activity maps identified by STARR-seq. Science. 2013;339:1074–1077. - PubMed
    1. Arunachalam M, Jayasurya K, Tomancak P, Ohler U. An alignment-free method to identify candidate orthologous enhancers in multiple Drosophila genomes. Bioinformatics. 2010;26:2109–2115. - PMC - PubMed
    1. Awgulewitsch A, Jacobs D. Deformed autoregulatory element from Drosophila functions in a conserved manner in transgenic mice. Nature. 1992;358:341–344. - PubMed
    1. Ayyar S, Negre B, Simpson P, Stollewerk A. An arthropod cis-regulatory element functioning in sensory organ precursor development dates back to the Cambrian. BMC Biol. 2010;8:127. - PMC - PubMed

Publication types

Substances

LinkOut - more resources