Comparative Study
. 2014 Nov;142(1):167-81.
doi: 10.1093/toxsci/kfu166. Epub 2014 Aug 30.

Comparison of anorectic and emetic potencies of deoxynivalenol (vomitoxin) to the plant metabolite deoxynivalenol-3-glucoside and synthetic deoxynivalenol derivatives EN139528 and EN139544

Affiliations
Comparative Study

Comparison of anorectic and emetic potencies of deoxynivalenol (vomitoxin) to the plant metabolite deoxynivalenol-3-glucoside and synthetic deoxynivalenol derivatives EN139528 and EN139544

Wenda Wu et al. Toxicol Sci. 2014 Nov.

Abstract

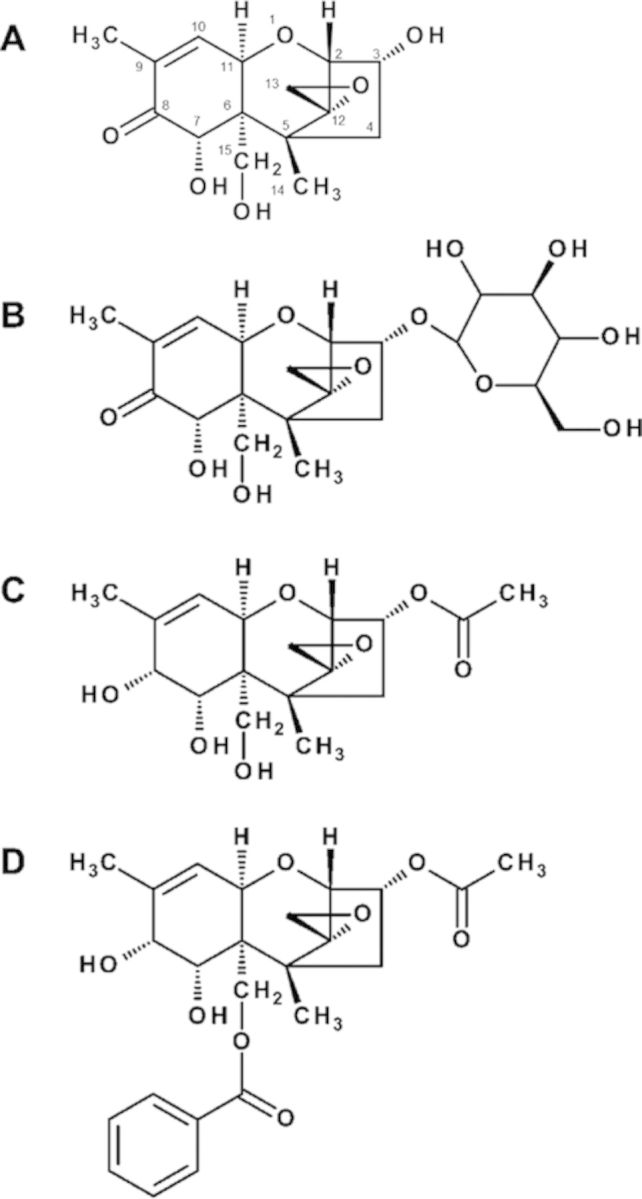
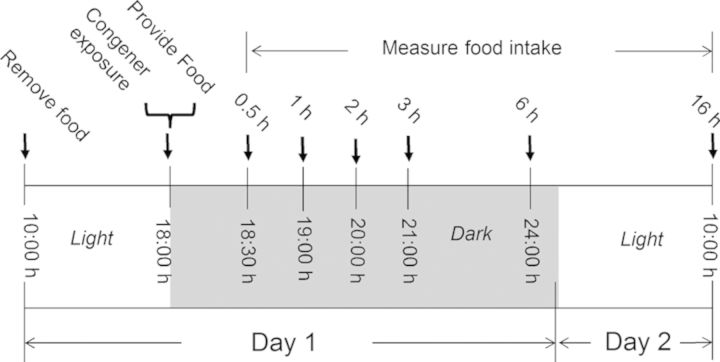
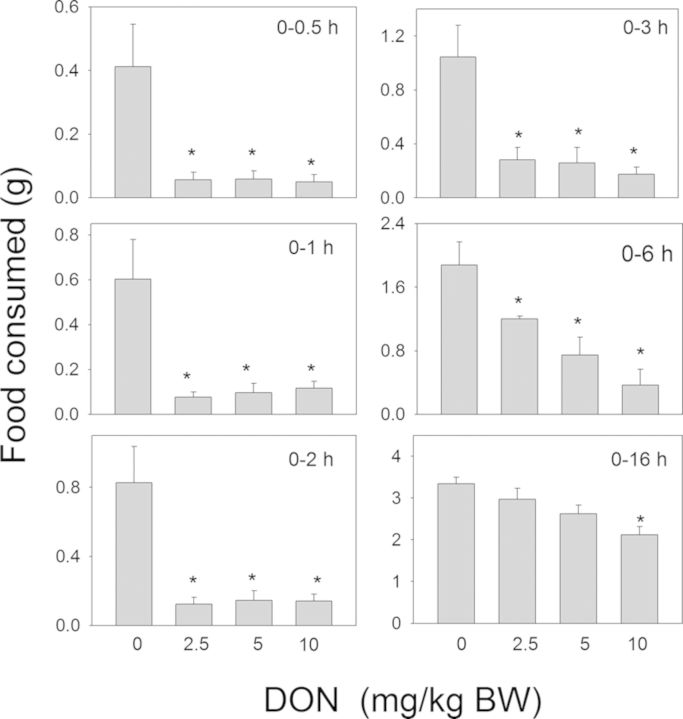
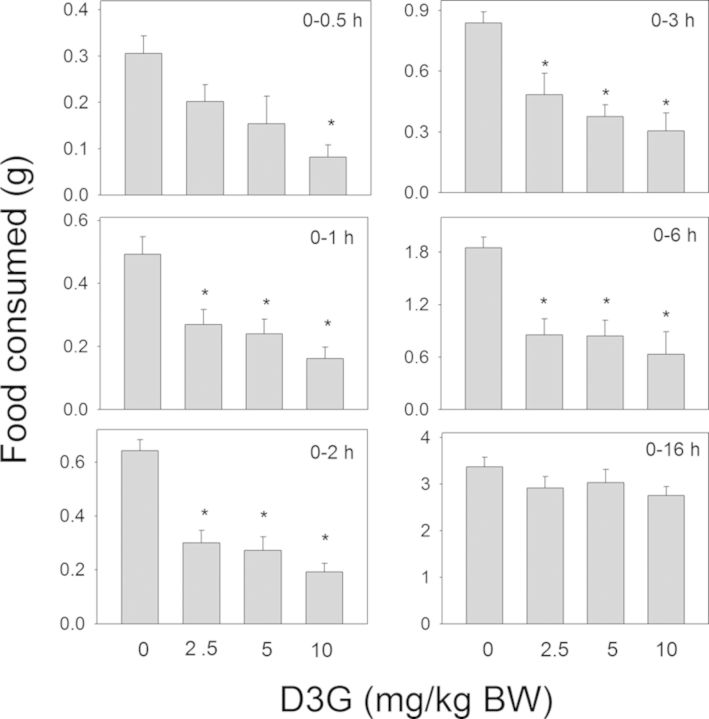
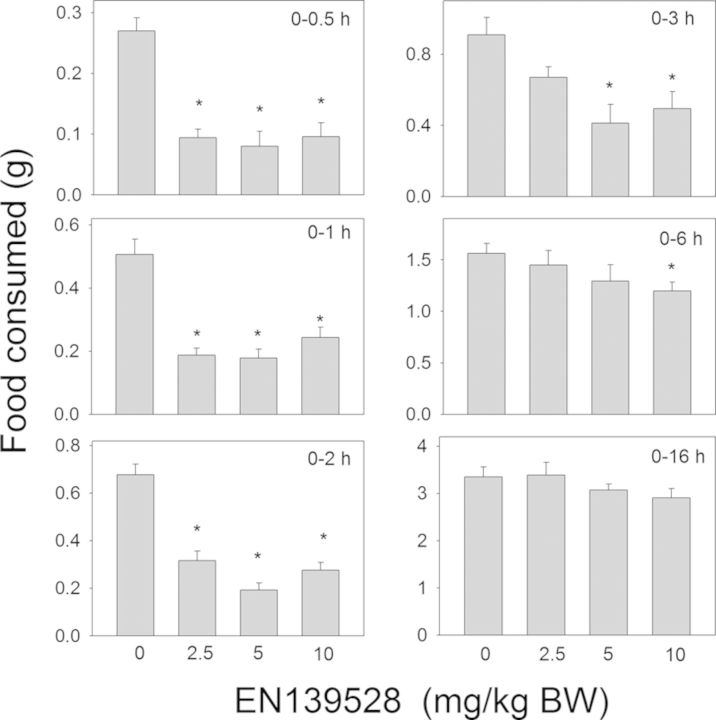
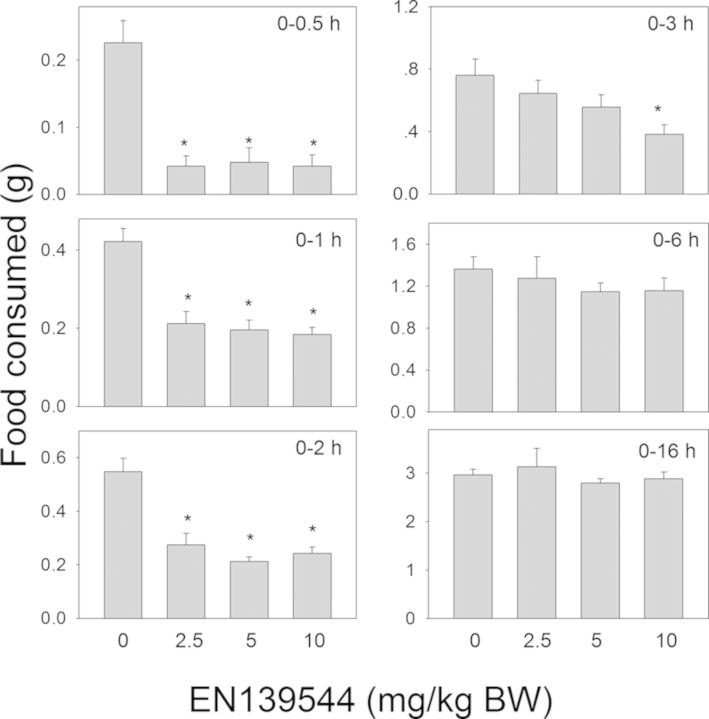
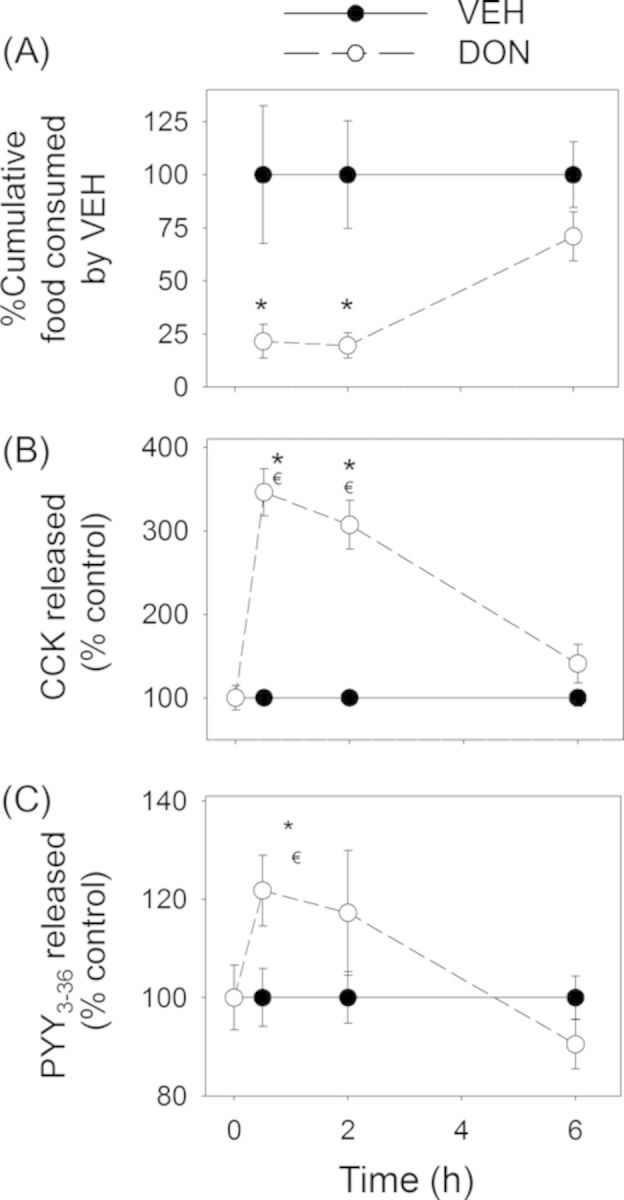
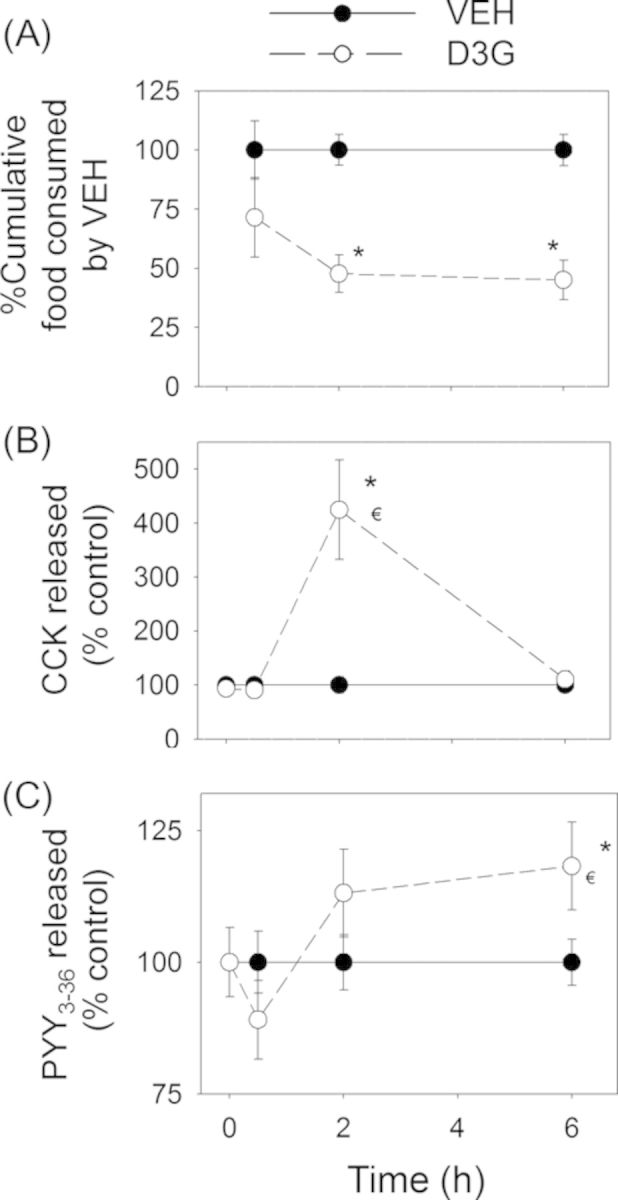
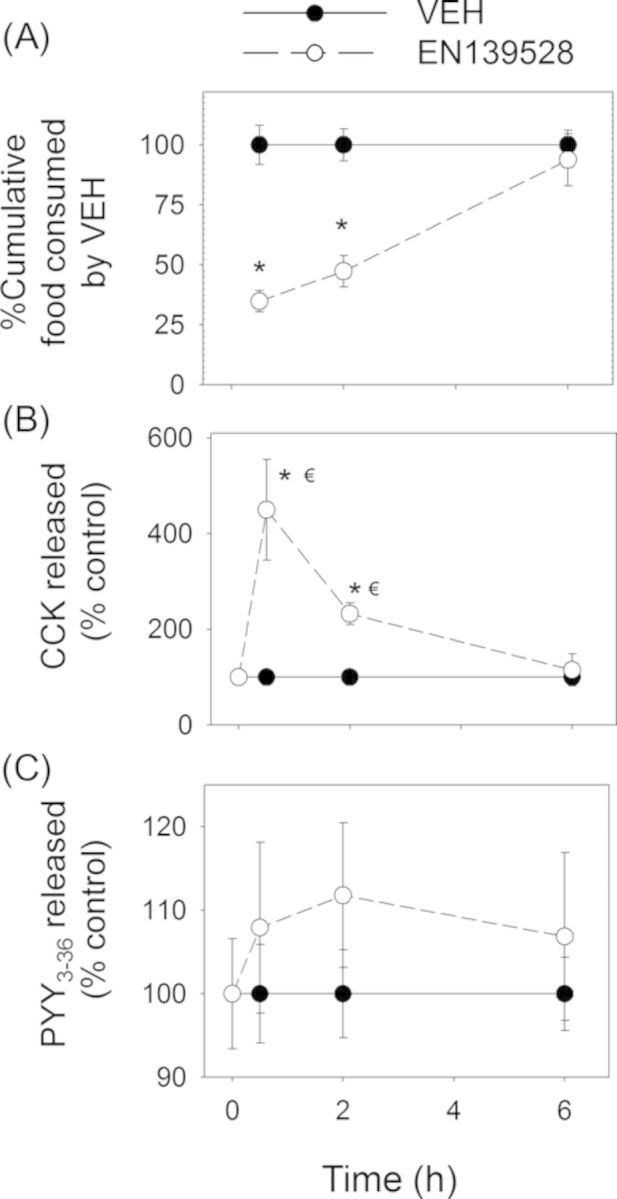
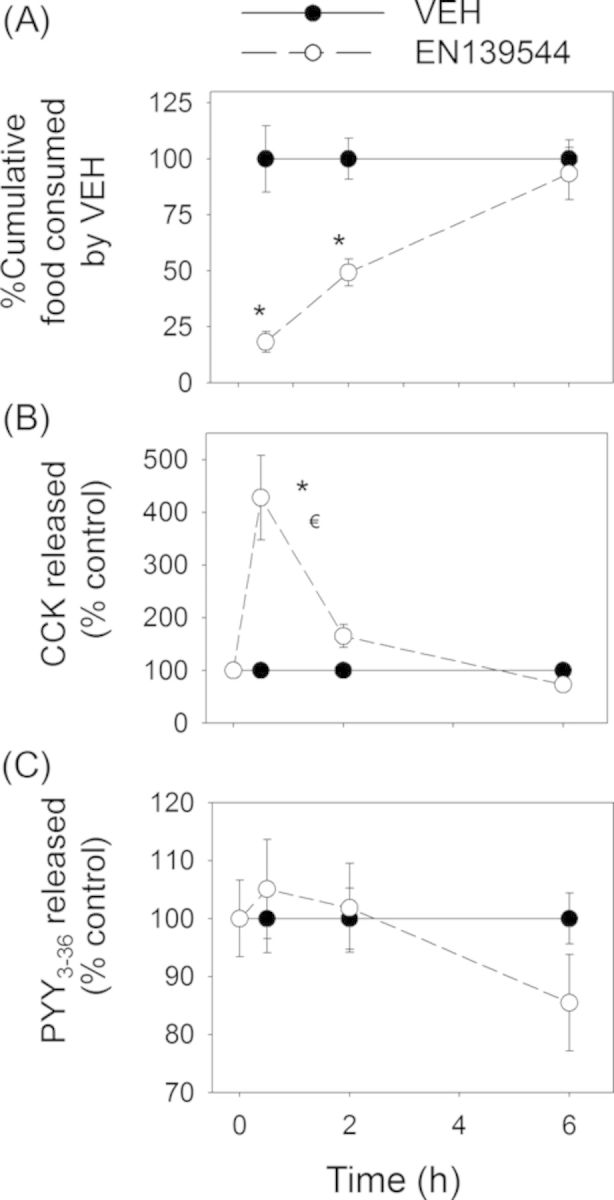
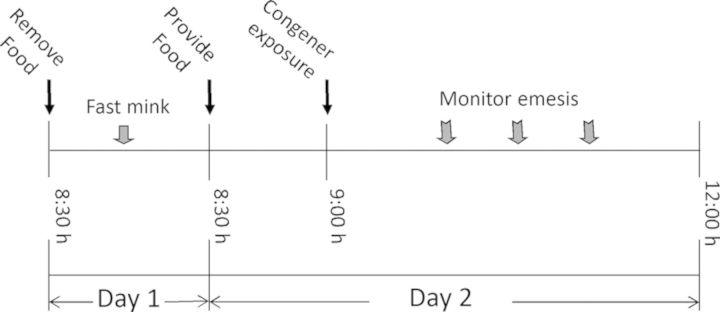
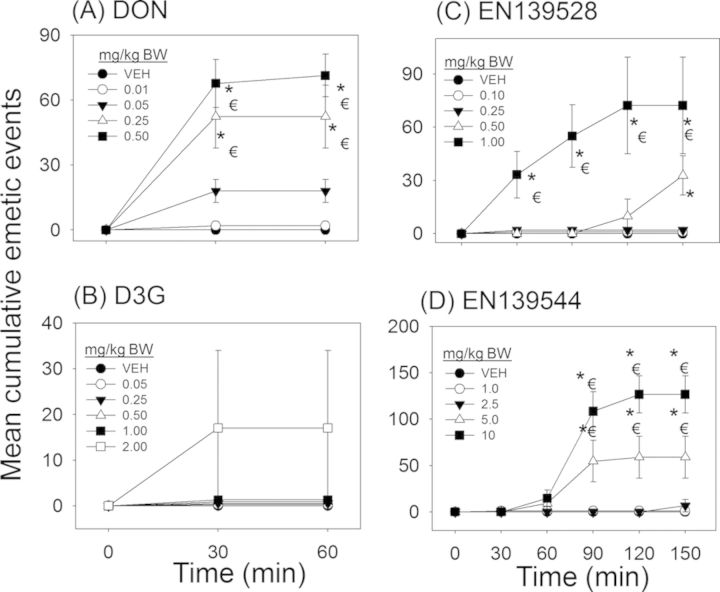
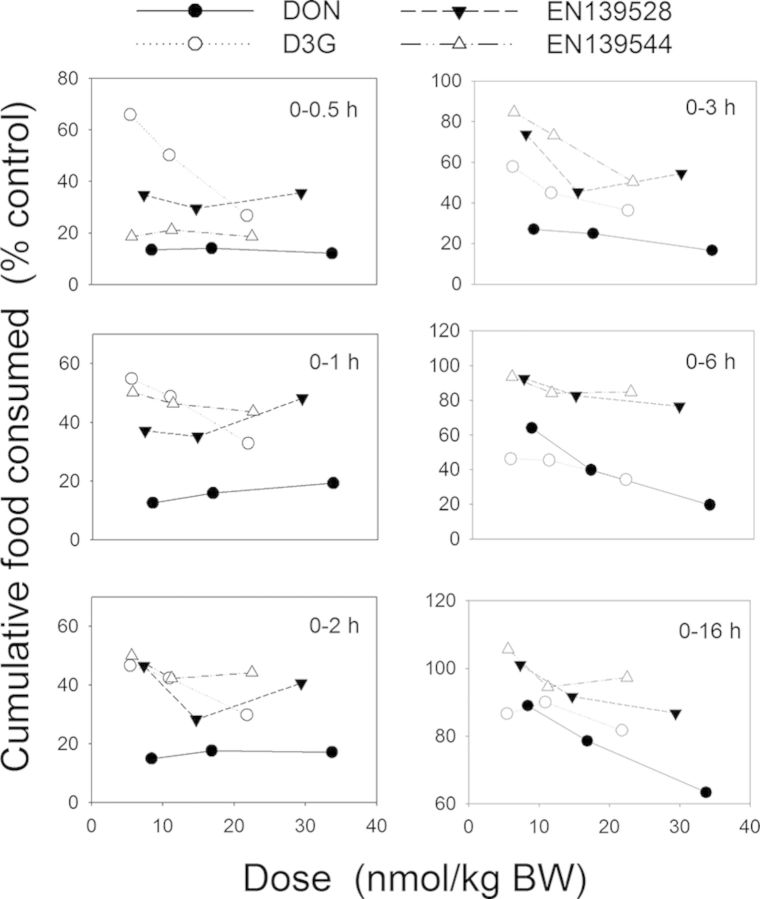
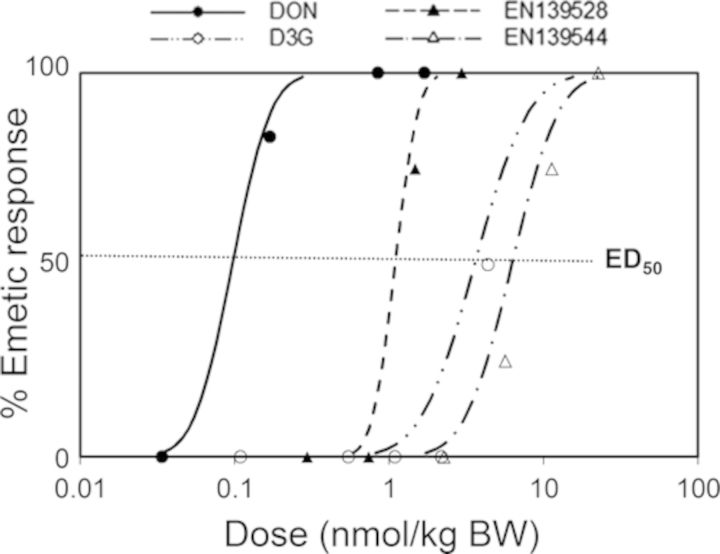
The mycotoxin deoxynivalenol (DON) elicits robust anorectic and emetic effects in several animal species. However, less is known about the potential for naturally occurring and synthetic congeners of this trichothecene to cause analogous responses. Here we tested the hypothesis that alterations in DON structure found in the plant metabolite deoxynivalenol-3-glucoside (D3G) and two pharmacologically active synthetic DON derivatives, EN139528 and EN139544, differentially impact their potential to evoke food refusal and emesis. In a nocturnal mouse food consumption model, oral administration with DON, D3G, EN139528, or EN139544 at doses from 2.5 to 10 mg/kg BW induced anorectic responses that lasted up to 16, 6, 6, and 3 h, respectively. Anorectic potency rank orders were EN139544>DON>EN139528>D3G from 0 to 0.5 h but DON>D3G>EN139528>EN139544 from 0 to 3 h. Oral exposure to each of the four compounds at a common dose (2.5 mg/kg BW) stimulated plasma elevations of the gut satiety peptides cholecystokinin and to a lesser extent, peptide YY3-36 that corresponded to reduced food consumption. In a mink emesis model, oral administration of increasing doses of the congeners differentially induced emesis, causing marked decreases in latency to emesis with corresponding increases in both the duration and number of emetic events. The minimum emetic doses for DON, EN139528, D3G, and EN139544 were 0.05, 0.5, 2, and 5 mg/kg BW, respectively. Taken together, the results suggest that although all three DON congeners elicited anorectic responses that mimicked DON over a narrow dose range, they were markedly less potent than the parent mycotoxin at inducing emesis.

Keywords: 5-hydroxytryptamine; EN139528; EN139544; anorexia; cholecystokinin; deoxynivalenol; deoxynivalenol-3-glucoside; emesis; mycotoxin; peptide YY3–36.


Figures

FIG. 1.
FIG. 1.
Structures of naturally occurring and synthetic DON congeners. Compounds are: (A) deoxynivalenol (DON), (B) DON-3-glucoside (D3G), (C) EN139528, and (D) EN139544.
FIG. 2.
FIG. 2.
Experimental design for anorexia bioassay of DON in mice. Mice were gavaged with DON, D3G, EN139528, and EN139544 immediately before the dark feeding cycle. Food intake was measured at 0.5, 1, 2, 3, 6, and 16 h post administration.
FIG. 3.
FIG. 3.
Oral exposure to DON impairs cumulative food intake for up to 16 h. Mice were gavaged with DON immediately before the dark feeding cycle and food intake was measured over 16 h. Data are mean ± SEM (n = 5/group) and analyzed by one-way ANOVA using Dunnett's Method. An asterisk indicates a statistically significant difference in cumulative food consumption between treatment and respective control (p < 0.05).
FIG. 4.
FIG. 4.
Oral exposure to D3G impairs cumulative food intake for up to 6 h. Mice were gavaged with D3G immediately before the dark feeding cycle and food intake was measured over 16 h. Data are mean ± SEM (n = 5/group) and analyzed by one-way ANOVA using Dunnett's Method. An asterisk indicates a statistically significant difference in cumulative food consumption between treatment and respective control (p < 0.05).
FIG. 5.
FIG. 5.
Oral exposure to EN139528 impairs cumulative food intake for up to 6 h. Mice were gavaged with EN139528 immediately before the dark feeding cycle and food intake was measured over 16 h. Data are mean ± SEM (n = 5/group) and analyzed by one-way ANOVA using Dunnett's Method. An asterisk indicates a statistically significant difference in cumulative food consumption between treatment and respective control (p < 0.05).
FIG. 6.
FIG. 6.
Oral exposure to EN139544 impairs cumulative food intake for up to 3 h. Mice were gavaged with EN139544 immediately before the dark feeding cycle and food intake was measured over 16 h. Data are mean ± SEM (n = 5/group) and analyzed by one-way ANOVA using Dunnett's Method. An asterisk indicates a statistically significant difference in cumulative food consumption between treatment and respective control (p < 0.05).
FIG. 7.
FIG. 7.
Experimental design for relating anorectic effects of DON congeners to plasma CCK and PYY3–36 concentrations in mice. Mice were gavaged with DON immediately before the dark feeding cycle and food intake was measured over 16 h. Mice were orally gavaged with either PBS or 2.5-mg/kg bw DON congeners. Cumulative food intake was measured and plasma analyzed for CCK and PYY3–36 at 0, 0.5, 2, and 6 h post administration.
FIG. 8.
FIG. 8.
DON-induced anorectic response corresponds to plasma CCK and PYY3–36 elevation. Mice were orally gavaged with either PBS (solid lines) or 2.5-mg/kg BW DON (broken lines). (A) Rapid and transient anorectic effect following oral exposure to DON. Data are mean ± SEM (n = 5/group). Two-way repeated ANOVA (one factor) using the Holm-Sidak Method was used to analyze significant differences in food consumption as compared with the control. Symbol: * indicates a statistically significant difference in cumulative food consumption relative to the control at specific time point (p < 0.05). (B) Plasma CCK and (C) PYY3–36 elevation in mice. Data represent mean ± SEM (n = 6/group). Two-way ANOVA using Bonferroni t-test was used to assess significant differences in kinetics of CCK and PYY3–36 concentrations in plasma as compared with the control. Symbols: * indicates a statistically significant difference in plasma CCK or PYY3–36 concentration relative to the control at specific time point (p < 0.05). ŧ indicates a statistically significant difference in plasma CCK or PYY3–36 concentration relative to the 0-h time point (p < 0.05).
FIG. 9.
FIG. 9.
D3G-induced anorectic response corresponds to plasma CCK and PYY3–36 elevation. Mice were orally gavaged with either PBS (solid lines) or 2.5-mg/kg bw D3G (broken lines). Experiment was conducted and data were analyzed as described in the Figure 8 legend.
FIG. 10.
FIG. 10.
EN139528-induced anorectic response corresponds to plasma CCK elevation. Mice were orally gavaged with either PBS (solid lines) or 2.5-mg/kg BW EN139528 (broken lines).Experiment was conducted and data were analyzed as described in the Figure 8 legend.
FIG. 11.
FIG. 11.
EN139544-induced anorectic response corresponds to plasma CCK elevation. Mice were orally gavaged with either PBS (solid lines) or 2.5-mg/kg BW EN139544 (broken lines). Experiment conducted and data analyzed are the same as in the Figure 8 legend.
FIG. 12.
FIG. 12.
Experimental design for comparing effects of oral exposure with DON congeners on emesis in mink.
FIG. 13.
FIG. 13.
Differential effects of DON congeners on cumulative emetic events in mink. Mink were orally gavaged with (A) DON, (B) D3G, (C) EN139528, and (D) EN139544 at indicated doses and emesis monitored over time. Data are averages for both responders and non-responders and represent mean ± SEM (n = 4–6/group). A two-way ANOVA using Bonferroni t-test was used to assess significant differences in cumulative emetic event in mink. Symbols: * indicates statistically significant differences in cumulative emetic episodes concentrations compared with the control (p < 0.05). ŧ indicates a statistically significant difference relative to the 0-min time point within a given dose (p < 0.05).
FIG. 14.
FIG. 14.
Summary of comparative anorectic effects of DON, D3G, EN139528, and EN139544 as a function of molar dose.
FIG. 15.
FIG. 15.
Summary of comparative emetic effects of DON, D3G, EN139528, and EN139544 as a function of molar dose.

Similar articles

Cited by

References

    1. Amuzie C. J., Harkema J. R., Pestka J. J. Tissue distribution and proinflammatory cytokine induction by the trichothecene deoxynivalenol in the mouse: Comparison of nasal vs. oral exposure. Toxicology. 2008;248:39–44. - PubMed
    1. Andrews P. L., Horn C. C. Signals for nausea and emesis: Implications for models of upper gastrointestinal diseases. Auto. Neurosci. 2006;125:100–115. - PMC - PubMed
    1. Azcona-Olivera J. I., Ouyang Y., Murtha J., Chu F. S., Pestka J. J. Induction of cytokine mRNAs in mice after oral exposure to the trichothecene vomitoxin (deoxynivalenol): Relationship to toxin distribution and protein synthesis inhibition. Toxicol. Appl. Pharmacol. 1995;133:109–120. - PubMed
    1. Batterham R. L., Cowley M. A., Small C. J., Herzog H., Cohen M. A., Dakin C. L., Wren A. M., Brynes A. E., Low M. J., Ghatei M. A. Gut hormone PYY3–36 physiologically inhibits food intake. Nature. 2002;418:650–654. - PubMed
    1. Berthiller F., Crews C., Dall'Asta C., Saeger S. D., Haesaert G., Karlovsky P., Oswald I. P., Seefelder W., Speijers G., Stroka J. Masked mycotoxins: A review. Mol. Nutr. Food Res. 2013;57:165–186. - PMC - PubMed

Publication types

MeSH terms